Volume Rendering of Abdominal Aortic Aneurysms Roger C. Tam1 , Christopher G. Healey2 , Borys Flak3, and Peter Cahoon1 Departments of Computer Science and Radiology, University of British Columbia EECS Department, CS Division, University of California at Berkeley
ABSTRACT Volume rendering is a valuable and important technique for scientific visualization. One well known application area is the reconstruction and visualization of output from medical scanners like computed tomography (CT). 2D greyscale slices produced by these scanners can be reconstructed and displayed onscreen as a 3D model. Volume visualization of medical images must address two important issues. First, it is difficult to segment medical scans into individual materials based only on intensity values. This can result in volumes that contain large amounts of unimportant or unnecessary material. Second, although greyscale images are the normal method for displaying medical volumes, these types of images are not necessarily appropriate for highlighting regions of interest within the volume. Studies of the human visual system have shown that individual intensity values are difficult to detect in a greyscale image. In these situations colour is a more effective visual feature, since the lowlevel visual system can rapidly and accurately detect the presence or absence of a particular target colour in a multi-coloured image. We addressed both problems during the visualization of CT scans of abdominal aortic aneurysms. We have developed a classification method that empirically segments regions of interest in each of the 2D slices. We use a perceptual colour selection technique to identify each region of interest in both the 2D slices and the 3D reconstructed volumes. The result is a colourized volume that the radiologists are using to rapidly and accurately identify the locations and spatial interactions of different materials from their scans. Our technique is being used in an experimental post-operative environment to help to evaluate the results of surgery designed to prevent the rupture of the aneurysm. In the future, we hope to use the technique during the planning of placement of support grafts prior to the actual operation. Keywords — aneurysm, colourization, computed tomography, CT, image processing, medical imaging, scientific visualization, segmentation, volume rendering.
1
INTRODUCTION
Volume visualization displays data representing volumetric objects as 3D models on a computer screen. Volume rendering focuses on one part of the volume visualization problem: the reconstruction and display of the 3D model. This allows users to view their data sets in an appropriate three-dimensional context. Various techniques, such as the use of transparency and cutting planes, can be used to simultaneously display both the surface and the interior of the volume. 1 Department of Computer Science, University of British Columbia, 2366 Main Mall, Vancouver, British Columbia, V6T 1Z2, Canada 2 EECS Department, CS Division, University of California at Berkeley, 549 Soda Hall #1776, Berkeley, California, 94720-1776 3 Department of Radiology, University of British Columbia, Vancouver, British Columbia, V6T 1Z3, Canada
Figure 1: Scanning and 3D reconstruction, a medical scanner generates 2D slices, which are segmented, coloured, and reconstructed into a 3D volume One important application of volume visualization is the display of 3D medical volumes. Medical techniques like computed tomography (CT) and magnetic resonance imaging (MRI) use equipment that scans the body in a user-chosen direction. The result is a set of 2D intensity maps representing cross-sectional slices through the body. Different intensities in a slice correspond to different materials (e.g., bone, muscle, and fat) detected during the scan. The intensity values returned by the scanner are often adjusted to try to highlight areas of interest within the volume. Stacking the slices together and resampling the data allows for the reconstruction of a volume representation of the scanned region (Figure 1). Finally, the results are displayed onscreen, allowing radiologists to visually explore and analyze the output of the medical scanner. Although 3D reconstructed volumes are often a dramatic improvement over the original 2D slices, the techniques used to build the volumes must address a number of important problems. Different materials detected during the scan will have overlapping greyscale ranges. This makes it difficult to isolate a particular type of material based only on the intensity values in the 2D slices. The 3D reconstructed volumes are often displayed in greyscale, using pixel intensities that are directly proportional to tissue density. In many cases this is appropriate, since difference in intensity most effectively captures the high spatial-frequency differences that occur in these types of images. However, greyscale images may not be as useful when a user is searching for the location of a particular material within the volume. Partial occlusion of the interior of the volume, the inability of the low-level visual system to rapidly and accurately find specific intensity values, and the possibility of overlapping greyscale ranges can combine to result in a time consuming search through the image. In the worst case, the material in question may be accidentally overlooked, reducing the value of the effort spent to build and display the volume. In this paper we address both problems in the context of a specific set of medical images: CT scans of abdominal aortic aneurysms. First, we have developed a new classification method to empirically determine the correct boundaries for regions of interest in our scans; material that does not correspond to one of these regions is eliminated from each of the 2D slices. Second, we use a colourization technique to distinguish each of our regions of interest in both the 2D slices and the 3D reconstructed volume. A perceptual colour se-
Tynes
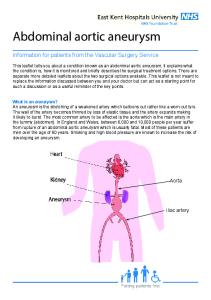
Figure 3: Stent grafts, showing a bifurcation graft placed in the iliac arteries (upper image), and a close-up of a graft and the tynes used to support it and hold it in place in the artery (lower image) Figure 2: An image of the abdominal anatomy, showing the major arteries and organs of interest
lection algorithm is used to guarantee that the colours we choose are all equally differentiable from one another. The result is a colourized volume that the radiologists can use to rapidly and accurately identify the exact locations of individual materials of interest. Our techniques are being used in an experimental post-operative environment to assess the effectiveness of grafts placed within aortic aneurysms. In the future, we hope to use our visualizations to help to plan placement of the grafts prior to an operation.
1.1 Abdominal Aortic Aneurysms An abdominal aortic aneurysm (AAA) is a focal dilation of the abdominal aorta (which has a normal diameter 2cm) usually below the level of the renal arteries (Figure 2). Patients that develop AAAs likely have a basic genetic predisposition as this disease unequivocally runs in families. Other contributing factors probably include smoking and high blood pressure. By the age of 80, over 5% of white males will develop an AAA. AAAs are among the top ten causes of death in white males over 55, due to their propensity to silently enlarge and subsequently rupture resulting in shock and ultimate death in more than 80% of cases. For unknown reasons the prevalence in elderly males is five times that of females. Size of the AAA is the best predictor of risk of rupture. Over a period of only a few years an AAA measuring 5 to 6cm in diameter has a rupture rate of about 50%. Therefore, most surgeons agree that a repair should be undertaken unless there are other underlying medical conditions making the procedure too risky. Other worrisome features heightening the risk of imminent rupture include rapid expansion of the AAA (greater than 0.5cm/yr) or the development of abdominal pain unexplained by other causes. Traditional repair of an AAA entails a major operation with an incision into the aneurysm, evacuation of the clot contained within, placement of a synthetic graft, and wrapping of the graft with the remnants of the wall of the AAA. Mortality rates from the surgery are in the range of 1 to 2%. The associated hospital stay is typically 7 to 10 days, several of which are spent in the intensive care unit. The patient generally requires 6 to 8 weeks of recovery at home prior to commencing normal activity. Many elderly patients are simply in too poor a medical condition to survive the surgery. Because of these factors a new treatment option, endovascular stenting, has been proposed and is currently undergoing clinical trials. This pro-
To appear in IEEE Visualization ’97, March 31, 1997, Phoenix, Arizona
cedure does not require general anaesthesia and can be done less invasively by simply placing a self-expanding stent (Figure 3) via a catheter into the AAA to stabilize it. Less fit patients are able to withstand the procedure, hospital stay is cut to 1 to 2 days, and postoperative recovery is shortened considerably. Several key pieces of information are necessary prior to undertaking any repair (either operative or endovascular), including: accurate measurement of AAA diameter and length, determination of distance between the renal arteries and the proximal end of the AAA, and measurement of the distance between the distal end of the AAA and the aortic bifurcation (Figure 2). There are a number of imaging modalities available including angiography, ultrasound, computed tomography (CT) and magnetic resonance imaging (MRI) which are capable of providing the answers to varying degrees, but all suffer from a number of shortcomings. Therefore, we have turned to 3D reconstruction of axial spiral CT images (MRI images could be used interchangeably) in an attempt to solve the shortcomings. Spiral CT enables extremely fast scanning through the range of the AAA. This allows a volumetric data set to be obtained free of misregistration artifacts. Optimum opacification of the aorta, which brightens the vessel in greyscale images, can be done using an intravenous contrast material. This improves the ease of segmentation. The volumetric data also allows for overlapping reconstructions of thinly collimated scans, which further enhances resolution in the Zaxis, thereby reducing staircase artifacts. We hypothesize that 3D reconstructions that can be rotated and viewed from any angle will be the most accurate representation of the relationship between the neck of the aneurysm and the renal arteries and thus will provide the best measurements. This can often be difficult to appreciate in 2D due to the tortuosity (that is, the amount of twisting and bending) of the aorta in this region. Measuring distances accurately is paramount to both types of repair. In the case of operative repair one must determine if there is adequate space to clamp the aorta, and in the case of endovascular repair if adequate space is available to anchor the stent below the renal arteries. Positioning the stent inappropriately across the renal arteries would result in their occlusion, most likely leading to permanent renal failure. Measuring the distance between the distal end of the AAA and the aortic bifurcation will determine whether a tube stent can be used, or whether a more complicated bifurcation stent or graft will be necessary. Accurate diameter measurement of the AAA is required to properly size the stent. This is optimally done at right
angles to the long axis of the AAA, a view that is difficult to provide using only 2D slices. Improper sizing may result in leakage of blood around the graft, which defeats the purpose of the procedure (i.e., the prevention of further AAA expansion). An incorrectly sized stent might also dislodge and drift downstream. The length of the AAA, ideally along the bloodflow centerline, needs to be known to determine proper stent length. Again, this representation is only available in a 3D image. A stent that is too short may result in subsequent AAA development in the unprotected segment of the aorta, while a stent that is too long may result in the stent kinking. Finally, a post-operative rendering can be useful for judging final stent position.
1.2 Volume Visualization There are many three-dimensional rendering methods available for visualizing medical data. We believe that volume rendering [4] is the most appropriate for our application. This technique produces high quality images without any intermediate geometric representation, which may be time-consuming to generate. In our case, the metal tynes that support the stent graft form a pattern (Figure 3) that would be extremely difficult to reconstruct using a surface-based method. The resulting images have also been shown to be very effective in the portrayal of the relationships among anatomical structures [9], especially through the use of colour and transparency. This is important, since the aneurysm surrounds the aorta and the stent graft. Volume rendering is the most effective way to see the entire stent graft and aorta without losing detail contained in the aneurysm. Also, since volume rendering preserves information about each object’s interior as well as its surface, clipping the volume at various angles can be used as an effective method for measuring parts of the volume. This technique can provide the radiologists with the accurate AAA measurements they require during their surgical procedures. This paper presents the results to date of our research into using volume rendering for the analysis of AAAs. This work is similar in principle to [1], but has a less clinical emphasis. Rather, we focused on reconstruction methodologies and the use of perceptual rules during volume rendering. The next three sections describe in detail our techniques for segmenting and classifying the 2D slices, colouring the resulting regions of interest, and displaying and manipulating the reconstructed volume.
2
METHODOLOGY
2.1 Segmentation and Classification Segmentation involves processing the raw greyscale images to enable or enhance the visualization of structures that are useful for analysis, while suppressing or eliminating the structures that would otherwise obstruct our view of the areas of interest. In our case, the objects that we need to view as clearly as possible are the aorta and branch vessels, the aneurysm, and the metal tynes that support the stent graft. The Dacron fabric of the stent graft does not appear appreciably in the 2D images, so the tynes are the only way of determining the position of the graft. Objects such as the spine, kidneys, and fatty tissue should not appear to any significant extent in the volume rendering. There are many segmentation methods available, ranging in complexity from manual editing to knowledge-based domain-specific techniques. The decision of which methods to use depends on characteristics of the greyscale images and properties of the volume renderer. For example, probabilistic classifiers, which assign the percentage of individual tissues within each voxel from greyscale intensities or CT values [4, 5], have trouble separating structures that
To appear in IEEE Visualization ’97, March 31, 1997, Phoenix, Arizona
have similar greyscale ranges in the 2D images. Using a combination of techniques, such as those described in [6] for visualizing livers with tumors, is often the most effective approach. In our case, we find that a combination of simple cropping and percentage classification can separate out most of the structures of interest. Percentage classification is a generalized form of thresholding that allows a voxel to contain a mixture of tissue types. This minimizes aliasing effects such as staircasing or jagged edges at tissue-density transitions [8]. We use percentage classification to create smooth and accurate boundaries between the tynes and the aorta and between the aneurysm and air. Unfortunately, using percentage classification to separate the aorta and air introduces two visual artifacts into our volume. The first occurs when we pass from air into a blood vessel. In the greyscale slices air is black (an intensity value 0), the aneurysm is grey (intensity values ranging from approximately 0.4 to 0.5), and blood vessels are bright white (an intensity value near 1.0). If we use percentage classification, voxels at the boundary of a blood vessel will be classified as some part air and some part vessel. This will result in an intermediate intensity for the voxel. If that intermediate intensity happens to lie in the greyscale range for the aneurysm, the voxel will be incorrectly classified as part of the aneurysm. The second type of visual artifact also occurs at the wall of a blood vessel. Percentage classification will identify voxels on the boundary of the vessel as some part vessel wall and some part surrounding material. In order to provide effective antialiasing, we need to assign a reasonably large opacity to the vessel walls. However, the stent grafts lie inside the vessel walls. Increasing the opacity of the walls hides the grafts and their corresponding tynes. Since clarity of the tynes is vital to analyzing which parts of the vessel wall are supported, we decided that most of the vessel wall should be thresholded out. In cases where there is no stent graft, visibility of the tynes is not an issue, and aliasing by default is significantly reduced. Because of the visual artifacts described above, we chose to use simple thresholding to segment the blood vessels. Using our intensity-based techniques, the most problematic object to segment is the aneurysm itself, because of its similarity in intensity to other soft tissue that often surrounds it. In most cases the aneurysm spans only 30 to 40 slices, and is fairly well-defined in shape in the 2D images. Because of this, it is easy for the radiologists to identify slices that contain some part of the aneurysm. For slices that do not contain aneurysm tissue, pixel values with similar intensity ranges can simply be classified as air. For slices that do contain the aneurysm, a number of manual and semi-automatic techniques were investigated to try to segment the aneurysm (e.g., interactive clipping planes and region growing), however, none of these methods gave completely satisfactory results. Moreover, in order to reconstruct the volume quickly, we would like to avoid as much human-interaction as possible when the slices are segmented. Accurate boundary values are required for percentage classification and thresholding. We have developed an effective method for empirically determining these values. Since CT images are typically 16-bit, and most display systems do not support greyscale images greater than 8 bits deep, scaling is usually required to visualize the 2D slices. This can cause loss of information in cases in which we are interested in objects at both the high and low ends of the intensity range. In our case, the blood vessels and tynes have the highest intensity values, whereas the aneurysm has much lower intensities. Scaling the entire range down to 256 values causes the boundaries between the blood vessels and the tynes to become indistinct. Figure 4a shows this lack of definition when we try to view all the regions of interest simultaneously. Our solution is to analyze the high and low-order bytes of the image separately, thereby minimizing unnecessary scaling. Two images of the slice are formed, one using only the high-order bytes (Figure 4b), the other using only the low-order ones (Figure 4c). The high-order image shows the high-
est pixel intensities, quantized into ranges of width 256. For example, a pixel with intensity value 1 is actually a pixel with an intensity value between 28 and 29 1 in the original image. This gives a rough classification of the high pixel values. We then adjust this image with information gained from looking at the low-order image, which contains information about the variations within these ranges, as well as the lower intensity pixel values, until we get an image that is representative of the classification that we want (Figure 4d). In our case, the low-order image contains all of the aneurysm intensities, as well as those of the blood vessel walls. Figure 4b shows the tynes and the aorta very clearly, with some “bleeding” from the tynes, an effect that is typical when metal objects are scanned with CT. Figure 4c shows the boundary of the aneurysm very clearly. We start with (b) and bring in parts that we want from (c). In essence, (b) is used as a mask, and the strength of the mask at each pixel depends on properties derived from (c). We obtain important characteristics from both images (i.e., the boundaries between the aorta and the tynes from Figure 4b, and the boundary of the aneurysm itself from Figure 4c). These characteristics are necessary to produce Figure 4d, which shows the tynes (with no bleeding), the aorta and the aneurysm all very clearly. Note that noise within the aorta in (c), an artifact created by splitting the original image, exactly cancels that from (b). Although the adjustment stage requires some human intervention, once a classification for a certain scanning protocol has been determined, it never needs to be changed. The classification can automatically segment any scan derived from the given CT protocol. Protocols for a given patient condition change infrequently in a clinical environment, so the need to perform this adjustment procedure is rare. The advantages of analyzing the two bytes separately include having to look at far fewer pixel values in general, being able to view all of the data simultaneously without scaling, and the inherent simplicity of the method. In all of the cases to date, our classification and rendering techniques give the aneurysm enough clarity so that other segmentation methods are unnecessary. We believe this method has potential application in analyzing other types of highcontrast scans. Once the classifications have been determined, a colour and an opacity is assigned to each tissue type. The tynes are given the highest opacity, followed closely by the blood vessels. The aneurysm is given approximately half the opacity value of the blood vessels. The result is an image where the tynes and aorta show through the aneurysm very well, giving a complete 3D view of structural relationships between the three objects of interest.
,
(a)
(b)
(c)
Aneurysm
2.2 Colourization Tynes
Aorta
(d)
Figure 4: Segmentation and classification of a 2D CT slice; (a) the original slice with greyscale intensities reduced to 8 bits; (b) the high intensity pixel values, quantized into ranges of width 256; (c) the low intensity pixel values; (d) the segmented result
To appear in IEEE Visualization ’97, March 31, 1997, Phoenix, Arizona
We use colour to highlight each of the three objects of interest (the arteries, the aneurysm, and the tynes) in our reconstructed 3D volumes. Normally, greyscale images are used to visualize 3D medical volumes [11, 10], because the high spatial-frequency components in a typical medical volume are most easily detected by the visual system through differences in luminance. The radiologists are interested in rapidly identifying the general location of each object of interest, in particular they want to see where the tynes lie within the arteries and the aneurysm. We felt representation using colour would be most effective for this type of visual region detection. Studies of the human visual system have shown that only the two end values of a greyscale range can be rapidly and accurately detected in a greyscale image [13, 12]; values from the interior of the range are much more difficult to identify. Previous work in our laboratory found that up to seven different colours can be displayed simultaneously, while still allowing a viewer to rapidly and accurately determine whether any one of the colours is present or absent in an image [7]. Finally, our segmen-
tation procedure allows us to identify uniquely the three objects of interest. Material that does not correspond to one of these objects is removed from the CT slices before they are visualized. We use our colour selection algorithm to choose three colours to represent the three objects in our reconstructed volumes. The colours are chosen to maximize perceived difference to one another using a multi-criteria selection technique [7]. This is in contrast to the traditional methods of colour selection for medical volumes, which are largely based on aesthetics [8]. In our case, selection is performed in a perceptually balanced colour model, where the Euclidean distance between pairs of colours can be used to approximate their perceived colour difference. We use the CIE LUV colour model, although any perceptually balanced model can be chosen. Colours are selected such that:
� � �
The distance between them is constant and above a minimum threshold. Each colour can be separated from all of the other colours by a straight line. Each colour occupies a unique named colour region, that is, no two colours occupy the same named colour region.
Results from the original colour selection experiments showed that all three effects need to be considered to guarantee equally distinguishable colours. The algorithm begins by defining a colour region from which to choose colours. Individual colours are selected from the boundary of this region. Each colour is chosen such that it has minimum distance and linear separation from all the other colours. Normally, colour distance (to the nearest neighbour) and linear separation are held constant for each colour. For example, in Figure 5 we are choosing five colours that lie along the circumference of a circle. The circle sits in a 2D isoluminant slice through the CIE LUV colour model. By selecting colours that are equidistant around the circle, we guarantee that each colour has a constant distance d to its two nearest neighbours, and a constant linear separation l from all the other colours.
quickly divide any part of a colour model (in this case, the circumference of a circle embedded in CIE LUV) into named regions. Our technique uses an automatic step to initially divide the model into ten named regions. This is followed by a short experimental step, where individual users name representative colours from each of the ten regions. This allows us to compress regions that have a high perceptual overlap with one another. In our example two regions were compressed, resulting in the final eight regions shown in Figure 5. Notice that the five example colours we have chosen are all located in their own named region. Although the original experiments were restricted to isoluminant colours (i.e., colours with the same perceived brightness), for the CT images we choose colours with different intensities. There is evidence which shows that a random intensity pattern masks the identification of colour boundaries [3]. However, in our images individual colour regions are spatially connected, resulting in spatially coherent intensity regions (as opposed to a random pattern of different intensities). Using colours with different intensities allows us access to a larger number of named colour regions (e.g., colours that we name “yellow” must be bright, otherwise they are named “brown”). Using colours with different intensities also helps to highlight the boundaries between different objects of interest. The radiologists ask us to avoid using greens during visualization, since green and green-yellow are conceptually identified as bile in these types of medical images. We used our selection technique to choose colours from the non-green regions of our monitor’s colour gamut. The result was three colours: a purple-blue (monitor RGB=142, 141, 163) that is used to represent the aneurysm, a yellow (monitor RGB=194, 149, 8) that is used to represent the blood vessels, and a red (monitor RGB=255, 0, 6) that is used to represent the tynes. The three objects of interest are visualized in colour in both the 2D CT slices and the 3D reconstructed volume. There was some concern that the alpha-blending used to visualize the 3D volume might skew our colours. However, the final images do not exhibit this problem. The colours we chose allow the radiologists to rapidly and accurately identify the exact locations of the tynes, the arteries, and the aneurysm.
2.3 Volume Rendering yellow 80.0
60.0
orange
green d
v*
40.0
l
red
20.0
d 0.0
-20.0
magenta
aqua
-40.0
blue -60.0
-40.0
-20.0
purple 0.0
20.0
40.0
60.0
80.0
u*
Figure 5: Five colours selected along the circumference of a circle embedded in a slice through the CIE LUV colour model; each colour is equidistant along the circle, to guarantee a constant distance d to its two nearest neighbours, and a constant linear separation l from all the other colours
Finally, we must ensure that no two colours occupy the same named colour region. Notice that the circle in Figure 5 has been subdivided into eight named regions. We use a simple technique to
To appear in IEEE Visualization ’97, March 31, 1997, Phoenix, Arizona
The volume renderer that we are using is a modified version of Volren, a product of Silicon Graphics, Inc. (SGI) that is based on the OpenGL graphics language. The basic principle behind this renderer is to define the volumetric data as a three-dimensional texture and render it by mapping it onto a stack of “display slices” that are orthogonal to the viewing direction [2]. After the texture data is built, lookup tables are used to colourize it. The slices are then blended as they are rendered back to front (Figure 6). This technique can take advantage of the hardware-accelerated texture mapping capabilities of certain workstations, such as the SGI Indigo II High Impact that we are currently using. Our modifications to Volren include adding several resampling filters (variants of a Gaussian filter) for noise removal. Another enhancement is an increase in the number of display slices on which the texture is mapped (this includes a corresponding decrease in the distance between display slices, to ensure the size of the object does not change). This improves considerably the quality of the images, especially in areas where the user is looking through a semi-transparent object. Volren includes a number of features that are especially important to our application. It allows the user to interactively rotate and clip the volume, which is very useful for determining the geometry of an object. Not only can this provide the clinicians with the exact static view that they want, but the motion gives them important depth information as well [8]. Volren also allows the user to interactively modulate the overall opacity of the volume. We have carefully chosen the opacities of the aorta, tynes and aneurysm so that decreas-
Single Slice Slices Composited Back to Front
3D Texture Mapping
Output Image
Intensity to RGBA LUT
Figure 6: Volren Algorithm
ing the overall opacity mostly affects the visibility of the aneurysm. In this manner, we can have the aneurysm ranging from completely opaque to entirely invisible, depending on where we want to focus our analysis.
3
RESULTS
An actual clinical data set is used to demonstrate our techniques. The patient is an elderly male with a large abdominal aortic aneurysm and a bifurcation stent graft installed. The original data consists of 128 slices from a Toshiba Xpress SX helical CT scanner. The slices were reconstructed at 3mm intervals to produce the greyscale images. Other than removal of the spine behind the aorta, no manual segmentation was done in preparation for rendering. The data sets contain 128 slices of size 128 128 pixels. Volren requires, on average, about five seconds to read a data set, and about 17 seconds to display an initial rendering. After the initial rendering is produced, the data set can be manipulated interactively by the user (our machines can display approximately 10 frames per second). In order to demonstrate the effectives of both the mask segmentation technique and proper colour selection, consider a reconstructed AAA volume using four different representations. The simplest visualization (Figure 7a) displays the volume without segmentation or colour selection. Figure 7b shows the result of masking unimportant material, but continues to use greyscale intensities to visualize the resulting volume. Colour Plate 1a displays the segmented volume with a set of colours previously selected by the radiologists. Finally, Colour Plates 1b-1d display the segmented volume with a set of colours chosen using our colour selection algorithm. Greyscale images produced with no masking and no colour selection provide little or no information of interest to the viewer. Most of the important objects are occluded or hidden by materials near the outer edge of the volume. Volren allows us to change the opacities of different materials, and to apply cutting planes to try to cull out unimportant areas of the volume (Figure 7a). None of these techniques, however, will allow us to obtain a clear view of only the aneurysm, the arteries, and the tynes. The greyscale image in Figure 7b is much more effective than an unmasked rendering. Our masking technique has been used to remove material in the volume that does not correspond to the aneurysm, the artery walls, or the tynes. Whereas images with no masking are essentially unusable, the representation in Figure 7b provides a variety of information about the scanned region. Because of the initial masking step, the structure of arteries and the aneurysm is clearly displayed. Viewers can also distinguish between the aneurysm and the artery walls. The voxel intensities used in Figure 7 are directly proportional to the original pixel intensities in the unprocessed 2D images (Figure 4). As with those images, certain areas in the volume suffer from the same lack of definition in the tyne boundaries. The tyne positions are only visible outside of the aneurysm. When the aneurysm
(a)
�
To appear in IEEE Visualization ’97, March 31, 1997, Phoenix, Arizona
Renal Artery
Aneurysm
Aorta
Tynes
Iliac Arteries
(b)
Figure 7: Volume rendering in greyscale: (a) a volume displayed without segmentation, cutting planes and transparency were used to show a cross-section of the aneurysm and the aorta; (b) the same volume after applying our initial segmentation step, the structure of the aneurysm and aorta are now clearly visible
and the arteries overlap, the locations of the tynes are hidden. Decreasing the opacity of the aneurysm will eventually show the tynes, but at that point the aneurysm itself becomes so transparent that its boundaries and depth can no longer be identified. We feel Figure 7b represents a good tradeoff between the ability to see the tynes in the artery walls and the opacity of the aneurysm. Although it is possible to identify the general location of the tynes within the artery, the specific patterns they form, and the locations where different grafts mesh with one another are not readily apparent. Moreover, it is difficult to see whether there is adequate reinforcement of the blood vessels. Colour Plate 1a shows the same reconstructed CT volume as Figure 7. Our masking technique was used to ensure that only the arteries, aneurysm, and tynes were included in the 2D slices used during the reconstruction. A colourmap chosen by radiologists was applied to the resulting volume. The colourmap was obtained in a trial and error fashion to try to best represent data from individual data sets; perceptual issues were not considered when the colourmap was designed. Colouring the volume provides a dramatic improvement over the greyscale image. The structure of the scanned region is very clear, due in large part to our initial masking step. The colourmap used by the radiologists does a good job of highlighting the artery walls and the tyne locations (represented by yellow and red, respectively). However, the aneurysm itself (shown as a red cloud around the artery) is not as well defined. In particular, when the aneurysm overlaps with the artery, it disappears from view. This makes it very difficult for the radiologists to determine depth from the image, in particular, it is almost impossible to tell how far certain parts of the aneurysm extend from the wall of the artery. To obtain this measurement, the radiologists needed to rotate the volume repeatedly, in an effort to avoid looking “straight-on” at the aneurysm and the underlying arteries and tynes. Increasing the opacity of the aneurysm makes it stand out more strongly. However, this begins to obscure the location of the tynes. Colour Plate 1a was the best tradeoff we could obtain between showing clearly the artery wall and tyne locations, and increasing the opacity of the aneurysm to show fully its 3D structure. The problems encountered in Colour Plate 1a occur because the colours used for the arteries, aneurysm, and tynes are not equally distinguishable from one another. We used our colour selection technique to choose three new colours; our algorithm tries to ensure that any of the colours can be rapidly and accurately detected in the image. The radiologists asked us to avoid choosing green or greenyellow colours, since these are associated with bile in the context of coloured medical volumes. This requirement significantly reduced which parts of the colour model were available to us. In spite of this, we were able to pick three colours that had a very strong perceived difference from one another. These colours were used to produce the volume in Colour Plate 1b. The location of the tynes within the artery walls is as clear as in Colour Plate 1a. Moreover, the entire 3D structure of the aneurysm can be clearly identified. Depth information is not lost when the aneurysm and the artery wall overlap with respect to the viewing direction. Our colours make it easy for the radiologists to estimate how far the aneurysm extends from the artery wall. Using perceptual rules to select our colours provides a more effective visualization, even when compared to the colourmap previously being used by the radiologists. Colour Plate 1c uses Volren’s interactive cutting planes to slice diagonally through the volume. The slice allows us to measure the cross-sectional area of the aneurysm and the two iliac arteries. It also shows how the tynes are positioned just inside the wall of the artery. This image also helps to demonstrate the advantages of volume rendering when compared to other techniques like 2D slices or surface representations. 2D slices are taken at a fixed orientation through the volume. This makes it impossible to look at cuts through the volume from a different viewing direction. Sur-
To appear in IEEE Visualization ’97, March 31, 1997, Phoenix, Arizona
face models support arbitrary viewing directions, but they lose information about the density of material within the volume. Information about the thickness and density of the aneurysm would not be available in a surface rendering. This is especially important in cases where leakage from the stent into the aneurysm occurs, because changes in the density of the aneurysm would be symptomatic of this condition. Colour Plate 1d uses a viewing direction that is orthogonal (or “straight-on”) to one of the iliac arteries. This viewing direction shows the zigzag pattern the tynes make when they are embedded within the artery. Our masking technique is capable of extracting this level of detail in each 2D slice, even in these smaller blood vessels. Applying an effective colourmap allows effortless detection of the locations, patterns, and interactions between different materials in the volume. Note that we can view the pattern of the tynes much more clearly on the artery that is perpendicular to the viewing direction, in contrast to the artery that is heading away from the viewer. This shows how the ability to change viewing angles can be important in volume visualization. The interactive rotation feature in Volren is extremely useful in such cases. Colour Plate 1d also shows increased opacity in the aneurysm, also interactively adjustable, as compared to the other images in Colour Plates 1a-1c. The radiologists have now started to use our results to view their CT scans. The figures in Colour Plate 1 represent a post-operative scan of a patient who underwent the endovascular stenting procedure. Our visualizations allow the radiologists to identify important details in the volume. For example, when the radiologists looked at the volume in Colour Plate 1b, they immediately noticed an area in the artery that was not supported by the grafts (the two large yellow areas inside the aneurysm in Colour Plate 1b that have no red, and hence no tynes supporting them). This occurred because one of the grafts in the iliac artery was not pushed up far enough to mesh with its upstream partner. Although this poses little risk to the patient, it is very useful for the radiologists to be able to examine the results of their surgical procedures in this manner. Other visualization techniques (e.g., surface meshes or 2D slices) would have made it more difficult for the radiologists to identify and estimate the size of this region of low support. In the future, we hope to use our volume rendering technique to allow the radiologists to help in planning the surgical procedure.
4 CONCLUSIONS In this paper we have presented ongoing work in the use of volume rendering in the pre and post-operative analysis of abdominal aortic aneurysms. Each CT data set passes through two stages during visualization: a segmentation stage to isolate the regions of interest (the aneurysm, the arteries, and the tynes), and a colourization stage to highlight each region. We investigated a number of common segmentation techniques (e.g., interactive clipping planes and region growing) when we tried to identify the aneurysm, the arteries, and the tynes in each 2D slice. Unfortunately, none of these gave completely satisfactory results. To overcome this, we developed a new segmentation technique that empirically combines low and high-order intensity images to classify accurately objects of interest in a set of 2D CT slices. Our technique effectively identifies the locations of and boundaries between the three regions of interest. This is crucial to reconstructing an accurate 3D volume. We also discussed a perceptual method for selecting groups of highly distinguishable colours. Our technique uses three separate criteria to build groups of colours which can be rapidly and accurately identified from one another. Colours obtained using this technique improved the effectiveness of our visualizations when compared to both greyscale images and colourmaps chosen in a more aesthetic fashion. Finally, we showed how our rendering techniques
can be used to display and analyze real clinical data in a number of important and useful ways.
5
FUTURE WORK
There are a number of areas that we hope to improve upon in order to produce even more accurate images in a shorter period of time. Anti-aliasing measures to reduce staircasing at blood vessel and air boundaries is topmost on the list, because most radiologists consider this to be an important issue. Experiments aimed at smoothing the boundaries by interpolation methods have had some initial success. Another area we plan to address is the segmentation procedure. Since the shape of aneurysm tissue is well-defined in the 2D slices, some form of automatic segmentation seems to be a realistic shortterm goal. As mentioned previously, region-growing methods have strong potential here. All of our classifications are currently determined by empirically selecting tissue boundary values, because fairly simple automatic techniques such as histogram-based classification [6] do not work well for our data. Even though we can generate transfer functions fairly quickly with our current methods, it would be desirable to have a way of automatically modifying these functions to account for changes in the scanning parameters (e.g., the intravenous contrast material being used). The use of stereoscopic displays is another area for further exploration. Preliminary tests have suggested that clinicians would find stereo useful for establishing depth cues without rotating the volume and thereby altering the viewpoint. Combining stereo displays with a built-in measurement tool would be helpful for volumetric analysis.
References [1] Kevin M. Baskin, Catherine A. Kusnick, Sussane Shamsolkottabi, Elvira V. Lang, John D. Corson, William Stanford, Brad H. Thompson, and Eric A. Hoffman. Volumetric analysis of abdominal aortic aneurysms. In Proceedingsof the SPIE Conference on Medical Imaging 1996: Physiology and Function from Multidimensional Images, pages 323–337, 1996. [2] Brian Cabral, Nancy Cam, and Jim Foran. Accelerated volume rendering and tomographic reconstruction using texture mapping hardware. In Proceedings 1994 ACM/IEEE Symposium on Volume Visualization, pages 91–97 (IEEE CS Press Order No. PR07067, 1995), 1994. [3] T. C. Callaghan. Dimensional interaction of hue and brightness in preattentive field segregation. Perception & Psychophysics, 36(1):25–34, 1984. [4] R. A. Drebin, L. Carpenter, and P. Hanrahan. Volume rendering. Computer Graphics, 22(4):65–74, 1988. [5] Elliot K. Fishman, Robert A. Drebin, Ralph H. Hruban, Derek R. Ney, and Donna Magid. Three-dimensional reconstruction of the human body. American Journal of Radiology, 150:1419–1420, 1988. [6] Elliot K. Fishman, Brian S. Kuszyk, David G. Heath, and Luomin Gao. Surgical planning for liver reconstruction. IEEE Computer, 29(1):64–72, 1996. [7] Christopher G. Healey. Choosing effective colours for data visualization. In Visualization ’96, pages 263–270, San Francisco, California, 1996.
To appear in IEEE Visualization ’97, March 31, 1997, Phoenix, Arizona
[8] Derek R. Ney, Elliot K. Fishman, and Donna Magid. Volume rendering of computed tomography data: Principles and techniques. IEEE Computer Graphics & Applications, 10(2):24– 32, 1990. [9] Stephen M. Pizer, Marc Levoy, Henry Fuchs, and Julian G. Rosenman. Volume rendering for display of multiple organs, treatment objects, and image intensities. In Proceedings of the SPIE Conference on Science and Engineering of Medical Images, volume 1137, pages 92–97, 1989. [10] Bernice E. Rogowitz and Lloyd A. Treinish. An architecture for rule-based visualization. In Proceedings Visualization ’93, pages 236–243, San Jose, California, 1993. [11] C. Ware. Color sequences for univariate maps: Theory, experiments, and principles. IEEE Computer Graphics & Applications, 8(5):41–49, 1988. [12] Jeremy M. Wolfe, Stacia R. Friedman-Hill, Marion I. Stewart, and Kathleen M. O’Connell. The role of categorization in visual search for orientation. Journal of Experimental Psychology: Human Perception & Performance, 18(1):34–49, 1992. [13] Jeremy M. Wolfe, Karen P. Yu, Marian I. Stewart, Amy D. Shorter, Stacia R. Friedman-Hill, and Kyle R. Cave. Limitations on the parallel guidance of visual search: Color color and orientation orientation conjunctions. Journal of Experimental Psychology: Human Perception & Performance, 16(4):879–892, 1990.
�
�
(a)
(c)
(b)
(d)
Colour Plate 1. An abdominal aortic aneurysm visualized with different colourmaps and viewing directions: (a) the original colourmap previously being used by the radiologists; (b) the same aneurysm and viewing direction, but using our perceptual colourmap; (c) a cut through the volume created with Volren’s interactive clip planes, showing the cross-sectional area of the aneurysm and the two iliac arteries, and the tyne locations; (d) an orthogonal viewing direction, showing clearly the location of the tynes in the vertical iliac artery
To appear in IEEE Visualization ’97, March 31, 1997, Phoenix, Arizona