Volume 29, Issue 3
Impact of foreign direct investment volatility on economic growth of asean-5 countries
Chee-keong Choong Ph.D Department of Economics, Faculty of Business and Finance, Universiti Tunku Abdul Rahman
Venus khim-sen Liew Ph.D Department of Economics, Faculty of Economics and Business, Universiti Malaysia Sarawak,
Abstract
This study examines the impact of volatility of FDI, rather than its level on the economic growth of ASEAN-5 countries. Using bounds testing approach, we show that FDI volatility retards long-run economic growth in Indonesia, Malaysia, the Philippines and Thailand. Our results suggest that the economic growth of Indonesia is the most susceptible to the adverse effect of FDI volatility. These findings, which are robust to different measures of FDI volatility, are of concern in dealing with the economic growth of developing countries in the ASEAN region, which rely heavily on FDI.
Citation: Chee-keong Choong Ph.D and Venus khim-sen Liew Ph.D, (2009) ''Impact of foreign direct investment volatility on economic growth of asean-5 countries '', Economics Bulletin, Vol. 29 no.3 pp. 1829-1841. Submitted: Mar 11 2009. Published: July 29, 2009.
1. Introduction There exists a vast empirical literature on the impacts of foreign investment (FDI) on economic growth of developing countries. Among them, a great number of studies have reported a positive relationship between FDI and economic growth rates, although others have shown that FDI and economic growth are not related to each other. In general, those studies that provide positive evidence found that FDI tends to have significant effect on economic growth by stimulating capital accumulation, enhancing and enabling more efficient use of existing resources such as human capital (knowledge and skill), or/and through positive externalities such as technology transfer and spillover. De Mello (1997) and Ozturk (2007), for instance, provide a comprehensive review on the nexus on FDI and economic growth. Whilst much has been done on the level of FDI and economic growth, the issue volatility of FDI and its impact on economic growth is less researched. It should be noted that not only the level of FDI, but also its volatility can have significant effect on the economic growth of a country. The mechanism underlying the link among FDI, its volatility and economic growth can be illustrated as follows: Higher level of investment leads to higher levels of output and thereby greater profit, ceteris paribus. Greater profit improves creditworthiness and intensifies borrowing that in turn results in higher investment, and subsequently FDI flows into the economy to finance this demand or boom. At the same time, an increase in investment level raises the demand for the country-specific factor as well as increases the aggregate price relative to the aggregate output. Increases in input prices, on the other hand, reduces profits and hence, trims down creditworthiness and investment, which will eventually transmit into a fall in aggregate output. Thus, endogenous volatility causes adverse shock to have permanent and persistent negative impacts on economic growth. Volatility of FDI in recipient countries may be harmful to economic growth since it causes FDI to be less effective because foreign investors, when confronted with risks, may postpone or even withdraw the investments. As a result, the sudden fluctuations in the FDI flows may have a destabilizing effect on the economic performance (Lensink and Morrissey, 2006). Besides, FDI volatility may reflect political and economic instability in a country. A high level of instability or uncertainty may be a potential disincentive to FDI, which may further discourage higher level of domestic investments and economic performance (Lensink and Morrissey, 2000; Guillaumont and Chauvet, 2001). Subsequently, FDI volatility is expected to have a negative impact on economic growth. See Lensink and Morrissey (2002, 2006) who present an interesting and provocative view on the nexus between FDI volatility and economic growth. Empirically, Guillaumont and Chauvet (2001) find that volatility of FDI is robustly and negatively correlated with growth. In addition, Lensink and Morrissey (2002, 2006) report that the different measures of FDI volatility have a significantly negative impact on economic growth.
1
The objective of this study is to contribute to the literature by providing empirical evidence pertaining to the impact of FDI volatility on economic growth from the ASEAN-5 countries1. The organization of this paper is structured as follows. Section 2 describes the data and variables of study, whereas Section 3 explains the empirical testing procedures employed in this study. Section 4 presents and discusses the results. Concluding remarks and policy implications are mentioned in the final section. 2. Data and Variables of Study The data employed in this study is collected from the International Financial Statistics, compiled by International Monetary Fund. Annually data covering the period ranging from 1974 to 2005 are utilized to examine the relationship between FDI volatility and economic growth in ASEAN-5 countries. In this study, real GDP growth rate (RGDPGR) is used to represent the economic growth variable. The FDI variable is surrogated by gross FDI measured as a percentage of GDP (FDIGDP). Using this variable, we construct two different measures of FDI volatility as indications of macroeconomic uncertainty. The first volatility measure (FDISD) is obtained by first regressing FDIGDP on its one-year lagged value, together with an intercept and linear time (Trend) terms (see, Lensink and Morrissey, 2002, 2006): FDIGDPt
1FDIGDPt 1
0
2Trend
ut
(1)
,
where ut is an error term with standard properties, and then calculating the standard deviation of ut . The second measure (FDIEGARCH) is generated by using exponential generalized autoregressive conditional heteroskedasticity (EGARCH). The model is specified as the following equations: FDIGDPt
where
FDIGDPt
1
t
t 1
(2)
,
has a mean of zero and a conditional variance of log
2 t
t 1 t 1
t 1
2 t 1
log
D97
, and (3)
t 1
Equations (2) and (3) are the conditional mean and variance of the logarithmic of gross FDI (FDIGDP), respectively. With the log transformation in the The five original founders of the Association of South-East Nations (ASEAN) are namely Indonesia, Malaysia, the Philippines, Singapore and Thailand. These countries are more commonly referred as ASEAN-5. 1
2
variance equation (3) ruled out negative variance. No restriction hence is needed on the variance equation to ensure a positive volatility process as in the conventional GARCH model. In the conditional mean equation (2), is the intercept term; and represents the magnitudes of the autoregressive and the moving average terms, respectively; and t is the idiosyncratic news. In the conditional variance equation (3), t2 1 represents the lagged conditional variance of t while , and are the parameters of ARCH, GARCH and 2 leverage parameters respectively . D97 is the dummy variable added to eliminate the effect of the 1997/1998 Asian Financial Crisis. It takes the value of 1 for 1997 and 1998, and zero for other years. 3. Empirical Testing Procedures This study examines the long-run relationship between FDI volatility and economic growth in a bivariate model based on the autoregressive distributed lag (ARDL) model proposed by Pesaran and Shin (1999) and Pesaran et al. (2001). The ARDL procedure has increasingly popular for few reasons. First, the technique is more appropriate to be used in testing the long run relationship between variables when the data are of a small sample size (Pesaran et al., 2001) like ours. Second, there is no restriction imposed on the order of integration of each variable under study. To be specific, the test allows testing for the existence of a cointegrating (implying long run) relationship between variables in levels irrespective of whether the underlying variables are I(0) or I(1). This is different from the general bivariate and multivariate cointegration frameworks, which require that time series in the system should be nonstationary in their levels and that all time series in the cointegrating equation should have the same order of integration. The bivariate model is expressed as follows: p
RGDPGRt
0
1 RGDPGRt
2 FDIVOL t
1
1
3
RGDPGRt
i
i 1
p 4
FDIVOLt
i
t
(4)
i 0
where is first-difference operator (i.e., , t is the Gausian error term, FDIVOL represents two different measures of FDI volatility (FDISD and FDIEGARCH), which expressed in the natural logarithm and RGDPGR is in the levels as some values are negative. p is lag structure, which is determined by Akaike’s information criterion and the basis of no serial correlation in the error term. ARCH model assumes that while the variance of the error term follows an autoregressive process, the error term itself is not autoregressive (Engle, 1982). Moreover, Engle et al. (1990) point out that “innovations should not be serially correlated in ARCH models” (p. 528), since that would violate the assumption of conditional mean zero. 2
3
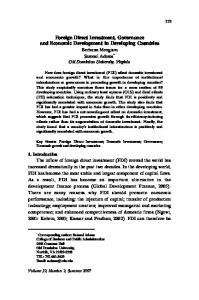
We examine the long run relationship by imposing the restriction that all estimated coefficients of lagged-one level variables equal to zero. That is, the null hypothesis is 1 0 (meaning, no long run relationship) is tested 2 against the alternative hypothesis of 1 0 or/and 2 0 (implying the existence of long run relationship). The decision rule is based on the F test of restriction. If the F-statistic obtained from the restriction is to be compared with the lower and upper bounds of the critical values. If it is smaller than the lower bound critical value, we do not reject the null hypothesis of no long run relationship. In contrast, if the computed F-statistic is greater than upper bound critical value, then we reject the null hypothesis and conclude that there appears steady state long run equilibrium between the variables under study. However, if the F-statistic falls within lower and upper bound critical values, then the results are inconclusive and the stationarity of the series must be examined and investigated for confirmation. The critical values are simulated and available in Pesaran et al. (2001). However, it should be noted that according to Narayan (2005), the use of Pesaran et al.’s (2001) critical values for small sample study may produce misleading results because the critical values are simulated on the basis of large sample sizes of 500 and 1000 observations with 2000 and 40000 replications respectively. Narayan (2005) has generated a new set of critical values ranging from 30 to 80 observations for more practical usage. Since the sample size for the ASEAN-5 countries considered in our study is small (that is, ranges from 27 to 32 observations), we rely on the critical values provided by Narayan (2005) for decision matters. 4. Empirical Results We start our analysis by showing the co-movement between economic growth and FDI volatility over time graphically. Figure 1 exhibits the movement of real GDP growth rate (RGDPGR) versus FDI volatility, according to Equation (1)3. Notice, in the first place, that in ASEAN economies both real GDP growth rate and FDI volatility have been subject to the great fluctuations, especially during the East Asian financial crisis period. On the other hand, real GDP growth rate and FDI volatility seem to move in the opposite directions; a worsening of the FDI volatility normally follows the downturn of the economic growth. Again, the association seems to be strong in the long run, but not necessarily so in each particular year.
FDI volatility is in natural logarithms and the real GDP growth rate is in levels since the real GDP growth rate is sometimes negative. 3
4
Figure 1: Real GDP Growth Rate (RGDPGR) and FDI Volatility (FDISD) Indonesia 0.25
0.006
0.2
0.005
0.15
0.004
0.1 0.003
0.05
IFDIVOL
0.002 2005
2003
2001
1999
1997
1995
1993
1991
1989
1987
1985
1983
1981
1979
1977
0 -0.05
IRGDPGR
-0.1
0.001 0
Year
Malaysia 0.25
0.008
0.2
0.007 0.006
0.15
0.005
0.1
0.004 0.05
FDIVOL
0.003 0.002
2004
2002
2000
1998
1996
1994
1992
1990
1988
1986
1984
1982
1980
1978
1976
0 -0.05
MRGDPGR
0.001
-0.1
0
The Philippines 0.1
0.7 0.6
0.05
0.5
2005
2003
2001
1999
1997
1995
1993
1991
1989
1987
1985
1983
1981
-0.05
1979
0
0.4
PLRGDPGR
0.3
PFDIVOL
0.2 -0.1
0.1
-0.15
0
Singapore 0.3 0.25 0.2 0.15 SRGDPGR
0.1
SFDIVOL
0.05
2004
2002
2000
1998
1996
1994
1992
1990
1988
1986
1984
1982
1980
1978
1976
1974
0 -0.05 -0.1
Thailand 0.2
0.35
0.15
0.3
0.1
0.25
0.05
0.2
TRGDPGR
0.15
TFDIVOL
-0.1
2005
2003
2001
1999
1997
1995
1993
1991
1989
1987
1985
1983
1981
1979
-0.05
1977
0
0.1 0.05
-0.15
0
Source: International Financial Statistics CD-ROM, International Monetary Fund (IMF).
5
Formal examination of the relationship between FDI volatility and economic growth are performed by estimating ARDL model as specified in Equation (4). The results obtained using FDISD and FDIGARCH as measures of FDI volatility are summarized in columns 2 and 3 of Table 1 respectively. Column 2 of Table 1 shows that the estimated f-statistic for Indonesia is 10.53, which is higher than the 1% upper critical bound value is 9.29, according to Narayan (2005). Thus, the null hypothesis of no long run relationship between RGDPGR and FDISD may be rejected in favor of the alternative hypothesis of the existence of long run relationship between the two variables, at 1% significant level. Based on the same principle, it is evident from column 2 of Table 1 that RGDPSR is significantly related to FDISD in the long run for Malaysia (1% level), the Philippines (1%) and Thailand (5%). As for the case of Singapore, the estimated F-statistic is only 2.80 and this value is less than the lower critical bounds of any significance level given by Narayan (2005). As such, there is there is evidence of long run relationship between RGDPGR and FDISD for Singapore. On the whole, these findings tend to suggest that economic growth is related to FDI volatility as measured by FDISD for all countries under study, with the exception of Singapore. Note that this conclusion is consistently supported by the alternative measure FDI volatility, namely FDIGARCH (column 3, Table 1). Our finding is in line with Lensink and Morrissey (2006) who report that volatility of FDI is robustly and negatively correlated with economic performance for a panel of 20 developed and 67 developing countries. Table 1. F-statistic of the ARDL Bound testa Countryb Indonesia (1977-2005) Malaysia (1976-2005) Philippines (1979-2005) Singapore (1974-2005) Thailand (1977-2005) Notes:
Independent Variable FDISD FDIEGARCH 10.53*** 29.09*** 10.88*** 14.29*** 14.33*** 16.33*** 2.80 2.70 7.88** 25.32***
a Dependent
variable: RGDPGR. The starting point of the sample period varies depending on the availability of data. The 1, 5 and 10% critical bounds for the F-statistic given by Narayan (2005) are [8.17, 9.29], [5.40, 6.35] and [4.29, 5.08] respectively. ***, ** and * indicate significance at 1, 5 and 10% levels respectively. b
Having shown that economic growth and FDI volatility are related in the long run for majority of the ASEAN-5 countries, this study proceeds to measure the impact of FDI volatility on economic growth for these countries. For this purpose, the long-run coefficient of FDI volatility is derived from Equation (4). In particular, the long run coefficient is given by the negative of of the estimated ARDL model. The estimated results for FDI volatility as measured by FDISD is reported in Table 2. Table 2 shows that the estimated long run coefficient of FDISD is negative in all ASEAN countries and ranges from -0.41 6
(the Philippines) to -18.78 (Indonesia). This indicates that FDI volatility as measured by FDISD has negative impact on economic growth of ASEAN-5 countries. We can infer that a higher (lower) FDI volatility is accompanied with a lower (higher) rate of economic growth for these countries. The coefficient is statistically significant for all countries except Singapore. As the long run estimate is indeed the long run elasticity, it can be said that a 1% increase (decrease) in FDI volatility will be associated with 18.78%, 11.61%, 2.04%, 1.05% and 0.41% rise (fall) in economic growth for Indonesia, Malaysia, Singapore (not significant), Thailand and the Philippines, in that order. In other words, FDI volatility has the largest significant impact on the economic growth of Indonesia, followed by Malaysia and Thailand, whereas the Philippines’ economic growth is the least vulnerable to FDI volatility. Table 2: Long run Estimated Coefficient of FDISD Variable Indonesia Malaysia FDISD -18.78* -11.61* (-1.78) (-1.88) Intercept 0.10*** 0.11*** (3.86) (3.68) Diagnostic Checking 0.4439 0.4870 NORM 4.9434 5.5235 [0.0844] [0.0632] AR (1) 0.4739 0.8120 [0.6294] [0.4558] ARCH (1) 0.4434 1.1121 [0.5119] [0.3013] RESET 2.4192 0.1034 [0.1146] [0.7505]
Philippines -0.41*** (-3.28) 0.15*** (4.01)
Singapore -2.04 (-1.19) 0.11** (2.16)
Thailand -1.05** (-2.55) 0.19*** (3.05)
0.6355 1.0769 [0.5837] 0.1323 [0.8774] 0.0308 [0.8625] 0.6873 [0.4233]
0.3709 0.2986 [0.8613] 0.1684 [0.8464] 0.3105 [0.5824] 0.3449 [0.5643]
0.4676 2.1618 [0.3393] 0.3971 [0.6887] 0.4352 [0.5195] 2.3770 [0.1670]
Notes: Independent variable: RGDPGR. is adjusted coefficient of determination. AR (1) is first order LM test for residual serial correlation. ARCH (1) is first order LM test for autoregressive conditional heteroscedasticity. RESET is the Ramsey's RESET test for misspecification. NORM is a Jarque-Bera test for residual normality. t-statistics are provided in parentheses and marginal probability values are shown in brackets. The asterisks *, ** and *** indicate the rejection of null hypothesis at the 10, 5 and 1% levels of significance, respectively.
The above-observed inverse relationship between FDI volatility and economic growth is further supported by the use of alternative FDI volatility measure generated by EGARCH procedures, namely FDIEGARCH, as shown in Table 3. Overall, this study provides evidence of negative impact of FDI volatility on economic growth for ASEAN-5 countries, irrespective of the measures of FDI volatility, based on time-series analysis. This finding is consistent with Lensink and Morrissey (2002, 2006) who report that the different measures of FDI volatility have a significantly negative impact on economic growth, based on cross-country analysis.
7
Table 3: Long run Estimated Coefficient of FDIGARCH Variable FDIEGARCH
Indonesia -12.98*** (-3.42) Intercept 0.09*** (6.87) Diagnostic Checking 0.8370 NORM 0.8834 [0.6430] AR (1) 0.2901 [0.5975] ARCH (1) 2.4003 [0.1176] RESET 0.1870 [0.6712]
Malaysia -11.75** (-2.27) 0.08*** (5.29)
Philippines -0.38*** (-3.10) 0.13*** (4.07)
Singapore -2.14 (-0.97) 0.10* (1.84)
Thailand -0.40*** (-4.26) 0.12*** (5.41)
0.7852 0.6038 [0.7394] 3.3871 [0.1378] 0.0251 [0.9753] 0.1695 [0.6976]
0.6425 2.3510 [0.3087] 0.8996 [0.4347] 0.0101 [0.9209] 0.7233 [0.4117]
0.4409 0.8148 [0.6654] 0.0946 [0.9103] 0.1230 [0.7288] 1.3654 [0.2578]
0.8564 0.7654 [0.6820] 0.2780 [0.8017] 0.0799 [0.7813] 3.0121 [0.3773]
Notes: Independent variable: RGDPGR. is adjusted coefficient of determination. AR (1) is first order LM test for residual serial correlation. ARCH (1) is first order LM test for autoregressive conditional heteroscedasticity. RESET is the Ramsey's RESET test for misspecification. NORM is a Jarque-Bera test for residual normality. t-statistics are provided in parentheses and marginal probability values are shown in brackets. The asterisks *, ** and *** indicate the rejection of null hypothesis at the 10, 5 and 1% levels of significance, respectively.
It is worth mentioning that the estimated ARDL models had passed a battery of diagnostic tests. In sum, there is no evidence of heteroscedasticity, serial correlation and misspecification of functional form by the ARCH, AR and RESET tests respectively. The Jarque-Bera test results also indicate no sign of non-normality of error term. We also conducted the stability tests proposed by Pesaran and Pesaran (1997) by the plots of CUSUM and CUSUMSQ statistics. If the values of estimated elasticity at various points of time are within the 5% critical bounds, then the estimated elasticities are stable over time and the implied ARDL model is valid for interpretation. Otherwise, the model should be re-estimated. The resulted CUSUM and CUSUMSQ statistics are plotted in Figures 2 and 3 respectively for ASEAN-5 countries. These figures indicate the absence of instability in the estimated coefficients as the statistics are confined within the 5% critical bounds of parameter stability. This signifies that the structure of the parameters have not diverged abnormally over the period of the analysis in these countries. All-in-all, it can be said that the estimated ARDL models are valid and the above-mentioned findings are robust and reliable for policy implications.
8
Figure 2: Plots of CUSUM Statistics for ASEAN-5 Countries Indonesia 10.0 7.5 5.0 2.5 0.0 -2.5 -5.0 -7.5 -10.0 96
97
98
99
00
01
CUS UM
02
03
04
05
5% S ignific anc e
Malaysia 8 6 4 2 0 -2 -4 -6 -8 2001
2002
2003 CUS UM
2004
2005
5% S ignific anc e
The Philippines 10.0 7.5 5.0 2.5 0.0 -2.5 -5.0 -7.5 -10.0 1997
1998
1999
2000
2001
CUS UM
2002
2003
2004
2005
5% S ignific anc e
Singapore 8 6 4 2 0 -2 -4 -6 -8 2001
2002
2003 CUS UM
2004
2005
5% S ignific anc e
Thailand 10.0 7.5 5.0 2.5 0.0 -2.5 -5.0 -7.5 -10.0 1997
1998
1999
2000
2001
CUS UM
2002
2003
5% S ignific anc e
9
2004
2005
Figure 3: Plots of CUSUMSQ Statistics for ASEAN-5 Countries Indonesia 1.6
1.2
0.8
0.4
0.0
-0.4 96
97
98
99
00
01
02
CUS UM of S quares
03
04
05
5% S ignific anc e
Malaysia 1.6
1.2
0.8
0.4
0.0
-0.4 2001
2002
2003
2004
CUS UM of S quares
2005
5% S ignific anc e
The Philippines 1.6
1.2
0.8
0.4
0.0
-0.4 1997
1998
1999
2000
2001
2002
CUSUM of Squares
2003
2004
2005
5% S ignific anc e
Singapore 1.6
1.2
0.8
0.4
0.0
-0.4 2001
2002
2003
CUSUM of Squares
2004
2005
5% S ignific anc e
Thailand 1.6
1.2
0.8
0.4
0.0
-0.4 1997
1998
1999
2000
2001
CUSUM of Squares
10
2002
2003
2004
5% Signific anc e
2005
5. Conclusions and Policy Implications The aim of the study is to analyze the long run relationships between FDI volatility and economic growth in ASEAN-5 countries. Using autoregressive distributed lag (ARDL) model, the study finds that FDI volatility and economic growth are cointegrated implying the existence of long run relationship between these two variables for the majority of the ASEAN-5 countries (except Singapore). Furthermore, higher (lower) FDI volatility is associated with lower (higher) economic growth. These findings are robust to different measures of FDI volatility. It is also found that FDI volatility has various degree of negative impact on the economic growth, with the largest (least) adverse impact goes to Indonesia (the Philippines). The findings of significant adverse impact of FDI volatility on economic growth in the majority of ASEAN-5 countries is of general concern in dealing with maintaining the economic growth of developing countries in the ASEAN region. The intuition of this study is that most ASEAN countries generally have less effective domestic stabilizers, which can efficiently absorb part of the FDI volatility. As a result, macroeconomic uncertainty is greater and FDI volatility is counter-cyclical with long-run growth. Therefore, FDI volatility tends to exacerbate macroeconomic uncertainty, having larger adverse effects on growth in these countries. It is therefore important for policy-makers of these countries to find effective ways to alleviate volatility in FDI. In doing so, understanding the underlying driving forces of FDI volatility will be certainly helpful. Therefore, future research may be conducted to identify the determinants of FDI volatility in this ASEAN region. References De Mello, L. (1997) “Foreign Direct Investment in Developing Countries and Growth: A Selective Survey”, Journal of Development Studies 34, 1-34. Engle, R. (1982) “Autoregressive Conditional Heteroskedasticity with Estimates of The Variance Of U.K. Inflation”, Econometrica 50, 987-1008. Engle, R., Ito, T. and Lin, W.L. (1990) “Meteor Showers or Heat Waves? Heteroskedastic Intra-Daily Volatility in The Foreign Exchange Market”, Econometrica 58, 525-542. Guillaumont, P. and Chauvet, L. (2001) “Aid and Performance: A Reassessment”, Journal of Development Studies 37, 66-92. Lensink, R. and Morrissey, O. (2000) “Aid Instability as A Measure of Uncertainty and the Positive Impact of Aid on Growth”, Journal of Development Studies 36, 31-49.
11
Lensink, R. and Morrissey, O. (2002) “The Volatility of FDI, Not the Level, Affect Growth in Developing Countries”, The CDS Research Report Series, University of Groningen, 1-35. Lensink, R. and Morrissey, O. (2006) “Foreign Direct Investment: Flows, Volatility, and the Impact on Growth”, Review of International Economics 14, 478-493. Narayan, P.K. (2005) “The Saving and Investment Nexus for China: Evidence from Cointegration Tests”, Applied Economics 37, 1979-90. Ozturk, I. (2007) “Foreign direct investment - growth nexus: a review of the recent literature”, International Journal of Applied Econometrics and Quantitative Studies 4(2), 79 – 98. Pesaran, M.H. and Pesaran, B. (1997) Working with Microfit 4.0: Interactive Econometric Analysis. Oxford: Oxford University Press. Pesaran, M.H. and Shin, Y. (1999) “An Autoregressive Distributed Lag Modeling Approach to Cointgeration Analysis”, in S. Strom (Ed.), Econometrics and Economic Theory in the 20th Century: The Ragnar Frisch Centennial Symposium. Cambridge University Press, Cambridge. Pesaran, M.H., Shin, Y. and Smith, R. (2001) “Bounds Testing Approaches to the Analysis of Level Relationships”, Journal of Applied Econometrics 16, 289-326.
12