Chapter e20
Visual Computing for ENT Surgery Planning 20.1
INTRODUCTION
In this chapter, we will explain how general strategies for computer-assisted surgery are adapted, implemented, and employed to meet the needs of ENT surgery (ear, nose, throat).This special surgical discipline is characterized by a high level of technical support. The very first computer-assisted surgical assistance systems were developed in this area [Klimek et al., 1993]. Also, advanced early surgical simulators were realized for ENT surgery [Edmond et al., 1997, Weghorst et al., 1998]. The high density of crucial anatomical structures in the ear, nose, and throat makes surgery highly demanding. Accuracy is often essential, e.g., in implanting hearing aids, and esthetic considerations are often relevant. On the other hand, anatomical structures are relatively fixed and do not exhibit large displacements of tissue in surgery. This makes ENT surgery an ideal goal for computer-assistance. In ENT surgery, computer-assistance was focused for a long time on intraoperative navigation [Koele et al., 2002]. In this chapter, we focus instead on 3D visualizations used for surgical planning and interdisciplinary treatment discussions in ENT surgery. First attempts were made in the 1990s [Moharir et al., 1998], but only recently systems were developed that go beyond the prototype stage.
Organization We start with virtual endoscopy solutions for planning and training functional endoscopic sinus surgery (§ 20.2). This intervention is performed in the nasal region if patients suffer from sinusitis. Although this type of surgery is often a rather simple procedure that does not require advanced planning, it becomes risky in case of extended sinusitis when surgery needs to be performed close to the skull base or close to the optical nerve. In § 20.3, we discuss surgery in the filigrane ear region where implants and hearing aids are inserted in order to improve hearing. Implant selection and placement are essential aspects of this kind of surgery. The largest part of the chapter is devoted to the removal of tumors in the neck region, e.g., neck dissections where surgeons are interested in a detailed inspection of the spatial relations around primary tumors and metastases. We introduce neck dissection in § 20.4 and go on with discussing image analysis and interactive visualization for neck surgery planning (§ 20.5 and 20.6). The computer support in all three areas is primarily based on high resolution CT data. In addition, color images and palpatory findings from fiber endoscopy are employed. Although we discuss specific problems and possible solutions, the reader is encouraged to think about transferring these experiences to other surgical disciplines.Virtual endoscopy of the sinus region is representative for intervention support in other anatomical regions. Likewise, neck surgery planning has many similarities in both requirements and viable solutions with other kinds of tumor surgery.
Visual Computing for Medicine, Second Edition. http://dx.doi.org/10.1016/B978-0-12-415873-3.00020-1 © 2014 Elsevier Inc. All rights reserved.
e61
e62
20.2
C H A P T E R e 20 . V I S U A L C O M P U T I N G F O R E N T S U R G E R Y P L A N N I N G
PLANNING AND TRAINING ENDOSCOPIC SINUS SURGERY
20.2.1 M E D I C A L B A C K G R O U N D
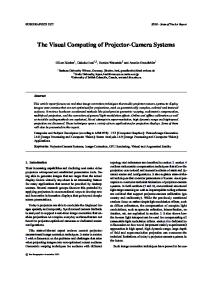
Sinus surgery is applied if patients suffer from chronic sinusitis—mucosal swellings that hamper ventilation. Figure e20.1 illustrates the target anatomy. Mucosal swellings may occur in all four paranasal sinuses, in severe cases even simultaneously. This state is called pansinusitis and obviously requires a comprehensive surgery. Since the 1980s, surgery is performed via an endoscope and with special instruments suitable for the small space. This procedure is called functional endoscopic sinus surgery (FESS) [Lloyd, 1989]. The ethmoid air cells and the sinus ostia are opened to restore the ventilation. This minimally-invasive approach does not only lead to faster recovery but is also clearly preferred over open surgery from an esthetical point of view. Minimally-invasive procedures, however, are challenging for the surgeon, since the direct visual access to the situs is missing. Instead, the situs is displayed at an endoscopic monitor. The surgeon uses a couple of anatomical landmarks, such as the middle turbinate and the uncinate process, for orientation. These landmarks, however, are missing when the disease comes back and relapse surgery is required. In these cases, the orientation is particularly difficult. In case of younger patients (12–14 years), the question arises whether the meatus (the airways) are large enough to move the endoscope through. If mucosal swellings close to the orbita, the optical nerve, or the skull base need to be removed, the operation is risky and intraoperative navigation support is desirable (§ 18.5). The most challenging situation occurs in case of malignant tumors where complete removal is essential (in case of benign mucosal swellings, a small remaining portion is acceptable if a severe risk to other structures can thus be avoided). Preoperatively, a virtual endoscopy through the sinus may help to make the surgeon familiar with the patient’s individual anatomy and to preview the actual surgery. Thus, virtual endoscopy may be part of the planning procedure but can also be considered as a training tool. The value of virtual endoscopy is determined by the amount of realism and by the insights it provides, e.g., the ability to see hidden structures along with obscuring structures. Color, texture, and wetness effects are essential ingredients of visual realism. For training purposes, where residents train the use of the endoscope and learn instrumenttissue interactions, realistic haptic feedback is essential as well [Pössneck et al., 2005].
Relevant anatomical structure of the sinuses (frontal and lateral view). Red: Sinus maxillaris, Yellow: Sinus sphenoidalis, Blue: Sinus frontalis, Green: Sinus ethmoidalis (From: [Krüger et al., 2008]).
FIGURE e20.1
20.2
PLANNING AND TRAINING ENDOSCOPIC SINUS SURGERY
e63
20.2.2 V I R T U A L E N D O S C O P Y F O R S I N U S S U R G E R Y
Virtual endoscopy (recall Chap. 13) requires CT data with high spatial resolution. Similar to other application areas, virtual endoscopy in the nasal cavity became viable with the advent of spiral and multislice CT data [Han et al., 2000].The first virtual endoscopy system for the sinus anatomy was presented by DeNicola et al. [1997] using the ADVANTAGE NAVIGATOR from GE Medical Systems. The target anatomy must be segmented and a path for a fly-through must be computed and should be used as a basis for guided navigation (recall Chap. 13, where these steps were discussed in detail). Virtual endoscopy may be considered as: • • • •
a diagnostic tool and thus as an alternative to fiber endoscopy, a planning tool for surgeons to evaluate risks and the feasibility of surgery in case of obstructed or stenotic nasal meatus, a training tool for residents to enable them to practice with virtual models, and a tool for patient consult, before endoscopic sinus surgery to explain them the procedure and the associated risk in a descriptive way.
As a diagnostic tool, virtual endoscopy is useful and has the advantage that it can be performed as a postprocessing step without the patient and without local anesthesia. Septum deviation and perforation and meatal obstruction are clearly seen. However, as Han et al. [2000] already pointed out, mucosal surface and secretions are hardly visible. On the other hand, virtual endoscopy might deliver additional information compared to fiber endoscopy in case of a very narrow nasal meatus. Virtual endoscopy is useful as a planning tool if it is able to present the anatomy of the patient precisely and realistically, thus simulating the actual intervention.This requires to consider similar projection, e.g., a 45◦ or a 70◦ wide angle projection is frequently used. It is also desirable that the appearance of anatomical structures is similar to their appearance in the real world. Thus, colors and textures indicating a wetness effect for mucosa, for example, should be employed. The use of virtual endoscopy for training and patient consult raises similar requirements: realism and simple interaction are essential. For training, haptic feedback and tissue deformation are essential additions not necessary for planning. On the other hand, training does not require patient-specific data. 20.2.3 T H E S I N U S E N D O S C O P Y S Y S T E M
In the following, we focus on the planning scenario and describe the development and evaluation of a the SINUS ENDOSCOPY that is focused on the requirements of FESS system [Krüger et al., 2008, Strauß et al., 2009]. The system employs high resolution spiral CT data (slice distance: 1.0 mm) to enable a faithful presentation of the anatomy. This results in 100–250 slices and with an in-plane resolution of 512 × 512 pixels to an overall data volume of 50–125 MByte. Pathologies include mucosal swellings, tumor, and polyps of different sizes. We discuss the requirements, the visualization options, the user interface, and a few planning components that are beyond pure visualization of the target anatomy.
Requirements Virtual endoscopy will be employed to assess anatomical variants and pathologies.The nasal sinuses comprise both large hollow shapes and fine labyrinths—both should be accessed with virtual endoscopy. Even small passages due to swollen or pathological structures should be accessible. A high accuracy of the visual representation is essential. Discussions with ENT surgeons lead to the following requirements: • The preparation time should be less than 2 minutes. • The system should be flexible to adjust to different hardware setups.
e64
C H A P T E R e 20 . V I S U A L C O M P U T I N G F O R E N T S U R G E R Y P L A N N I N G
•
Planning components, such as drawing on top of the anatomy and measurements, should be included. • Virtual endoscopy should support archiving.
The first requirement clearly excludes any solutions that require the segmentation of the target anatomy. Instead, volume rendering with appropriate transfer functions is the only viable solution. The second requirement means that the system should be developed and tested with different hardware setups and the rendering quality should adapt to the performance of the underlying hardware—leading to fast update times even at slower computers. The third requirement states that the system should not only provide high-quality and fast rendering of the target anatomy. In addition, specific treatment planning questions should be directly supported. The most essential aspect is to enable surgeons to draw on the anatomy in an intuitive way to specify where to cut. This information should also be stored and thus be useful for documentation or discussion with a colleague according to the final requirement. In addition, there should be support for creating and storing snapshots and animations.
Visual realism and performance The size of clinical datasets (≤ 125 MBytes) enables to load them completely onto modern graphic cards for rather less complex models. The raycasting system consequently uses the graphics hardware. Semi-transparent volume rendering is provided, since the binary decision related to isosurface rendering seems not appropriate. Also, the filigrane anatomy of the nasal labyrinth would require a very large triangle mesh to represent the anatomy faithfully. Illumination, depth attenuation (fog effects), and other depth cues via texturing of the tissue surrounding the sinuses are provided, since they clearly enhance the shape recognition. Textures are based on digital photos and should resemble human skin. Other shading effects, such as wetness and the secretion level inside the nose, are provided to display the target anatomy in a familiar way by simulating the appearance from real endoscopy. An added lens distortion is also included to exploit the familiarity with fiber endoscopy.1 They are incorporated as default settings, if a powerful graphics card is available. Otherwise, as default value they are disabled to avoid slow performance. Figure e20.2 illustrates the different appearance depending on the available graphics hardware. Better rendering quality on low-end systems is feasible in case the camera is not moved. Thus, in this situation the lowresolution image is automatically replaced by an image in better quality. First pass rendering and empty space skipping are used (recall § 13.4). Aliasing artifacts are avoided with interleaved sampling (the GPU realization of Scharsach et al. [2006] was employed). Segmentation, and thus the integration of polygonal meshes representing segmented objects was not considered essential due to the inherent time constraints. However, a component to fuse volume data with polygonal meshes was integrated in the virtual endoscopy renderer for selected cases where additional preparation may be justified. The “Look behind the wall” effect when, e.g., segmented pathologies are visible behind walls, is the major benefit that is only possible with appropriate segmentation. User Interface The virtual endoscopy system has two user interface components: • •
the graphical user interface (GUI) that enables to adjust various parameters of the rendering, the layout of different viewing components and further options, and the control of the virtual camera.
GUI Components The GUI was designed to limit the necessary space and to leave the largest part of the screen for virtual endoscopy and related views. Moreover, the GUI components should not be spread over the screen, but be visually focused. Thus, they were integrated in one vertical column to be placed on the 1 Users employed 45◦ and 0◦ fiber endoscopy.
20.2
PLANNING AND TRAINING ENDOSCOPIC SINUS SURGERY
e65
FIGURE e20.2 Left: The viewport resolution is reduced, illumination and wetness effects are disabled to provide a fast rendering on cheap early graphics cards. Right: Rendering in full resolution with high quality on more recent and powerful graphics cards (From: [Krüger et al., 2008]).
left.The user interface for viewing fiber endoscopy at an appropriate monitor served as orientation—it has a moderate complexity and consists primarily of sliders, e.g., for contrast and brightness. Sliders enable fast numerical input with moderate accuracy. The initial GUI incorporated all widgets necessary for a fine-grained control of rendering parameters. While this design was useful for development and testing, it was too complex for regular use. Thus, the most essential development in the GUI was reduction of functions by either omitting some functions or summarizing them at a higher level. The most notable example was the number of sliders for the control of rendering options that could be reduced from 13 to 5.
Camera Control The camera is moved manually and can be placed with a pointing device or be incrementally moved with appropriate buttons. Zooming and panning are essential features that are integrated as well. The current camera position is indicated as a crosshair in axial slice views—a standard technique to enable that the user relates the endoscopic view to the underlying slice images (see Fig. e20.3). While realistic tissue deformation is not essential, collision detection was provided, since the user looses orientation if he or she moves through the walls. Approximate computations leading to fast but conservative results should be preferred instead of slow accurate distance measurements (recall § 10.4, where distance computation was discussed). Integration of Planning Components The user can draw on the tissue surface, e.g., to mark where he has to cut in surgery or to discuss with colleagues or residents. Two tools are provided for painting: a small pen for marking outlines and a brush for roughly defining regions that appear as hatching.The painting on the 2D viewport plane has to be projected on the (closest) anatomical structure and has to be stored along with it (Fig. e20.4). In addition, distance measurements are supported, since they enable to estimate whether nasal airways are wide enough to insert a fiber endoscope. 20.2.4 E V A L U A T I O N A N D C L I N I C A L U S E
Informal Evaluations During the development, several informal evaluations and interviews were performed. As an example, we observed an ENT surgeon using the system for planning an actual intervention. He appreciated the similarity to intraoperative views and the usability. The surgeon optimized visualization parameters like transfer function setting, texturing attributes, and the visibility of secretion. The
e66
C H A P T E R e 20 . V I S U A L C O M P U T I N G F O R E N T S U R G E R Y P L A N N I N G
Three orthogonal slice views and the endoscopic 3D view are combined in the SINUS ENDOSCOPY system.The crosshair cursor in the slice views indicates the camera position (From: [Krüger et al., 2008]).
FIGURE e20.3
SINUS ENDOSCOPY system was also demonstrated at a workshop with European ENT surgeons. There, it was employed with cadaver datasets. The cadavers could also be operated and investigated parallel with real endoscopes and instruments. The surgeons considered the clear visualization of the Rec. frontalis or the Concha nasalis medialis as essential. Such informal and formative evaluations were useful to detect minor problems. However, for assessing the usefulness of the whole system, a more comprehensive and larger study was conducted.
Systematic Evaluation The large scale evaluation of the SINUS ENDOSCOPY system was performed between 2007 and 2008 at two hospitals in Leipzig. In total, virtual endoscopy was performed in 125 patients in addition to fiber endoscopy. The system was employed by five experienced ENT surgeons. The SINUS ENDOSCOPY system was used for both surgical planning and patient consult. Eighty nine questionnaires from surgeons and 114 from patients were filled (see [Strauß et al., 2009] for more details). Feedback from Surgeons Surgeons reported a better understanding of the patient individual anatomy and of the planned intervention compared to the traditional planning with 2D slices.The investigation of the Rec. frontalis benefits from the system due to the highly individual anatomy of this structure. The similarity between the preoperative virtual endoscopy and the real anatomy in the intervention was assessed on a 5-point Likert scale (1 represents identical visualizations and 5 no correspondence between them). An average score of 2.21 confirms a good correspondence. However, the ability to adjust the transfer function was considered as both an advantage and a limitation. On the one hand, the visualization could thus be adapted to the dataset. On the other hand, the actual appearance was considered somehow arbitrary, since the extent of visible swellings could thus be manipulated.
20.2
PLANNING AND TRAINING ENDOSCOPIC SINUS SURGERY
e67
A snapshot of the drawn image is stored into a projection atlas texture, along with the tissue depth. By transforming the tissue position with the snapshot’s view-projection matrix, texture coordinates are generated for the lookup (From: [Krüger et al., 2008]).
FIGURE e20.4
The surgeons welcomed the real-time behavior of the system combined with an extraordinary visual quality. On the other hand, they questioned the texturing, since it is globally applied, thus also to structures that look different in nature. This raises a fundamental concern: high visual quality including realistic texturing is essential. On the other hand, CT data as the only input does not provide sufficient information for discriminating structures and differentiating textures appropriately. ENT surgeons also welcomed the functionality provided to maneuver through the nasal sinuses and considered them superior compared to fiber endoscopy. At the same time, and probably based on these powerful functions, they sometimes felt lost and—without proper points to reset—they started the whole navigation again from the very beginning. This clearly shows that users need simple functions to save and name views (camera position, orientation, and optionally lens distortion) in order to reuse these points later. With respect to regular clinical use, not only the quality of virtual endoscopy as a planning tool is essential but also whether virtual endoscopy may replace fiber endoscopy as a diagnostic tool. A clear advantage
e68
C H A P T E R e 20 . V I S U A L C O M P U T I N G F O R E N T S U R G E R Y P L A N N I N G
with respect to reduced effort and more patient comfort is only possible if fiber endoscopy can be omitted. This, however, is not the case [Strauß et al., 2009]. Asked, whether they can renounce fiber endoscopy and rely on virtual endoscopy only, they answered “I disagree” or even “I strongly disagree”—the two negative choices available. To some extent, this subjective statement may be a matter of familiarization, but certainly the quality of virtual endoscopy with respect to diagnosis needs to be increased.
Feedback from patients The 114 questionnaires filled by patients reported almost exclusively encouraging and positive results. Patients could better understand the anatomical situation and the pathologies compared to views from fiber endoscopy presented to them. They also felt that the surgeons were better prepared based on virtual endoscopy. Hints for Further Development A couple of ideas for future developments were uttered. Tissue deformation was desired to enable a better visualization of some structures, e.g., the bottom of the tongue. A combination with planning navigated surgery was desired. The major component of such an integration would be a flexible tool to specify the working space for surgery that can later be supervised with a NAVIGATED CONTROL system [Hofer et al., 2006]. However, since such navigation systems are not widespread and diverse, this connection is not a major “selling argument.” 20.3
VISUAL COMPUTING FOR INNER AND MIDDLE EAR SURGERY
20.3.1 M E D I C A L B A C K G R O U N D
Severe hearing impairment is an important chronic disease and since hearing loss is often age-related more and more people are affected. There are various kinds of hearing impairments that determine the appropriate treatment [Gerber, 2013]: • • •
conductive hearing loss. Sound does not reach the inner ear, e.g., due to an interruption of the ossicular chain. Often malfunction of cochlear hair cells cause malfunction of the cochlear amplifier [Dammann et al., 2001]. sensorineural hearing loss. The information transmission through the auditory nerve to the brain is impaired, e.g., due to infection or trauma. combined hearing loss. Conductive and sensorineural hearing loss occur simultaneously.
In addition to the patient’s anatomy, the residual hearing ability has to be considered and maintained leading to a complex planning process.
Diagnostic Imaging Due to the fine anatomy, imaging with a high spatial resolution is accomplished. CT data that cover a small area but deliver submillimeter accuracy is used for diagnosis and treatment planning. A resolution of 0.1 × 0.1 × 0.1 mm is currently feasible and widely used. This special kind of CT data is referred to as HR (High Resolution)-CT data. Figure e20.5 gives an overview of the relevant anatomy. 20.3.2 A C T I V E A N D P A S S I V E I M P L A N T S
In severe cases, conventional (non-implantable) hearing aids are not able to sufficiently compensate for hearing loss. In particular, conductive hearing loss often require implantable hearing aids and thus a complex surgical intervention where a sufficiently large cavity in the temporal bone needs to be generated.Advanced surgical planning and intraoperative guidance primarily aims at reducing the need for such a large cavity.
20.3
VISUAL COMPUTING FOR INNER AND MIDDLE EAR SURGERY
e69
Anatomy of the ear and its representation in HRCT data of the petrous bone region. (1) Auditory canal,(2) tympanic membrane,(3) tympanic cavity,(4) malleus,(5) anvil,(6) stapes,(7) cochlea,(8) arcade,and (9) auditory nerve (From:[Dornheim et al., 2008a]).
FIGURE e20.5
Implants may be passive, that is they just bridge over a gap in the ossicle chain or active meaning that they consist of multiple components, i.e., a microphone, a sound processing unit amplifier and a battery [Gerber, 2013]. The most important active implant is the cochlear implant that is implanted in the inner ear. Some active implants are placed in the skull base, e.g., the bone bridge.The bone bridge consists of an external audio processor, that is worn under the hair and an implant placed under the skin [Achena et al., 2012]. For treating hearing impairment in the middle ear, there are active and passive implants that bypass the outer ear and stimulate the ossicle chain directly. We will later show examples, where total ossicular replacement prosthesis (TORP) and partial ossicular replacement prosthesis (PORP) implants are used. 20.3.3 P R E O P E R A T I V E P L A N N I N G
The inner and middle ear represent the most complex and finest anatomy in the ENT domain. It is also strongly variable and fitting of hearing aids has to be carefully prepared for the patient-specific anatomy. Surgery in this area is accomplished to preserve or restore the sense of balance and hearing capabilities. Accurate preoperative planning may improve preoperative decisions and enable precise realization of surgery, e.g., supported by navigation systems or even robots [Bell et al., 2012]. Simple 3D visualizations, such as threshold-based isosurfaces and direct volume rendering are not appropriate to represent and explore the fine anatomy faithfully. Nevertheless they improve anatomic understanding compared to 2D slices only. Tomandl et al. [2000] andYoo et al. [2000] discussed how volume rendering can be fine-tuned to explore the ear anatomy. A“clear and realistic depiction of the anatomical structures and medical devices is required.” [Dammann et al., 2001].This requirement can only be met based on an explicit segmentation of the target structures, as will be discussed in the following. Surgery in the inner and middle ear, similar to sinus surgery, often occurs close to the N. facialis and, similar to neck surgery, close to the A. carotis. Middle ear surgery serves to implant hearing aids in case the ossicle chain exhibits a gap or unfunctional parts that need replacement. Access planning and implant placement are major tasks and thus similar to, e.g., some orthopedic interventions. Surgery is performed with an operation microscope. Three types of implants are currently used:
e70
C H A P T E R e 20 . V I S U A L C O M P U T I N G F O R E N T S U R G E R Y P L A N N I N G
• A Partial Ossicular Replacement Prosthesis (PORP) replaces malleus and anvil. • Total Ossicular Replacement Prosthesis (TORP) replaces all three ossicles. From the stapes only the elliptical base plate is preserved. • Stapes prostheses replace the stapes. They are inserted between the anvil and the stapes base plate. These kinds of prostheses are available in different length and geometry. All three kinds of prostheses need to transmit oscillations. Thus, after being inserted, they should not touch the tympanic cavity. They are fixed at both ends but should not hurt the tympanic membrane in turn. For the stability of the prosthesis and an unaltered transmission of sound, the angle between the prostheses and its adjacent structures is also essential [Bance et al., 2004]. It is very difficult to extract enough information from CT slice views to preoperatively select implants of a proper size. Thus, this decision is currently taken intraoperatively. In the following, we describe concepts for supporting such planning procedures by appropriate 3D visualizations. Moreover, we briefly discuss further support by biophysical simulations that attempts to predict the hearing ability.
20.3.4 V I S U A L E X P L O R A T I O N O F T H E I N N E R A N D M I D D L E E A R A N A T O M Y
Visual Exploration of the Inner Ear Anatomy The inner ear anatomy is crucial for a variety of hearing-aids implants. It should be displayed along with the geometric models of the necessary medical devices, e.g., transducer, microphone, and other implantable parts. Geometric surface models of the temporal bone, including the mastoid cavity and the implant should be presented along with interaction facilities that enable an interactive fitting. Such a tool was pioneered by Dammann et al. [2001] where rather simple but robust segmentation techniques from a commercial tool were employed and used to generate surface visualizations of implants and anatomical structures. Later, the same group came up with a more streamlined surface model generation [Salah et al., 2006]. Visual Exploration of the Middle Ear Anatomy The middle ear anatomy is essential for middle ear surgery as well as access for neurosurgery. The complex anatomy is very hard to understand from pure crosssectional images, in particular in case of severe pathologies [Rodt et al., 2002]. A careful combination of 3D visualizations with 2D slice views, e.g., where some slices are incorporated as reference in a 3D visualization may support the mental reconstruction of the patient anatomy. While for neurosurgical planning, transfer function-based volume rendering is appropriate, the small anatomical details of the ossicle chain cannot be presented in sufficient detail for implant planning. This is due to the notorious partial volume effects in small structures. Thus, Seemann et al. [1999] suggested hybrid rendering where volume rendering of the anatomical context is complemented by surface rendering of the segmented target anatomy. Segmentation of the skeletal structures is possible, in principal, with thresholding. Dornheim et al. [2008a] used a rough initial contour and applied a threshold of 700 HU to identify skeletal structures. Substantial post-processing is necessary to separate the individual bones and to represent surface details precisely enough.The cochlea inside the inner ear can also be segmented based on a threshold (−800 HU). The tympanic membrane is difficult to segment. In [Dornheim et al., 2008a] this step was performed manually.The auditory canal, however, can be segmented reliably with region growing. Figure e20.6 illustrates some visualizations based on these segmentations. Such visualizations form the basis for a geometry-oriented planning process that considers the access and size of the tympanic cavity. In Figure e20.7 the middle ear anatomy along with PORP and TORP is shown. For a real planning system, advanced support for this virtual placement is required (recall § 5.6.3).
20.3
VISUAL COMPUTING FOR INNER AND MIDDLE EAR SURGERY
e71
3D visualizations of the middle ear anatomy. The tympanic cavity is rendered semitransparently as context for the skeletal structures of the inner ear. The inner ear anatomy (stapes, malleus, incus) are shown as opaque surface rendering (From: [Dornheim et al., 2008a]).
FIGURE e20.6
FIGURE e20.7
Visualization of the middle ear anatomy along with a TORP (left) and a PORP (right) (From: [Dornheim et al.,
2008a]).
20.3.5 I M P L A N T I N G A D I R E C T A C O U S T I C C O C H L E A S T I M U L A T O R
Gerber et al. [2012] described the planning process for the implantation of the Direct Acoustic Cochlea Stimulator, a hearing aid that requires direct access to the middle ear.The drilling of the mastoid bone cavity (diameter 2–3 cm) needs to be planned and the risk, e.g., with respect to the distance to the facial nerve has to be considered (see Fig. e20.8). The mastoid bone is roughly segmented with a combination of thresholding and selection of an ROI. The facial nerve is roughly marked in the slices to define a curved planar reformation that is a suitable basis for a more elaborate segmentation. However, due to the small size of that nerve, it is not clearly recognizable in all slices and the segmentation thus exhibits some uncertainty. Later, he used this planning system and extended it toward intraoperative guidance. With a strongly improved patient-to-image registration, their system is able to provide guidance information with the high accuracy and reliability that is essential for clinical use [Gerber, 2013]. It is interesting that the author found an increased need for preoperative planning based on the availability of improved intraoperative guidance. 20.3.6 V I R T U A L O T O S C O P Y
In addition to interactive 3D visualization from an outside point of view, endoscopic viewing was considered useful to better assess abnormalities of the ossicle chain [Himi et al., 2000, Kikinis et al., 1996b]. Middle ear surgery poses a variety of requirements which are similar to sinus surgery. Again, a complex
e72
C H A P T E R e 20 . V I S U A L C O M P U T I N G F O R E N T S U R G E R Y P L A N N I N G
Left: The drilling trajectory is planned along with the ear anatomy. It is also quantitatively analyzed, e.g., with respect to distances to the facial nerve and the external auditory canal. Right: The whole implant geometry is shown and may be interactively changed, e.g., prosthesis length and orientation (Courtesy of Nikolas Gerber, University of Bern).
FIGURE e20.8
FIGURE e20.9 Virtual endoscopy of the inner ear that is not accessible with a real fiberendoscope. The combination of a slice view and the endoscopic 3D view provides useful information (From: [Krüger et al., 2008]).
bony anatomy has to be represented. Wetness of tissue and secretion are again essential aspects.The special kind of endoscopy that deals with the investigation of the middle ear is referred to as virtual otoscopy. This term is related to otoscopy—the investigation of the middle ear with a microscope. As Rodt et al. [2004] pointed out, virtual otoscopy is also valuable to assess postoperative success, evaluating, e.g., the course of electrodes and the correct placement of a hearing aid. During a workshop with ENT surgeons, virtual endoscopy of the ear with an adapted version of the SINUS ENDOSCOPY system was presented. In order to evaluate whether SINUS ENDOSCOPY is also applicable for this application area, we generated virtual endoscopy views for two cases.Therefore, the two HRCT datasets were loaded, and besides the reduction of the secretion value nearly to zero, no parameter adjustments had to be performed (see Fig. e20.9). The feedback of the surgeons was also positive with respect to the recognizability of structures. With real endoscopy it would not be possible to prepare an operation, due to the invasive nature of this task.
20.4
NECK SURGERY PLANNING
e73
Standardized Endoscopic Views Rodt et al. [2002] discussed not only thresholds for generating endoscopic fly throughs but also a set of six viewpoints based on anatomical landmarks that should be employed to explore endoscopic views in a reproducible manner.These six viewpoints serve to systematically search for pathologies and to compare pathological situations with normal ones. Moreover, such a standardization facilitates a structured report of an endoscopic examination. 20.3.7 B I O P H Y S I C A L S I M U L A T I O N
For implant planning and placement it is desirable to predict the hearing ability and to compare various options to come up with an optimal strategy. Hearing abilities are characterized by a audibility curve that depicts the hearing level (in decibel) over the frequency (20–20,000 Hz). The hearing loss is often not uniform but varies significantly over the frequency range and the output of simulations is an audible curve and not just one average hearing level. Therefore, biophysical simulations were carried out [Beer et al., 1999] and experimentally validated. As has been discussed in Chapter 19, simulations require accurate and smooth models with a good triangle quality. For performance reasons, the polygonal meshes should be carefully reduced. For an FEM simulation, the tympanic cavity as well as its transitions to adjacent structures, such as ligaments, muscles and tendons, and the internal structures need to be described as a set of volume elements, e.g., a set of tetrahedra. These volume elements are derived from an appropriate surface representation, e.g., a triangle mesh with good triangle quality. Figure e20.10 presents such surface models. The remeshing step to improve the triangle quality increased the minimum inner angle from 0.18◦ to 18.17◦ and thus the triangle quality from 0.11% to 28.41%. Biophysical simulation require also mechanical parameters like the elasticity of all the components and the thickness of the tympanic membrane [Decraemer et al., 2003].
20.4
NECK SURGERY PLANNING
The treatment of patients with head and neck cancer is challenging, since there is a growing number of treatment options, including various chemotherapies, radiation treatment and surgical removal (neck dissection).These treatment options may also be combined, e.g., a chemotherapy is applied to first downsize the tumor to make it resectable at all or to enable a more gentle strategy.
A surface model of the relevant anatomy (left,110 K triangles) was simplified with error control (16 K triangles) and subsequent remeshing to improve the triangle quality (23 K triangles) (Courtesy of Stefan Zachow, Zuse Institute Berlin).
FIGURE e20.10
e74
C H A P T E R e 20 . V I S U A L C O M P U T I N G F O R E N T S U R G E R Y P L A N N I N G
Neck dissection is a demanding procedure, where enlarged and potentially malignant lymph nodes have to be removed.The difficulty of the procedure is due to the complex anatomical relations in the neck region: muscles, nerves and various crucial vascular structures are very close to each other. Preoperatively, surgeons have to decide if a surgical intervention is adequate and whether or not a gentle strategy, preserving most anatomical structures, is feasible. Computer support for this intervention has to consider the following questions: • Are there critically enlarged lymph nodes? • Where are they located in relation to risk structures, e.g., major blood vessels? • Do they even infiltrate these structures? To answer these questions, all relevant anatomical structures, e.g., vascular structures, nerves, and muscles, have to be selectively visualized. Due to the sometimes low contrast to surrounding tissues, this is only feasible, if they are explicitly segmented. The segmentation information is also used for a quantitative analysis. Moreover, dedicated visualization techniques are necessary to analyze the spatial relations around selected lymph nodes.
Project Background To develop image analysis and visualization algorithms and to integrate them into a dedicated software assistant for the above-mentioned and related questions was the goal of two sequential national research projects starting in 2004 and lasting 5 years in total.2 Research was focused on automatic segmentation of relevant structures, e.g., lymph nodes [Dornheim et al., 2006b] and blood vessels [Dornheim et al., 2008b] and advanced visualization of these structures, e.g., by cutaway views for emphasizing lymph nodes [Krüger et al., 2005] and careful combinations of slice-based and 3D visualizations [Tietjen et al., 2006]. In visualization, we first attempted to display as many anatomical structures as possible simultaneously, using, e.g., silhouettes and opacity mapping to support shape and depth perception. Later, it became obvious that the resulting visualizations are too complex. Intraoperative visualization was not tackled, since, in general, open surgery has lower demands for intraoperative guidance compared to endoscopic and interventional procedures. In contrast to abdominal, neuro, or heart surgery, the target anatomy in the neck is rather close to the skin.Thus, localization of tumors and relevant risk structures is fairly easy. Two research prototypes for segmentation and for interactive exploration and documentation were developed and used in clinical practice since 2006. Initial refinements were targeted at improved segmentation (more automatic segmentation methods), modifications of the graphical user interface and a direct support for the surgical workflow. First, the clinical partners started to present these systems internally, e.g., at the tumor board, and later at their workshops, and conferences, leading to additional and constructive feedback. Based on this feedback and interest from a leading industry supplier, and the continuous support of the clinical partners, a spin-off company, DORNHEIM MEDICAL IMAGES, was founded in early 2008 in order to transform the prototypes into product quality software. Even in this (late) stage, new demands arose while old ones had to be rethought, leading to further research. Instead of discussing technical details, we emphasize the lessons learned. Within this project, medical doctors and computer scientists collaborated from the initial stages. Questionnaires and other task analysis techniques (recall § 5.2.1), e.g., observation of surgeons during their work and oral interviews, have been employed to deeply explore user and task needs. Medical doctors acted as codevelopers who contributed essentially to any design decisions. They were involved in early prototyping of visualization and interaction techniques, primarily in informal discussions where different options were presented and compared. Later, similar to 2 The project background description is based on [Preim et al., 2010].
20.4
NECK SURGERY PLANNING
e75
the virtual sinus endoscopy project, the medical doctors performed evaluations at a larger scale leading to increased visibility among ENT surgeons and further insights for the development team. We start with a discussion of the medical background (neck anatomy and surgical strategies) in § 20.4.1 and derive requirements for computer support (§ 20.4.2). 20.4.1 M E D I C A L B A C K G R O U N D
Patients with a malignant tumor in the mouth and neck region are likely to develop lymph node metastases in the neck region where a large number of lymph nodes is concentrated. Up to 50% of such local metastases were observed [Fischer et al., 2009b]. For the long-term survival of the patients, it is essential that not only the primary cancer but also all metastases are early and completely removed—this intervention is called neck dissection.
Medical Imaging Neck dissection planning is based on high resolution medical image data. In routine diagnosis, CT as well as MRI data are employed. A very good soft tissue contrast is the major argument for using MRI. The soft tissue contrast enables, e.g., a good discrimination between inflammation and tumor. Skeletal and cartilaginous structures, however, are better visible in CT data. The higher resolution of multislice CT data (slice distance of 1 mm) is preferable to detect and characterize lymph nodes. Shape, size, infiltration, and vascularization are indicators for malignancy. Metastases are likely to exhibit a spherical shape, are larger and tend to infiltrate surrounding structures—these attributes can be well determined in CT data. Also, a central necrosis, a safe sign for malignancy, is obvious in CT data. Strong vascularization is an essential indicator for a malignant cancer. However, these vascular structures are too small to be visible in CT and MRI data. Only color Doppler sonography is able to represent the flow induced by smaller vascular structures (Fig. e20.11). Thus, sonography has a place in diagnostics and surgical planning, but is only employed by highly specialized medical doctors. In some hospitals, radiologists present the cases to the surgeons and answer questions; actually leading to a joint discussion of surgical strategies. In other hospitals, basically the surgeons themselves interpret
Colored Doppler sonography delivers information in high spatial resolution and in addition particularly indicates the vascularization of a lymph node—an essential indicator for malignancy (Courtesy of Christoph Arens, University of Magdeburg).
FIGURE e20.11
e76
C H A P T E R e 20 . V I S U A L C O M P U T I N G F O R E N T S U R G E R Y P L A N N I N G
the image data to come to their own decisions. CT data are much easier to interpret and therefore preferred by surgeons. While MRI provides a large space of choices for enhancing and suppressing structures, the correct interpretation of these images is a matter for experienced radiologists. A typical MRI study involves at least three scanning sequences, the images of which have to be mentally integrated. CT provides standardized Hounsfield values and only one CT neck dataset has to be analyzed instead of a series of MRI data.The decision on an imaging modality in case of (older) cancer patients is not influenced by the X-ray exposure of CT data. Even better diagnosis and therapy planning may be performed with combined PET/CT data. This combination increases the sensitivity of the detection of metastases. However, it is still an expensive modality with limited availability.Thus, we focus on pure CT data and additional endoscopic intervention.
Surgical Strategies The choice of surgical strategies depends primarily on the existence and location of enlarged lymph nodes. If a patient with a known cancer in the mouth or neck region exhibits lymph nodes with a diameter beyond 1 cm, this lymph node is suspicious to be a metastasis. Judging the size of a lymph node, is difficult. Since lymph nodes exhibit low contrast to surrounding structures, they may be even difficult to recognize. Moreover, due to the limited resolution of the data, each measurement exhibits an inherent uncertainty of at least the spacing of a voxel (this value equals 0.5–2 mm in our datasets). Lymph Node Levels The location of lymph nodes is described with respect to five lymph node levels. This characterization is important, since usually all lymph nodes in one level are removed if one of them is affected. Lymph node levels are a typical example for a classification that is employed to discuss the location of pathologies in a standardized manner. The liver segments defined by COUINAUD, as well as lung segments are other examples with widespread use in oncology. Anatomical classifications provide a common frame of reference for cooperation between medical doctors, e.g., between radiologists and surgeons. In particular, the infiltration of a large muscle (M. sternocleidomastoideus), a nerve (N. facialis), the larynx or blood vessels determine the surgical strategy. If the Arteria carotis interna is strongly infiltrated (infiltration of a large portion of the circumference), the pathology is regarded as not resectable, since this structure is life-critical. The infiltration of other structures, such as muscles and nerves, is not prohibitive, but makes a radical strategy necessary which results in long-term impairment, such as paralysis if the N. facialis is resected or loss of voice if the larynx has to be completely removed. Figure e20.12 gives an overview on the neck anatomy. The identification and analysis of lymph nodes with respect to size, shape, and distance to vital anatomical structures is crucial for the surgeon’s decision. 20.4.2 T A S K A N A LY S I S
As a major prerequisite for re-developing a research prototype into a practical tool for real world use, we entered again in a stage of in-depth task analysis (this process was first described in [Preim et al., 2010]). While a trade-off between scientifically interesting questions and real needs was required in the research project, a rigorous analysis of tasks, preferences, and priorities was necessary for the actual clinical use. This analysis was accomplished as a larger set of interviews at the ENT department in Leipzig as well as through observations of clinical processes including surgery. In principle, the same techniques have been used within the research project, but in a significantly lower scale. This analysis was focused on an understanding of: 1 2 3
individual surgical planning, particularly preoperative decisions, integration of information derived from radiology data and other examinations, collaborative treatment planning, in particular tumor board discussions,
20.4
NECK SURGERY PLANNING
e77
3D visualization of the neck anatomy based on CT data of a patient. Bones are displayed in white, muscles are brown, lymph nodes yellow. The elongated red and blue structures depict the two major vascular structures: Aorta carotis interna and Vena jugularis (Courtesy of Christian Tietjen, University of Magdeburg). FIGURE e20.12
4 5
patient consultation, and documentation.
To represent the results, informal scenario descriptions have been created, discussed, refined, and verified by discussing them with the clinical experts [Cordes et al., 2009] (recall § 5.2.3.2).These scenarios describe different clinical cases, all examinations which are accomplished to come to a diagnosis, the planning process and the postoperative situation. Special care was necessary to cover a representative set of different diseases (different with respect to number and size of metastases, location of metastases, infiltration of risk structures). A few examples, related to selected issues of the list above, might highlight this process.
Infiltrations Potential infiltrations of anatomical structures by a tumor are investigated in detail with respect to the likelihood of an infiltration, the extent of an infiltration (Which portion of a vessel cross section is affected by an infiltration?What is the longitudinal extent of this infiltration?). Thus, dedicated visualizations are desired which contain just the risk structure, the tumor and the possible infiltration area. Radiologists often conclude that infiltration is likely even if not directly visible in case of a distorted outline of an adjacent anatomical structure. Integration of Panendoscopic Findings Besides CT or MRI data, endoscopic interventions are the most important source of information. With an endoscope, the surgeon investigates possible tumors using optical information and touch sense. Laryngoscopy is an endoscopic examination that serves to evaluate possible larynx infiltration in detail. This information is represented in special sheets of paper, where schematic
e78
C H A P T E R e 20 . V I S U A L C O M P U T I N G F O R E N T S U R G E R Y P L A N N I N G
drawings of the neck anatomy are added with the findings. The task analysis clearly revealed a need for integrating this information with the electronic documentation and the findings from CT data.
Documentation is an essential aspect that was underestimated in the initial research project. For medical doctors in general, and for surgeons in particular, a careful documentation of diagnostic information, treatment decisions, and patient consultation is essential because of juristic reasons and of the account with social insurance. Such bureaucratic tasks are time-consuming and annoying for the surgeons. Therefore, it turned out that any support which shortens the documentation without degrading its quality is highly welcome. Thus, we carefully investigated, e.g., automatic tumor staging, based on measurements applied to all metastases and generated automatic visualizations for direct use in the documentation to reveal all relevant findings. This includes electronic versions of schematic drawings that are frequently used by medical doctors to represent tumor size and location. In § 20.6.5 we discuss how these requirements are fulfilled in the TUMOR THERAPY MANAGER. 20.5
I M A G E A N A LY S I S F O R N E C K S U R G E R Y P L A N N I N G
The essential prerequisite for surgical planning is to segment the relevant anatomical and pathological structures.The segmentation enables the selective visualization and quantitative analysis of the patient data. 20.5.1 I M A G E A N A LY S I S T A S K S
Based on many discussions with various clinicians and an analysis of medical publications the following target structures were identified as being the most relevant for preoperative planning: • Vascular structures (V. jugularis, A. carotis), • Muscles (M. sternocleidomastoideus), • Skeletal structures (mandible and clavicle), • Pharynx, • N. accessorius, N. vagus (if they can be delineated), • Larynx, • Primary tumor, and • Lymph nodes. In selected cases, specific requirements for computer-supported planning arise, e.g., the segmentation of additional structures or certain measurements. These requirements are indicated by medical doctors by filling a structured form [Cordes et al., 2006]. In the basic version of our dedicated image analysis software, livewire combined with shape-based interpolation [Schenk et al., 2000], interactive marker-based watershed [Hahn and Peitgen, 2003] and basic region growing methods have been employed [Cordes et al., 2006]. While the vascular structures, muscles, and the glands could be segmented with these semi-automatic methods, the relevant nerves could often not be identified due to their size in relation to the image resolution. In CT data with low slice distance, the N. accessorius and N. vagus could be identified manually in a few slices only. As only the approximate path of these nerves is essential for surgeons, the nerves are partially segmented and used for an approximate visualization (§ 20.6.1). Primary tumors were segmented manually as well.They exhibited low contrasts and could only be distinguished by exploiting considerable anatomical knowledge.The average effort for the segmentation of all target structures is about 90 minutes
20.5
IMAGE ANALYSIS FOR NECK SURGERY PLANNING
e79
(see [Cordes et al., 2006] for an evaluation with ten users and two datasets). The average length of the most time-consuming segmentation subtasks was: • • •
lymph node: 19 minutes, vascular structures: 19 minutes, and M. sternocleidomastoideus: 17 minutes.
In extreme cases, overall lymph node segmentation may take up to 90 minutes. Since this is significantly more than can be afforded in routine clinical work, an acceleration of image analysis was aimed at and is described in the following subsections. 20.5.2 M O D E L - B A S E D S E G M E N T A T I O N F R O M C T N E C K D A T A
The necessary speed-up of the overall segmentation can only be achieved with model-based segmentation (recall § 4.5). Such model-based approaches are difficult to develop and very specific for a certain anatomical structure. The structures that lead to the longest segmentation times were tackled with high priority. There are various options, e.g., Statistical Shape Models (SSMs) or Active Contours.
Mass-spring Models We employed instead mass-spring models where geometric objects are defined by: • •
a set of masses, characterizing the basic shape, and a set of springs with a certain elasticity that define to which extent the model may be locally stretched or compressed to adapt to particular image data.
A mass-spring model is derived from one template segmentation and thus the segmentation process is related to template-based segmentation (recall [Montagnat and Delingette, 1997]). Obviously, it is reasonable to employ one framework to segment all relevant target structures. An individual adaption to each individual structure is necessary, but by using one framework experiences gained in the adaptation to a single structure may be employed for other structures. The development of appropriate segmentation models takes considerable time and requires a lot of experience, since many parameters are involved and the relation between initialization and model adaptation is complex. However, alternative approaches also require considerable experience, and, in addition, often a large set of trained examples. A major advantage of mass-spring models (MSM) is that they do not require such a training set and indeed the basic shape of the models is often derived by just one example referred to as prototype.This example, of course, is carefully chosen to be a typical representative of that shape. Initialization in model-based segmentation is often performed by a rough specification of location, size, and orientation of the target structure. As an example, an average model might be projected over the image data and is dragged, scaled, and rotated to roughly fit to the image data. In contrast, with MSM the user selects a few landmarks that serve as hints for the model placement. Our experience indicates that this initialization leads to better results (see, e.g., [Dornheim et al., 2006a] for a quantitative analysis) and, depending on the number of landmarks to specify, tends to be faster. The higher accuracy is due to the fact, that landmark-based initialization leads to a non-linear, elastic fitting process, whereas affine transformations can only represent a global rigid transformation. Obviously, anatomical shapes from patient to patient do not only differ in size, orientation, and position, but instead many local changes occur.
Sensors in Mass-spring Models Mass-spring models are heavily used in soft tissue simulation and in surgery simulation where the response to forces exerted by the user are thus reflected. To use this concept in
e80
C H A P T E R e 20 . V I S U A L C O M P U T I N G F O R E N T S U R G E R Y P L A N N I N G
segmentation, sensors are employed to capture certain image information, such as intensity values and gradients. In segmentation, however, no physical process is simulated. Model assumptions include expected intensity values, gradient magnitude, gradient direction, and curvature-related measures. The expected shape is represented by the initial configuration of masses. These model assumptions guide a simulation process where the positions of masses are iteratively adapted to the actual image information. Thus, the process is similar to active contours where internal and external forces guide an optimization process to adapt a deformable model to image features. Internal forces represent assumptions related to the object shape. External forces represent user input, e.g., the initial placement of the model, and sensor information. The simulation stops when the internal and external forces are at equilibrium state. In practice, a stopping criteria is employed that terminates the simulation when all changes of positions are below a certain threshold. The choice of that threshold is a trade-off between speed and accuracy, that is usually carried out by the developers and hidden from the users.
Intensity and Gradient Sensors A sensor dragging their associated mass to voxels of a given gray value range is referred to as intensity sensor. A direction-weighted sensor steering toward voxels at gradients of high magnitude and expected direction is referred to as gradient sensor. Thus, in CT data, intensity sensors reflect that target structures exhibit a certain range of Hounsfield values, and gradient-related information is employed to attract the model to edges (large gradient magnitude) and to favor smooth shapes (slight changes of the gradient direction only) [Dornheim et al., 2007]. Stable Mass-spring Models with Torsion Forces A notorious problem of using MSMs for segmentation in 3D data is stability—the models tend to collapse easily, since the image information is weak and the springs do not sufficiently stabilize such models. Thus, the major idea introduced by DORNHEIM and TOENNIES is to use a stabilized version, referred to as stable mass-spring models (SMSM) [Dornheim et al., 2005b]. In an SMSM, the angles between adjacent springs are limited. Thus, not only the rest length of a spring is captured, but also its relative rest direction. Every change to that direction initiates a torsion force that try to compensate for that change and actually leads to stable directions. Simulation Parameters SMSMs simulate a physical adaptation process that is steered by a couple of parameters.The choice of these parameters primarily determines whether the optimization process converges at all and how fast it converges. A damping factor (