CSIT6910A Independent Project Fall 2011
Video Gallery Visualization Based on HTML5
Student: ZHAO Yue Email:
[email protected] Supervisor: Prof. David Rossiter
Video Gallery Visualization Based on HTML5
Contents 1. Introduction ................................................................................................................................... 3 2. Background ................................................................................................................................... 3 3. Visualization.................................................................................................................................. 4 3.1 Still frames to ‘real’ motion ................................................................................................ 4 3.2 Sorting algorithm to animation ........................................................................................... 4 4. Implementation ............................................................................................................................. 6 4.1 Overview ............................................................................................................................. 6 4.2 Architecture of the program ................................................................................................ 7 4.3 Specific Details ................................................................................................................... 8 4.3.1 Browser Support ...................................................................................................... 8 4.3.2 Interactive audios ..................................................................................................... 8 4.3.3 Partial sorting ........................................................................................................... 8 4.3.4 Transition playback .................................................................................................. 9 5. Shortcut ....................................................................................................................................... 10 6. Conclusions ................................................................................................................................. 11 7. References ................................................................................................................................... 12 8. Appendix:Minutes .................................................................................................................... 13
Video Gallery Visualization Based on HTML5
1. Introduction Human machine interaction has fundamentally changed the way that people think about computation. It’s about patterns, not bits. To discover trends inside massive data, both human knowledge and computer calculation play as factors. On the other hand, making media much more tangible is becoming a challenging goal as user experience plays such a paramount role in cutting-edge product design. One awesome concept in this area is visualizing information. The application we implement provides users interactive video summaries in web pages.
The remaining chapters in the beginning illustrate some background germane to user interface and HTML5, secondly discuss the methods applied to visualize the progress of sorting videos by different principles, then in chapter 3 we depicts the requirements of setting up the system and related operation, the last chapter describes the scenarios which can make use of this project and concludes the improvement and limitation.
2. Background Surrounded by overload information, people nowadays need powerful tools to tease out essence of data. Moreover, statistics are complicated and arduous. When it comes to how to let clients get engaged, it is the insightful perspectives the system offers that may make a difference. Traditional analytic tools, in general, create diagrams to give a brief view of the distribution. Compared to numbers and characters, pictures are able to convey messages and there are a lot of cheerful research results.
For instance, Microsoft Silverlight Pivot Viewer Control [1] is released as a stunning way to browse web database. Each metadata is displayed in the form of high-resolution content and
Video Gallery Visualization Based on HTML5
interaction model allows users explore large quantities of information with natural transition.
Another example is a website called WebVizBench, which created experience to let music fans search historical airplay data while putting HTML5’s fabulous features to the test.
There is no doubt that audience get longer engagement when viewing visual dataset. Actually, we can push it further by replacing the images with videos. Compared with a playlist form, a diagram of pictures is compelling, and a wall of moving video previews is tremendously gorgeous.
The difficulty is that most video players do not provide flexible position attributes, thus we need to build new controls for drawing pixels instead of using existed APIs. Thanks to HTML5 canvas [3], this idea is feasible.
3. Visualization 3.1 Still frames to ‘real’ motion For video data, there is no need to insert middle samples because the eye system cannot detect the intervals in time as long as the number of frames is greater than or equal to 12. Due to this illusion, our application copy one frame from the video file to the canvas at a time and update the canvas 25 times per second. The parameter 25 is adjusted to the frame rate of the video.
3.2 Sorting algorithm to animation In computer science, there are plenty of sorting algorithms. But they are designed in the way
Video Gallery Visualization Based on HTML5
of how machines operate memory units, not close to the way of how human brains rank elements intuitively. Suppose there are a mount of cards, computers permute them by reading the input list and doing some calculation to work out the output list; we human normally move disordered card to its target position and job done. Our steps of combining these two ways together are as follows: 1)
Record the origin coordinates of every item
2)
Let the computer finish reordering and map the output list to a target coordinates list
3)
Divide the difference of target coordinates and origin coordinates by transition rate, the result is an offset vector which leads the item to its target position.
4)
Add the vector to the current coordinates when the canvas refreshes
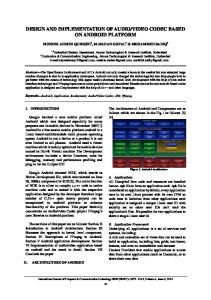
The transition is also applicable to filtering. The straight forward animation, as shown in Figure 1, helps users understand the trend when the videos of all speakers are narrowed down to videos of male speakers. In this scenario, the videos are sorted by duration. Given the condition that the gallery displays only videos of male speakers, videos of female speakers move out of the canvas from its bottom right corner and those videos of male speakers which lined behind them move forward to fill the blank. Videos which have not reached their target positions are half transparent. In addition, according to the fact that the upper limit and lower limit of duration do not change, we are able to draw the conclusion that the range is determined by videos of male speakers, that is to say, both the shortest video and the longest video are lectures of male speakers.
(a) (b) (c) Figure 1. Transition of videos: (a) Videos of all speakers; (b) A frame captured during transition; (c) Videos of male speakers
Video Gallery Visualization Based on HTML5
Besides, photo frames or tags can be placed on the videos to distinguish different categories. Videos related to female speakers are in white iPad frame, while videos related to male speakers are in black iPad frame. By doing so, even if the camera turned to slides or audience, users can identify the gender of the speaker.
4. Implementation 4.1 Overview Generally, the website needs a webpage for layout, a java script for functions and media files. Static database can be included in the script, while dynamic database requires complex access methods. Cascading Style Sheets is optional for presentation. The first value in a certain order
The last value in a certain order Figure 2. Interface of the video gallery
Video Gallery Visualization Based on HTML5
Figure 2 shows the main user interface, it consists of two parts, video displaying area and info exploring panel. The former is in charge of providing visual playlist and plaintext details, while the latter is in charge of offering sorting and filtering controls. The detail of an item will pops up when we hold the item.
4.2 Architecture of the program The key function in the program is frame processing, it is called every 1/25 second after the webpage initializes canvas, summary video, audios and other elements. When changes of entire dataset or individual items are done, this function will output the results. Double clicking a specific item will open a new widow where users can view the full content of the item.
Figure 3. The flow of processing
Video Gallery Visualization Based on HTML5
4.3 Specific Details 4.3.1 Browser Support It is highly recommended to use Chrome to view this website, others may have problem of interpreting events on HTML5 canvas or they do not support the media formats. [4, 5]
Figure 4. Array of compatibility between browsers and media file formats
4.3.2 Interactive audios Unless we deal with harmony, to play all the sound tracks simultaneously is noisy and unacceptable. Thus, only one track is turned on and users may switch to another track by moving the cursor on the matching video. The application requires audios being extracted from corresponding videos so that they can synchronize. The alternative way is to generate a duplicate cache from the video to substitute the entity of its audio, but the rendering will slow down.
4.3.3 Partial sorting It is possible that users are only interested in some data instead of the whole. The scale of data for sorting is customized, but one more processing need to be applied in order to hide the videos that are not chosen. The following pseudo-code is for permutation after filtering.
Video Gallery Visualization Based on HTML5
For ( i=0; i