Veidekke 1
Veidekke is one of Norway's leading contracting companies. The company has a wide range of resources and expertise and its finances are sound. Veidekke went into operation in 1936, and has been listed on the Oslo Stock Exchange since 1986. The company's operations span a wide field and include local building and construction, specialised construction work, asphalt operations, crushed stone and gravel production, property development, financial management and international contracting operations. Veidekke also has a subsidiary in Berlin, Veidekke GmbH. Ownership Throughout its development Veidekke has emphasised the importance of controlled growth and a strong focus on profitability through a flexible organisation with decentralised financial responsibility. Importance is also attached to involving the employees as co-owners. Other large owners in the company are Norwegian institutional investors. Future objectives Veidekke aims to remain an independent Norwegian-controlled company with no dominant owners and a strong involvement of the employees as co-owners. The foundation for this is based on profitable operations. It is Veidekke's intention to remain a leading contracting company with high standards of health, environment and safety. Quality in the building process and the development of skills among employees shall contribute to maintaining and consolidating Veidekke's position on the market. Collaboration with other companies in Norway and abroad will be continued in order to strengthen Veidekke's competitive position, particularly when it comes to international projects. Veidekke aims to play an active role in the further restructuring of Norway's building and construction industry, backed by its professional and financial strength.
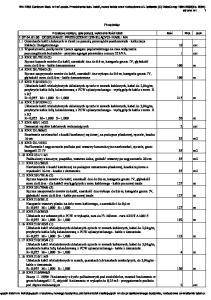
FIVE-YEAR REVIEW
1994
1993
1992
1991
1990
Turnover *
3,162
3,137
3,665
3,640
2,093
5.2
75.2
81.2
74.7
90.1
1,731
1,358
1,205
1,712
1,138
28.7
31.5
28.6
24.6
29.4
Earnings per share
- 1.25
8.84
8.70
7.74
12.53
Dividend per share
2.00
2.75
2.25
2.25
2.25
2,785
2,694
2,869
3,007
1,702
Profit before taxation * Orders-on-hand excl. asphalt * Equity ratio (%)
Number of employees at 31 December * NOK million Definitions and other key figures, see page 34.
ANNUAL REPORT 1994
Highlights 2
Drawing by Atelier Holthe A/S
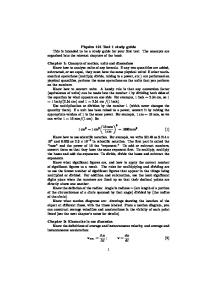
• Veidekke had an aggregate turnover in 1994 of NOK 3,162 million. Profit before taxation was NOK 5.2 million. Total orders-on-hand (excluding asphalt) were NOK 1,731 million.
Photo: Terje Moldaunet
The Arctic Hotel for Rica in Tromsø. Building • 40 % of new contracts were won without tendering. These include the Ski shopping centre, the Arctic Hotel in Tromsø, the Vinterbro shopping centre and the Police Headquarters in Bodø. • Renovation contracts for close on NOK 140 million have been signed with various housing cooperatives. • House-building for Veidekke's own account doubled compared to last year. • Eight petrol stations were built in Germany for Statoil.
Construction of the asphalt core and filter in the Storglomvatn dam for the Svartisen Power Plant.
Asphalt • Work has commenced on the construction of asphalt cores and filters for the Storglomvatn dam and the Holmvatn dam which form the reservoir for the Svartisen power plant. This contract is valued at NOK 80 million, and the work will stretch over four seasons. • 2.5 million tons of crushed stone and gravel were produced in 1994. Part of this volume is used by Veidekke for its own asphalt production, but most is sold to external customers on the Norwegian and international markets.
ANNUAL REPORT 1994
Photo: Jan Bryde-Erichsen
3
Photo: Ole R. Paulsen
The new tunnel at Bekkestua. Heavy Construction • Veidekke is involved in contracts totalling almost NOK 300 million which are linked with the development work for the new airport at Gardermoen. The largest of these refer to stone crushing operations at Garderfjell and the tunnel entrance and ramps for the GMB high-speed railway at Etterstad on the new Gardermo Line for the Norwegian State Railways. • The building of 150 base stations covering the south of Norway for NetCom GSM started in June. • Veidekke was awarded a joint contract with the Swedish company, Siab, for the blasting of cavern halls in Lidingö outside Stockholm. • The new highway tunnel at Bekkestua outside Oslo was opened in November. • Nocon was awarded a contract for the construction of a quay in Thailand to the value of NOK 62 million.
Fornebuveien 9 at Lysaker.
Property • Three major projects were completed. Fornebuveien 9 in Bærum and the Larvik Police Station are let on long-term leases, while Kirkebrygga in Fredrikstad was sold. • Veidekke’s largest development project for its own account is its share of the former NEBB property at Skøyen in Oslo. Development will start as soon as leases have been signed for the greater part of the premises. • Property under development by Veidekke totals 89,139 sq.m.
ANNUAL REPORT 1994
Playing an active role 4
T
here was a decline of about 30 % in the Norwegian building and construction market between 1987 and 1993, and some sectors declined even more. This proved to be a hard test of the contracting companies’ ability to adjust to the situation. Most of them were not successful in cutting back quickly enough, which led to considerable surplus capacity in some areas. This was still the case last year, with intense pressure on prices for most contracts in spite of incipient growth in the market. One good point about the market downturn is that it brought about improvements in efficiency and innovation more quickly than would probably have been the case otherwise. However, it also pushed prices and profits down, causing a further weakening of many companies’ finances. For this reason, we do not have a strong contracting business in Norway today, measured in terms of financial strength or size. Our great strength lies in technological expertise and project management and in good industrial relations and teamwork on the building site. This gives us the strength to compete against international companies, whether at home or abroad. But the lack of financial strength and size is a drawback. How are we to meet this challenge? Better economic conditions are important, but this in itself is not enough to put us back on the right track. Need for change We can rejoice over the positive trend in the market, with growth in several sectors this year, and the promise of further overall growth next year. Implicit in the market upswing are many challenging and important single assignments, which will not only help to improve the balance between supply and demand and thus reduce surplus capacity, but will also help us to develop our skills as contractors.
Nevertheless we must not be lulled into thinking that we can relax our standards when it comes to change and further development. We have never got anything for nothing, and we will have to fight even harder to achieve a long-term, positive development for the companies in our business.
ANNUAL REPORT 1994
There are several reasons for this: In the first place, we cannot expect to relive the long periods of growth we enjoyed for much of the post-war period and up to the beginning of the eighties - growth that was spurred on by major work on the infrastructure that was required for reconstruction, industrial development and public building in Norway. Today, we are in an upward phase, but we cannot count on growth rates remaining high. The eighties also taught us that our markets can fluctuate wildly. Hopefully, we will not experience such marked fluctuations again, but there will still be fluctuations. In the second place, the competitive arena has changed and is different from what it was, say, in the seventies and early eighties. This applies to the relationship both between Norwegian competitors and between them and international contractors. A gradual change has taken place here, which is just as significant as the depression but which has not caught the eye of the media to the same extent. We now have a large number of new operators, either through new establishments or through break-aways from large companies. Swedish companies are also far more active on the Norwegian market than they were 10-15 years ago. They are involved in projects and have interests in Norwegian contracting companies. Far behind It is important for our country to have a continuous, dynamic process in the individual industries so that new, improved concepts can replace the ones that have become obsolete. It is also important not to underestimate the development potential that lies in existing businesses. Everything new and good is not necessarily the result of new establishments or new enterprises. A little too much of the old attitude that “we mustn’t let any one company get too big and too dominant” is still prevalent, but let us hope that it will become less so as time goes on. I say this because I cannot see any reason for such an attitude in the contracting business in Norway today, where the four largest companies have a turnover totalling
5
one tenth of the market, while the corresponding figure in Sweden is 30 %. It is true that the concentration rate is higher in Sweden than in most other countries, but that is because they have contractors of international format. I am not suggesting that we can or should attain the Swedish level, but it is nevertheless thoughtprovoking that we are so far behind.
Terje R. Venold
Cooperation and structure What are we going to do to hold our own in the next round and prevent Norwegian contractors from being demoted to the second division? Here, companies and the authorities should contribute. The main responsibility lies with the individual company, but we also need positive interaction between the different companies and with the society around us. A good example of this is the Norwegian Construction Group, Nocon, which is a joint venture set up between Veidekke, Selmer and Norwegian Contractors to market specialised Norwegian expertise in rock and concrete technology. The opportunities are many, but so are the challenges and pitfalls. By joining forces, we achieve a greater marketing impact and a broader resource base with which to realise projects, and at the same time we can spread the risk. The Research Council of Norway considers this joint venture to be sufficiently interesting and significant to grant Nocon valuable financial support. We must also keep the structure of our industry in mind. It would be unnatural for Veidekke, with fifteen acquisitions behind it, not to consider taking further steps of this kind. In view of the obvious weaknesses that came to light in 1994, we have had to direct all our attention towards strengthening our organisation. I believe that we are now in a strong position as regards both management and organisation and that we have every possibility of getting back on track in 1995. Our financial strength is intact and I understand that we have the confidence of the market. Our most important task will be to show that we are worthy of this confidence by achie-
ANNUAL REPORT 1994
ving results in 1995. We must also keep our sights on possible trends in the market and in the structure of the industry in the years to come. Veidekke’s special qualities The foundation for our further development - and this is what is going to keep us in the lead in the future - is our expertise. Machines and equipment are important, but most of these are available on the market as standard items. What makes - and is going to make - Veidekke special are the people who work in the company, their skills and commitment. Veidekke must be a listening, learning and developing organisation, in which each individual employee feels that he or she is not only important to the company, but actually is the company. To be successful, we have to work on a broad front. We have to put meaning into jobs and work tasks; we have to draw up development and career programmes for managers. We have to recruit the best skilled workers and continue to take in a large number of apprentices. We have to strengthen our ties with technical colleges and universities and recruit the best engineers and graduate engineers. We have to develop further our use of control systems and information technology, and improve our purchasing and materials administration. Being a leading company, we have naturally already come a long way in these areas, but we have to go on developing. If we do that, we will be able to offer more attractive jobs and become an even better and more efficient partner for suppliers and customers. At the same time, we will be laying the foundation for better earnings and for Veidekke to continue playing an active role in the structural development of the industry.
Terje R. Venold President and C.E.O.
6
Photos page 5 and 6: Bjørn Blegen
The members of the Board of Directors. Left: Steinar Krogstad and Kåre Strand, who are employee representatives, Karsten Houm, Christian Bruusgaard, who is Chairman of the Board, Flemming Vejgaard Andersen, Helge B. Andresen, Sigmund Kjos and Arve Johnsen.
ANNUAL REPORT 1994
Report of the Board of Directors 7
Main features 1994 was the first year of growth in the market after many years of decline. The upswing was particularly noticeable in building operations and the commencement of new dwellings and non-residential buildings showed a rising trend throughout the year. Nevertheless, the market was still influenced by surplus capacity and pressure on prices, and the effect was most evident in the heavy construction sector. Veidekke achieved a total turnover of NOK 3,162 million in 1994 (NOK 3,137 million in 1993). Turnover for asphalt was lower than in 1993, but building and heavy construction operations both showed an improvement. The profit for the year was affected by major losses on certain heavy construction projects. This area of activity posted an overall loss of NOK 35 million, compared with a profit of NOK 22.2 million the year before. Building operations gave a profit of NOK 13.0 million (NOK 20.9 million). This fall was mainly due to losses in the first quarter, while operations during the rest of the year had an overall profit on a par with the year before. The profit margin was, however, not satisfactory. The asphalt division improved its earnings in spite of the fall in turnover, giving a profit of NOK 35.7 million (NOK 30.5 million). Veidekke’s aggregate profit before taxation was NOK 5.2 million (NOK 75.2 million). Orders-on-hand for building showed a positive trend throughout the year. After falling somewhat during the first half of the year, orders-on-hand for heavy construction began to improve again. All in all, this gave orders-on-hand at the end of the year amounting to NOK 1,731 million, as against NOK 1,358 million a year earlier. Earnings per share were NOK -1.25 (NOK 8.84). Building Although building activities picked up
ANNUAL REPORT 1994
during the year, surplus capacity and keen price competition continued to effect the market. In areas such as Oslo and Akershus where the increase in building activity was particularly noticeable, there were signs of rising costs for materials and subcontractor services. There was a marked rise in timber prices all over Norway. Figures for the first quarter showed the effects of costs relating to capacity adjustments and allocations for losses on certain projects. The rest of the year showed an upward trend and the total profit for building operations in 1994 was NOK 13.0 million (NOK 20.9 million). Turnover was NOK 1,558 million (NOK 1,491 million). Orders-on-hand showed an upward trend throughout the year, both in size and quality. The contracts for a number of the new projects were signed as a result of direct negotiations with the client, and not on the basis of tender competitions. This is a type of contract that is based on the customer’s satisfaction with previous assignments and on mutual trust. At the end of the year, orders-on-hand stood at NOK 1,154 million (NOK 654 million) of which 40 % were contracts awarded without submitting tenders. During the year under review, Veidekke commenced the building of 258 dwellings for its own account. The corresponding figures in 1993 and 1992 were 139 and 33 respectively. This increase in activity reflects the improvement in the market. The dwellings commenced last year were spread over 13 projects, the largest of these involving 48 residential units. Veidekke considers it important to limit the risk on each individual project and also requires a significant proportion of the dwellings to be sold before the project gets off the ground. The dwellings have been selling very well. 229 of the 258 dwellings commenced in 1994 have been sold and at the end of the year the total number of unsold dwellings was 39 (43).
Report of the Board of Directors 8
The figures for Veidekke’s operations in Germany, Veidekke GmbH, are included in the company’s building activities. Veidekke sees an interesting potential in the German market. The German organisation was built up gradually in the course of 1993 and 1994 to enable it to operate as an independent entity in close cooperation with the parent organisation in Norway. Its most important contracts so far have been the building of eight petrol stations for Statoil and a concreting contract in Berlin for German contractors Philipp Holzmann. Veidekke’s German operation showed a loss in 1994, mainly as a result of losses on the contract signed with Philipp Holzmann. Veidekke’s subsidiary Con-Form A/S in Norway has been sold, with effect in the accounts from January 1995. Heavy construction Heavy construction started the year with orders-on-hand totalling NOK 704 million and of these about NOK 200 million were received during the last two months of 1993. Some of these contracts proved later to have been agreed at too low prices. The accounts for the second quarter showed a substantial deficit for heavy construction. Part of the loss is due to allocations made for two projects where Veidekke believes it has carried out considerable extra work over and above the terms of the contract and for which claims have been submitted against the clients that have still not been settled. The disputed claims have not been booked to income. Results for the third and fourth quarters were largely as expected, giving a loss for 1994 of NOK 35 million compared with a profit of NOK 22.2 million the year before. Turnover amounted to NOK 951 million (NOK 860 million). During the year under review, significant changes were made in the organisation of the heavy construction division and a number of developmental measures were initiated. Areas of importance include giving higher priority to tenders and to quality in the tendering process. Attention
ANNUAL REPORT 1994
will be given to making better use of the company’s systems and routines in carrying out and following up projects. The staff and support network has become more operations-orientated and the focus is now on finding ways to improve productivity and to cut costs. This work will be continued in 1995 and will include personnel development at all levels, reinforcement on the purchasing side and better coordination of machine and equipment between heavy construction and building operations. Throughout 1994 the heavy construction market was characterised by surplus capacity, pressure on prices and a large number of competitors bidding for the same contracts. The competitors in this market include a number of minor firms as well as foreign contractors, mainly Swedish, in addition to the three nationwide Norwegian contracting companies. Veidekke considers it important to give priority to earnings rather than volume and is therefore planning to make a ten per cent reduction in turnover in 1995 compared with 1994. Orders-on-hand stood at NOK 577 million at the end of the year, which is slightly less than a year before. International turnover represented about 19 % of the heavy construction division’s total operations. Included here is Veidekke’s share (47.5 %) of the turnover achieved by Noremco. This company, which is engaged in local operations in Tanzania and Zambia, was founded in 1981 and since then has had a total turnover of NOK 1.3 billion and satisfactory earnings. In 1994, however, turnover was less than anticipated because the commencement of two major projects was delayed. This, combined with some losses on completed projects and the establishment of the same principles for allocations as Veidekke uses, resulted in a loss for Noremco last year, of which Veidekke’s share was NOK 7.6 million (NOK +1.4 million). Veidekke’s share of the turnover was NOK 67 million (NOK 78 million).
Report of the Board of Directors 9
The Norwegian Construction Group, Nocon, is still in the process of building up its operations. It has orders-on-hand worth NOK 166 million and a number of projects being processed. Nocon is owned by Veidekke, Selmer and Norwegian Contractors. Along with Selmer and Norconsult International, Veidekke is a member of the Advisory Group of Norway (AGN), which has been engaged as consultants since 1984 to advise on hydropower developments in China. The profitability of these activities is satisfactory. In addition to the activities of these companies, Veidekke was involved in several projects in 1994 in Germany and Sweden. One of these was the conversion work at Kværner’s shipyard at Warnemünde. Asphalt The asphalt market has been relatively stable in recent years, but in 1994 the total volume fell by 6 %. This was mainly due to smaller public grants to the road sector. The Public Roads Administration also carried out a larger share of the contracts itself, thus reducing the market for private contractors by about 10 %.
Norway. Some of the volume produced is used by Veidekke for its own activities, but the bulk is sold to external customers in Norway and abroad. The results for this area of activity showed an upward trend from 1993 to 1994. The availability of top quality raw materials from its own quarries gives Veidekke a valuable competitive edge on other asphalt contractors. The structure of the asphalt industry has remained fairly stable in recent years, with Veidekke/Kolo, Nodest Vei and Icopal (formerly Fjeldhammer Brug) as the three largest private manufacturers and the Public Roads Administration as an extremely important purchaser. The market is weighed down by a substantial surplus capacity and, like the heavy construction sector, there is a large number of small companies competing for the contracts. Prices are generally squeezed. The establishment of a new asphalt company by Franzefoss and Selmer will mean more surplus capacity and competition in the industry, as well as heavier pressure on prices.
Despite this situation, Veidekke and its subsidiary Korsbrekke og Lorck AS (Kolo) achieved better results in 1994 than the year before. This can be explained by a number of factors, the most important being rationalisation in both asphalt production and stone-crushing operations. The relatively mild autumn in many parts of the country also meant that asphalt laying could continue longer than the year before. Gains were also realised on the sale of equipment. All of this combined to give the asphalt division a profit of NOK 35.7 million (NOK 30.5 million). Turnover was NOK 687 million (NOK 720 million).
The prospects for 1995 seem to indicate that the asphalt market as a whole will remain largely the same as, or possibly slightly better, than last year. The grants in the national budget for the upkeep of the national and county roads are on a par with 1994. In addition NOK 200 million has been granted for reinforcement of the national and county road networks, following the abolishment of the restrictions on axle loads during the spring thaw period. The general upswing in the Norwegian economy and improvement in market conditions for many industries would indicate that there is a possibility of some growth in both the municipal and the private asphalt markets. The possible effect of the Gardermo airport development will not be felt until 1996.
Veidekke’s crushed stone and gravel operations are also part of the asphalt division. With a production volume of 2.5 million tons, Veidekke and Kolo are one of the largest stone-crushing operations in
Property The property owned by Veidekke’s Property Division totalled 89,139 sq.m. at the end of the year. Of this, 24 % is reserved for the company’s own use and the
ANNUAL REPORT 1994
Report of the Board of Directors 10
remainder is let. At the end of the year the occupancy rate was 96 %, measured in rental value. Total rental income was NOK 50.7 million (NOK 47 million). The profit for this division was NOK 2.6 million (NOK 4.3 million), after a net loss on sales of property of NOK 1.1 million, while the year before showed a gain of NOK 8 million.
whom 902 (888) were paid a monthly salary and 1,883 (1,806) were paid by the hour. Even within the framework of a relatively stable employment situation, there will always be a need to recruit new employees for vacancies arising due to natural retirement. It is gratifying to note that there has generally been a great deal of interest in the jobs advertised.
Three major projects were completed during 1994. Two have been let and one was sold. In addition to these, six properties were sold, bringing total net investments to NOK 49 million. The book value of the division’s property portfolio is NOK 461 million.
Throughout 1994, priority was given to organisational development and training at all levels in the company. Veidekke’s training department, which offers courses in a number of fields, was busier than ever before and a considerable amount of work was put into leadership development and teambuilding. Contact with colleges and universities is maintained through company presentations and grant schemes, etc. The recruitment of skilled workers is another vital area and Veidekke kept up a high intake of apprentices throughout the recession in the industry. The number of apprentices in Veidekke’s employment at the end of 1994 was 92 (104).
The market for rented business premises is still characterised by the surplus capacity and pressure on prices. This situation is expected to last for several years. Tenant mobility is good, however, and there is a constant demand for functional premises in the right location. Tenants are also interested in low operating costs and a higher degree of service on the part of the owner. The larger property management companies with a wide network of contacts and a professional service organisation will therefore have a competitive advantage in the bid for tenants. Veidekke wishes to be actively involved in the development, operation and management of property. Alongside traditional building activities, the company has the necessary experience and skills to take responsibility for every stage of a building project, from the “raw” site to the operation and management of the finished product. Some projects will be developed by Veidekke alone and some under joint ownership. Veidekke, however, is not interested in substantially increasing the capital it has tied up in property. Completed projects are therefore always evaluated for sale, but with Veidekke as manager where this is desirable. Organisation and personnel At the end of the year, Veidekke’s employees numbered 2,785 (2,694), of
ANNUAL REPORT 1994
Veidekke emphasises the importance of open, constructive relations with the elected representatives for its hourly and monthly-paid employees. This relationship was positive in 1994, as it has been previously, both in formal fora and in less formal discussions and ongoing contact. Health, environment and safety The building and construction industry is a high risk industry as concerns stress injuries and accidents at work. Veidekke therefore attaches great importance to preventing injuries and absence from work. The company sees health, environment and safety work as a managerial responsibility and a number of courses have been held on these subjects. Absence among hourly-paid employees averaged 4.6 % in 1994 (5.2 %). Direct costs to the company relating to absence for all employees was NOK 7.1 million (NOK 7.4 million). The injury rate per million working hours was 18.7 (16.1). The increase compared
Reports of the Boards of Directors 11
with the year before is due to an unacceptably high figure for the first quarter. During the rest of the year, the number of injuries was lower than the year before. Veidekke has a good record by the standards for the industry, but is determined to reduce the number of injuries and days of absence even more. As for the outdoor environment, asphalt, crushed stone and gravel operations are governed by special regulations issued by the State Pollution Control Authority and municipal bodies. Veidekke attaches importance to meeting these requirements and works actively to achieve further improvements. Constant attention is given to the effects of the company’s other activities on the environment. Financial standing Group investment in machines and equipment amounted to NOK 87 million in 1994 (NOK 68 million) and an additional NOK 73 million was invested in buildings and land. Investments in property were mainly financed by normal mortgage loans. The Group’s total assets were NOK 1,923 million at the end of the year (NOK 1,910 million). The equity ratio was 28.7 %. In 1993 it was 31.5 %, while in 1994 equity capital was affected by the new accounting standard for pension commitments. The downward adjustment compared to previous calculation principles corresponds to 2.3 percentage points. Liquid assets stood at NOK 372 million at the end of the year (NOK 367 million). Unused withdrawal facilities amounted to NOK 350 million (NOK 312 million) of a total credit limit of NOK 430 million (NOK 382 million). Veidekke made active use of the shortterm bonds market for cash management purposes during 1994 and obtained competitive interest rates. Eight short-term bonds were issued for a total of NOK 420
ANNUAL REPORT 1994
million. At the end of the year, one shortterm bond loan was outstanding for NOK 50 million. Shareholders Veidekke had 1,998 shareholders as at 31 December (1,907). No single shareholder had more than ten per cent of the shares. Folketrygdfondet (the National Insurance Fund) increased its shareholding from 6.1 to 8.8 %, while UNI Storebrand reduced its share from 9.2 to 6.5 %. There were no other changes of any significance among the company’s major shareholders. Veidekke emphasises the importance of a broad, active involvement on the part of its employees and therefore aims to offer shares for sale to its employees every year. In November, the company’s employees were offered the chance to purchase shares at a price that was 20 % below market price. This offer proved to be very popular, and altogether 389 employees, of whom 157 were new shareholders, purchased just over 51,000 shares. This means that 854 employees are now shareholders in the company and between them they hold 9 % of the shares. A total of 2.7 million Veidekke shares were traded on the Oslo Stock Exchange in 1994 (3.2 million). The price of Veidekke shares rose steeply at the beginning of the year, reaching an all-time record in February at NOK 236, before falling again to a lower level. At the end of the year, the price was NOK 116.50 (NOK 170) and 20 % (25 %) of the shares were held by foreign investors. Prospects In view of the general outlook for the Norwegian economy, continued growth is expected in the building and construction industry in 1995, with the possibility of a further increase in the commencement of new dwellings and commercial buildings. For the first time for many years, the manufacturing industry is planning to increase its investments. Greater activity can be expected in heavy construction as a result of the major work needed for the
Report of the Board of Directors 12
new airport. This applies to both direct airport investment and investment in roads and railways and the relocation of the military installations. As regards tunnelling work, however, there will still be a great deal of surplus capacity in the market and subsequently heavy pressure on prices. Greater activity in both building and heavy construction will offer the possibility of better results in the divisions which perform the contracts. There may be a tendency towards cost pressure in some central parts of Eastern Norway, and it will be important to keep a close eye on these costs. Veidekke’s most important task in 1995 will be to return the company to a satisfactory profit level. The losses in heavy construction must be reversed and ear-
nings in the other areas of activity must be improved. This, combined with the steps that have been taken to strengthen the organisation, should provide a good basis from which to attain the goals that have been set. Allocation of A/S Veidekke’s profit for the year A/S Veidekke’s profit after tax is NOK 6.2 million. The Board of Directors will propose to the General Meeting on 27 April this year that this be allocated as follows: Group contribution Dividend Legal reserve Restricted revenue reserve Distributable reserve
NOK 4.5 million NOK 11.2 " NOK 2.1 " NOK -9.5 NOK -2.1
Total
NOK
" "
6.2 million
Billingstad, 27 February 1995
Christian Bruusgaard Chairman of the Board
Flemming Vejgaard Andersen
Arve Johnsen
Sigmund Kjos
Helge B. Andresen
Steinar Krogstad
Karsten Houm
Kåre Strand
Terje R. Venold President and C.E.O.
ANNUAL REPORT 1994
Profit and loss account 13
GROUP
(Figures in NOK million)
PROFIT AND LOSS ACCOUNT
1994
1993
1992
3,161.5 - 862.2 - 748.6 - 1,166.7 - 277.5 - 95.3 - 3.4
3,137.0 - 793.2 - 775.1 - 1,206.0 - 188.1 - 110.5 - 0.2
3,664.5 - 994.6 - 872.6 - 1,303.1 - 289.8 - 106.3 - 4.4
Total operating costs
- 3,153.7
- 3,073.1
- 3,570.8
OPERATING PROFIT
7.8
63.9
93.7
- 6.9 10.2 - 5.9
- 3.4 9.2 5.5
- 8.6 - 5.7 1.8
5.2
75.2
81.2
- 6.0 - 6.1
- 20.5 - 6.4
- 26.3 - 7.4
- 6.9
48.3
47.5
- 1.25
8.84
8.70
TURNOVER Cost of materials Wages and social costs Subcontractors Other operating expenses Depreciation Bad debts
Financial income/expenses Share of profit/loss - ships Share of profit/loss - associated companies
NOTE 1,21 15
11
2 10 8
PROFIT BEFORE TAXATION Taxation Minority interests' share PROFIT/LOSS FOR THE YEAR Earnings per share (NOK)
ANNUAL REPORT 1994
16 17
Balance sheet 14
GROUP
(Figures in NOK million)
ASSETS at 31 December Liquid assets Debtors Other short-term receivables Stocks Development projects for sale
NOTE
1994
1993
3 4 5
371.6 410.4 72.6 44.7 110.9
366.5 343.9 83.6 55.7 99.4
1,010.2
949.1
23.3 99.4 6.1 16.8 228.2 402.7 136.0
37.8 121.8 57.2 17.1 226.6 363.3 136.6
912.5
960.4
1,922.7
1,909.5
NOTE
1994
1993
12
102.4 411.3 162.9 260.1
54.8 411.6 142.1 214.0
936.7
822.5
386.9 46.8
368.3 117.9
433.7
486.2
6
TOTAL CURRENT ASSETS Shares in associated companies Long-term receivables etc. Share in limited partnerships - ships Goodwill Machinery etc. Buildings Land
8 9, 15, 16 10 11 11 11 11
TOTAL FIXED ASSETS TOTAL ASSETS
LIABILITIES AND SHAREHOLDERS' EQUITY at 31 December Interest-bearing debts Creditors VAT, withheld tax, social security, etc. Other short-term debts
13
TOTAL CURRENT LIABILITIES Long-term liabilities Deferred taxes
14, 15 16
TOTAL LONG-TERM LIABILITIES MINORITY INTERESTS
17
50.1
47.3
Share capital Other shareholders' equity
18
56.2 446.0
56.2 497.3
TOTAL SHAREHOLDERS' EQUITY
19
502.2
553.5
1,922.7
1,909.5
283.7 142.4
222.6 160.7
TOTAL LIABILITIES AND SHAREHOLDERS' EQUITY Secured liabilities Guarantees
ANNUAL REPORT 1994
20 20
Statement of cash flows 15
GROUP
(Figures in NOK million)
1994
1993
5.2 95.3 14.0 58.8 5.9 10.2 56.0
75.2 110.5 - 25.2 - 13.6 - 5.5 - 9.2 103.5
68.3
- 154.2
35.7
81.5
- 167.1 45.7 34.8
- 129.5 56.6 - 3.2
Net cash from investment activities (B)
- 86.6
- 76.1
CASH FLOWS FROM FINANCING ACTIVITIES New long-term borrowing Repayment long-term debts Change in short-term borrowing Change in shareholders' equity Sale of own shares Dividend paid
89.0 - 66.4 38.7 - 0.8 12.7 - 17.2
27.8 - 24.3 28.3 - 0.8 0.0 - 28.4
Net cash from financing activities (C)
56.0
2.6
Net increase in liquid assets (A+B+C)
5.1
8.0
366.5 371.6
358.5 366.5
CASH FLOWS FROM OPERATING ACTIVITIES Profit before taxation Depreciation Gain/loss on sale of fixed assets Tax payable Share of profit/loss associated companies Share of profit/loss limited partnerships - ships Net change in receivables, stocks, development projects for sale Net change in current liabilities excluding short-term borrowing and dividends Net cash from operating activities (A) CASH FLOWS FROM INVESTMENT ACTIVITIES Purchase of property, plant and equipment Proceeds from sale of property, plant and equipment Net change in other investments
Liquid assets at 1 January Liquid assets at 31 December
ANNUAL REPORT 1994
-
Accounting policies 16
CONSOLIDATION Subsidiaries Subsidiaries are companies in which Veidekke has a direct or indirect majority of the votes. The subsidiaries’ profit and loss accounts and balance sheets are included in their entirety in the Consolidated Accounts. The minority interests’ share of the profit for the year (after taxation) and shareholders’ equity are shown as separate items in the accounts. Shares purchased in subsidiaries are dealt with according to the purchase value method of accounting, by which the cost price of the shares is set off against the book value of the shareholders’ equity in the subsidiary at the time of purchase. Any added or reduced value is shared among the assets to which it relates. Non-assignable added value is entered as goodwill. Added value and goodwill are depreciated via the profit and loss account. Associated companies Associated companies are companies in which the Group owns long-term, strategic interests of between 20 and 50 % and where these interests allow the Group considerable influence on operating and financial decisions. In the Consolidated Accounts these companies are included according to the equity method. The equity method means that the share of the profit or loss before taxation, with an adjustment for depreciation of any added or reduced value (including goodwill) at the time of purchase, is included on a separate line in the Profit and Loss Account. In the Balance Sheet, this share is entered at cost price, adjusted in relation to the share of the profit or loss, dividend and adjustments of shareholders’ equity subsequent to the time of purchase.
ANNUAL REPORT 1994
Joint Ventures, Partnerships and Limited Partnerships Veidekke is involved with other contractors in a number of major contracts. The participants in these joint ventures are jointly and severally responsible to the clients. In the fields of property management and asphalt, Veidekke participates in several partnerships and limited partnerships. Since participation is within Veidekke’s main business areas and control is exercised jointly, these shares are entered in the accounts according to the gross method (proportional consolidation), whereby the share is integrated in each item in the Profit and Loss Account and Balance Sheet. Limited partnerships - ships Veidekke is also a partner in limited partnerships which own ships. These partnerships are integrated in the accounts by the equity method. The share of profit or loss is shown as a separate item after financial items in the Profit and Loss Account and in the Balance Sheet these shares are classified as fixed assets. Deferred tax and tax payable relating to the shares is treated as part of the year’s taxation and deferred tax and tax payable in the Balance Sheet. Conversion of foreign companies Balance sheet items relating to foreign companies are converted at the exchange rate applying on the date of the Balance Sheet, while Profit and Loss Account items are converted at average exchange rates for the year. The conversion differences for foreign subsidiaries are entered against the Group’s shareholders’ equity, while the conversion differences for foreign partnerships and joint ventures are entered in the Profit and Loss Account. Inter-company transactions Receivables and payables between
Accounting policies 17
parent company and subsidiaries have been eliminated. The same applies to receivables and payables relating to joint ventures, partnerships and limited partnerships. Inter-company turnover and inter-company gains have also been eliminated. Mergers The Group uses the continuity method to integrate companies. By this method, the integrated company’s assets and liabilities are carried forward at book value. Shareholders’ equity is altered by the integrated company’s shareholders’ equity, less the cost price of shares that the Group held prior to the merger. Own shares The Group holds some of its own shares, acquired through takeovers. The cost price is entered as a reduction of shareholders’ equity. Any gain or loss on sales is booked directly against shareholders’ equity. RECORDING INCOME Projects Veidekke operates mainly as contractors on projects which last from a few months to two or three years. Invoicing is done monthly (payment net 30 days) and usually as the contract activity progresses. However, other payment plans are sometimes used.
sions are made for guarantee work and other uncertainties. The guarantee period varies from one to three years. Disputed claims are entered as income once they have been settled or the outcome is certain. Development projects for sale Development projects for sale are mainly concerned with house-building. These projects are taken to income as the units are completed and handed over to the purchasers. Costs incurred on units in progress and development sites are entered in the Balance Sheet under current assets. The units are valued at production cost or estimated net sales value, whichever is the lower. “Production cost” includes all assignable project costs. Prudence is shown in the initial phases in taking the projects to income. Development projects for Veidekke’s ownership Development projects for letting or own use are taken to income as capital assets at production cost including interest paid during the building period. Development projects for Veidekke’s ownership are entered as turnover. Sales of fixed assets Gains on sales of machinery, buildings and other fixed assets are entered as turnover. OTHER ACCOUNTING POLICIES
For projects, income is entered as the work progresses and in proportion to the percentage of completion. This means that the accumulated proportion of the estimated profit on the project is taken to income. The percentage of completion is determined on the basis of completed production. In the case of projects that are expected to show a loss, the estimated loss is entered in its entirety as a cost. Provi-
ANNUAL REPORT 1994
Pensions In 1994 Veidekke introduced the new accounting standard for pension expenses. According to this standard, Veidekke’s pension schemes must be treated as benefit plans. This means that the company is actually responsible for the fulfilment of pension commitments even though these are covered by an insurance scheme. For this reason, the present value of all accumulated pen-
Accounting policies 18
sion commitments has to be calculated (annual actuarial calculation). The calculation takes into account anticipated wage growth, based on linear accumulation. “Pension funds” consist of the premium fund and the company’s share of the insurance company’s funds (premium reserves) and are entered at their real value (transfer value). Net pension commitments/pensions funds are entered in the Balance Sheet. “Pension expenses” are the present value of the year’s pension earnings plus interest on pension commitments less return on the pension funds. A long-term interest rate is applied when calculating pension commitments and the return for the year on the funds. Estimated values are used for pension funds and pension commitments when the accounts are closed. The estimated figures are then corrected each year by the actual figures. The difference between the estimated and real figures is entered in the Balance Sheet. These differences have to be amortised (entered in the Profit and Loss Account) in accordance with specified rules. Deviations arising from changes in the financial assumptions and changes in pension plans are dealt with in the same way. Taxes This year’s tax expense consists of payable tax and change in deferred tax. Payable tax is fixed on the basis of the year’s taxable profit, which is payable the following year. Deferred tax is a provision for future payable tax, calculated on timing differences between the financial accounts and the tax accounts. The reason why timing differences arise is that some of the items in the Profit and Loss Account are treated differently for accounting purposes and for tax purposes, because certain tax-related allocations are allowed while some financial related allocations are not tax deductible. Deferred tax is calculated in nominal amounts, i.e. with no discount.
ANNUAL REPORT 1994
There are moreover strict criteria for the entering of deferred tax benefits in the financial accounts. Depreciation Depreciation is based on the financial lifetime of the fixed assets. Research and development costs Costs relating to research and development of technology are charged to expenses. Receivables and debts Receivables and debts that relate to production are classified as current assets and short-term liabilities. Other receivables and debts which are not due for more than a year are classified as fixed assets and long-term liabilities. Receivables are entered in the Balance Sheet at their nominal value less provision for bad debts. Current assets and short-term liabilities in foreign currency are converted at the exchange rate on the date of the Balance Sheet. Long-term receivables in foreign currency are entered at the rate of exchange on the date of the Balance Sheet or on the date of acquisition, whichever is lower. Long-term liabilities in foreign currency are entered at the rate of exchange on the date of the Balance Sheet or on the date of acquisition, whichever is higher. Stocks Stocks include raw materials, materials and tools and are assessed at full cost price or net realisable value, whichever is lower. Shares Financial investments are classified as current assets, while strategic investments are classified as fixed assets. Short-term shareholdings are assessed on the portfolio principle.
Notes to the accounts 19
GROUP 1.
(Figures in NOK million)
TURNOVER Turnover includes gains on sales of machinery etc. amounting to NOK 15.4 million (17.2) and loss on sales of buildings/land amounting to NOK 1.4 million (+8.0).
2.
3.
4.
FINANCIAL INCOME/FINANCIAL EXPENSES 1994
1993
Gains on sales of securities Interest received Other financial income
0.0 36.5 2.6
2.6 40.0 3.9
Financial income
39.1
46.5
Interest charges, long-term loans Interest charges, short-term loans Other financial expenses
- 30.2 - 11.5 - 4.3
- 40.6 - 7.3 - 2.0
Financial expenses
- 46.0
- 49.9
Net financial items
- 6.9
- 3.4
1994
1993
Bank deposits Withheld tax on salaries and wages Securities Shares
316.3 28.6 20.4 6.3
289.3 24.4 46.6 6.2
Liquid assets
371.6
366.5
LIQUID ASSETS
DEBTORS "Debtors" include provisions for bad debts amounting to NOK 21.7 million (22.1)
5.
OTHER SHORT-TERM RECEIVABLES "Other short-term receivables" include NOK 45.0 million (66.2) due from debtors.
ANNUAL REPORT 1994
Notes to the accounts 20
6.
DEVELOPMENT PROJECTS FOR SALE 1994
1993
96.1 14.8
83.1 16.3
110.9
99.4
Total share Ownership capital share in %
Nominal value
Book value
60 50 100 100 100 100 100 100 100 100 90 90 100 100
3.0 0.0 SEK 5.0 5.0 3.6 DEM 0.5 1.2 2.0 0.2 0.9 ISK 9.0 0.2 0.1 0.1
16.9 9.5 5.2 5.1 3.1 2.2 2.1 2.1 1.5 1.2 0.9 0.1 0.1 0.0
Ongoing projects Undeveloped sites Development projects for sale Veidekke also has sites for development under fixed asssets (Note 11).
7.
SHARES IN SUBSIDIARIES
Korsbrekke og Lorck AS Hokksund Pukkverk A/S Veidekke AB Veidekke Eiendom A/S Nor-Vei A/S Veidekke GmbH Con-Form A/S Con-Form Polen Invest A/S Ottersbo Pukkverk A/S Prosjektutvikling Bergen A/S Krafttak HF Beitostølen Eiendomsutvikling A/S Napastaa Entreprenør A/S Sogndal Postgård A/S
5.0 0.1 SEK 5.0 5.0 3.6 DEM 0.5 1.2 2.0 0.2 0.9 ISK 10.0 0.2 0.1 0.1
50.0
Owned by A/S Veidekke Oslo Asfalt A/S Hokksund Pukkverk A/S Con-Form Trøndelag A/S Con-Form Ltd. Owned through subsidiaries
ANNUAL REPORT 1994
41.0 0.1 0.2 PZL 950.0
100 50 100 100
41.0 0.0 0.2 PZL 950.0
16.8 2.5 0.8 0.5 20.6
Notes to the accounts 21
8.
SHARES IN ASSOCIATED COMPANIES OwnerTotal share ship share in % capital Noremco Construction A/S A/S Kongsvinger Asfalt A/S Fosskvartalet Other associated companies
5.0 2.0 0.1
48 50 50
2.4 1.0 0.1
Owned by A/S Veidekke Martin Haraldstad A/S Other associated companies
0.1
50
0.1
Owned by group
9.
Value in Group
Result for the year
3.4 1.0 0.0 5.1
7.5 6.7 1.3 4.9
- 7.6 0.8 0.8 0.1
9.5
20.4
- 5.9
2.0 1.5
1.4 1.5
0.0 0.0
13.0
23.3
- 5.9
Nominal Value in value company
LONG-TERM RECEIVABLES ETC. 1994
1993
Loans to partners Loans to associated companies Loans to employees Credit granted for sale of property Deferred tax benefit Net pension funds Miscellaneous shares Other long-term receivables
26.9 22.4 13.2 11.3 11.2 3.0 2.7 8.7
8.1 15.2 3.7 10.5 10.4 59.5 2.8 11.6
Long-term receivables and shares
99.4
121.8
Net pension funds have been reduced by NOK 56.9 million as a result of the new accounting standard for pension expenses (the 1993 figures refer to the premium fund).
10.
SHARES IN LIMITED PARTNERSHIPS - SHIPS OwnerCapital Capital ship Contrib. not to be Share of share in % capital called up called up assets
K/S Fosna K/S JLM Tank 1 K/S Essi Gina
11.5 40.0 16.6
Total
ANNUAL REPORT 1994
11.9 0.7 0.4
Share of liabilities
Book Share of Gain value profit on sales
Total profit
0.0 55.2 0.5
0.0 0.0 0.0
37.6 0.7 1.3
33.0 0.0 0.5
4.6 0.7 0.8
0.1 2.2 0.0
7.9 -
0.1 10.1 0.0
55.7
0.0
39.6
33.5
6.1
2.3
7.9
10.2
Notes to the accounts 22
11.
FIXED ASSETS Cost 1 Jan.
Additions
Disposals
Accum. depreciation
Book value 31 Dec.
Deprec. for year
Depreciation in %
35.3 898.6 446.6 136.6
7.1 86.6 69.6 3.8
8.5 66.2 21.3 4.4
17.1 690.8 92.2 0.0
16.8 228.2 402.7 136.0
7.4 76.2 11.7 0.0
20 15-25 2-5 -
1,517.1
167.1
100.4
800.1
783.7
95.3
Goodwill Machinery etc. Buildings Land Total
“Land” includes development properties with a book value at 31 December of NOK 82.0 million (74.2). Investments in and sale (sales price) of fixed assets during the past five years for the Group: 1994 Investm.
12.
Sale Investm.
7.1 86.6 69.6 3.8
24.2 17.8 3.7
167.1
45.7
Goodwill Machinery etc. Buildings Land Total
1993
3.9 68.1 23.8 33.7
Sale Investm.
1991 Sale Investm.
1990 Sale Investm.
Sale
25.6 18.4 12.6
6.9 101.5 26.1 23.2 129.8 5.4 22.5
31.4 109.7 114.5 58.5
20.4 40.8 13.1
20.2 59.6 63.3 13.3
7.2 5.7 0.5
129.5 56.6
137.0 178.4
314.1
74.3
156.4
13.4
INTEREST-BEARING SHORT-TERM LIABILITIES
Withdrawal rights Project financing Next year's instalments, long-term liabilities Other short-term liabilities Interests-bearing short-term liabilities
13.
1992
1994
1993
3.0 82.8 16.6 0.0
7.3 39.5 7.7 0.3
102.4
54.8
OTHER SHORT-TERM DEBTS Tax payable amounts to NOK 63.1 million (19.7). Dividends payable amount to NOK 15.1 million (17.2).
ANNUAL REPORT 1994
Notes to the accounts 23
14.
LONG TERM LIABILITIES Book value 31 Dec. 93
Repaid New loans Book value 1994 1994 31 Dec. 94
Loans secured in buildings/land Other loans Of which next year's instalments *
213.6 124.4 - 7.7
18.4 44.5
88.5 0.5
283.7 80.4 - 16.6
Total
330.3
62.9
89.0
347.5
Net pension commitments Long-term liabilities
38.0
39.4
368.3
386.9
1995
1996
1997
1998
1999
After 1999
Loans secured in buildings/land Other loans
12.5 4.1
10.8 4.3
16.1 4.3
15.7 2.4
10.4 2.4
218.2 62.9
Total
16.6
15.1
20.4
18.1
12.8
281.1
Repayment structure
* Instalments payable in 1995 are entered as short-term liabilities. 79 % of Veidekke’s loan portfolio is due for interest-rate adjustment in 1995. At 31 December 1994, the average interest rate was 7.3 %. The Group has unused withdrawal rights amounting to NOK 350 million (312), of which NOK 192 million (202) derive from long-term loan agreements.
15.
PENSIONS Veidekke has a collective pension scheme for its employees that is covered by an agreement with an insurance company. Veidekke also has unsecured pension commitments paid directly out of operations. As a result of the introduction of the new accounting standard for pension expenses, net pension commitments rose by NOK 61.8 million. Of this amount, NOK 44.5 million has been booked directly against shareholders’ equity and minority interests, while NOK 17.3 million has been booked against deferred tax. The figures for previous years have not been adjusted.
ANNUAL REPORT 1994
Notes to the accounts 24
15.
PENSIONS, cont. A/S Veidekke Secured Unsecured Pension expenses Earned during year (present value) Interest on commitments Return on funds Change over-financing Pension expenses Entered in Balance Sheet at 31 December Pensions funds Pension commitments (present value) Net funds/commitments Over-financing not entered Net funds/commitments entered in Balance Sheet
Kolo * Secured
Group Group Total 1 Jan. 1994
10.4 12.3 - 13.4
0.4 1.6
0.1 1.0 - 2.5 1.1
10.9 14.9 - 15.9 1.1
9.3
2.0
- 0.3
11.0
182.2 - 195.9
- 25.7
33.4 - 12.9
215.6 - 234.5
197.2 - 221.1
- 13.7
- 25.7
20.5 - 17.4
- 18.9 - 17.4
- 23.9 - 16.3
- 13.7
- 25.7
3.1
- 36.3
- 40.2
* Korsbrekke og Lorck AS NOK 3.1 million is shown under long-term receivables etc., while NOK -39.4 million is shown as a long-term liability. Pension commitments and the amount earned during the year include employer’s contributions. Financial assumptions Return on pension funds Discount rate Annual wage growth Annual basic pension rate adjustment Annual adjustment of pensions being paid
16.
8.0 % 7.0 % 3.3 % 3.3 % 2.5 %
TAX TAXATION
1994
1993
Tax payable Change in deferred tax
58.8 - 52.8
13.6 6.9
6.0
20.5
Taxation
ANNUAL REPORT 1994
Notes to the accounts 25
16.
TAX, cont. DEFERRED TAX
1994
1993
Timing differences: Short-term items Pension premium reserve Accelerated depreciation Limited partnerships - ships Gain and loss account Other long-term items Basis deferred tax
40.5 3.1 45.2 99.3 - 21.0 167.1
103.7 59.5 48.5 89.4 124.4 - 4.1 421.4
Deferred tax (28 %)
46.8
117.9
Deferred tax benefit *
11.2
10.4
MINORITY INTERESTS
1994
1993
Minority interests 1 January Minority share of profit for year Dividends Introduction of new accounting standard for pension expenses Sales of own shares Additions/disposals Minority interests 31 December
47.3 6.2 - 4.0 - 3.7 5.1 - 0.8 50.1
50.8 6.4 - 10.1 0.0 0.0 0.2 47.3
MINORITY SHARE OF PROFIT AND LOSS ACCOUNT ITEMS
1994
1993
Turnover Operating expenses
74.4 - 67.4
80.3 - 75.3
Operating profit
7.0
5.0
Net financial items
1.3
3.4
Profit before taxation
8.3
8.4
- 2.2
- 2.0
6.1
6.4
* Calculated on pension commitments of NOK 40.0 million (37.1).
17.
Taxation Minority share of profit for year
The minority interests derive primarily from Korsbrekke og Lorck AS, of which Veidekke owns 60 %.
ANNUAL REPORT 1994
Notes to the accounts 26
18.
SHARE CAPITAL A/S Veidekke’s share capital at 31 December consists of 5,622,830 shares of NOK 10.- each. The Group owns 80,328 shares in A/S Veidekke through Korsbrekke og Lorck AS. These shares were acquired before the Group was formed. The average number of outstanding shares in 1994 was 5,509,169 (5,462,502). GROWTH IN SHARE CAPITAL AFTER STOCK EXCHANGE LISTING
Form of issue 1986 1986 1988 1989 1989 1990 1990 1991 1991
Issue, price 57.50 Issue employees, price 51.75 Bonus issue 1:5 Merger Hesselberg Vei Dividend shares Merger Folke A. Axelson A/S Dividend shares Merger Stoltz-Røthing Haugesund A/S Merger Aker Entreprenør A.S
No. of shares Share capital Amount after increase after paid (1,000) increase 25.3 3.1
0.5 0.6
3,053 3,113 3,736 4,693 4,746 4,802 4,861 4,912 5,623
30.5 31.1 37.4 46.9 47.5 48.0 48.6 49.1 56.2
Adjustment factor
0.833 0.998 0.999
The adjustment factor has been calculated according to the standards of the Norwegian Financial Analysts’ Association. At 31 December, the President and C.E.O. and the below mentioned Board members held shares in A/S Veidekke as follows: No. of shares Christian Bruusgaard, Chairman of the Board Flemming Vejgaard Andersen, Member of the Board Helge B. Andresen, Member of the Board Kåre Strand, Member of the Board Terje R. Venold, President and C.E.O.
5,018 275 4,754 1,494 11,200 22,741
19.
SHAREHOLDERS' EQUITY 1994
1993
Shareholders' equity 1 January Profit for the year Dividends Introduction of new accounting standard for pension expenses Sales of own shares Currency adjustment
553.5 - 6.9 - 11.2 - 40.8 7.6 0.0
521.1 48.3 - 15.1 0.0 0.0 - 0.8
Shareholders' equity 31 December
502.2
553.5
Own shares are included in other equity at NOK - 0.4 million (- 0,7).
ANNUAL REPORT 1994
Notes to the accounts 27
20.
GUARANTEES AND JOINT AND SEVERAL LIABILITY
Book liabilities secured by mortgages etc. Book value of mortgaged buildings Book value of mortgaged land
1994
1993
283.7 325.4 32.8
222.6 277.9 22.3
1994
1993
7.9 48.5 30.3 55.7
10.5 39.9 30.6 79.7
142.4
160.7
Guarantees to employees Guarantees to associated companies Other guarantees Committed limited partnership capital not expected to be called up Guarantees The Group has issued conditional mortgage declarations for loans and guarantees.
A/S Veidekke has furnished guarantees to subsidiaries for a total of NOK 156.2 million (67.5). Of this, NOK 131.4 million (50.2) is joint and several liability for subsidiaries’ withdrawal in the Group account system with the banks. These guarantees have been eliminated in the consolidated accounts. As a result of its participation in partnerships and joint ventures, Veidekke could become liable for other participants’ inability to fulfil their obligations. Veidekke, however, cannot be called on to account until the company in question actually fails to fulfil its obligations.
21.
ORDERS - ON - HAND Orders-on-hand at 31 Dec. 94
For delivery Orders-on-hand in 1995 at 31 Dec. 93
For delivery in 1994
Building Heavy Construction
1,154 577
1,085 450
654 704
622 364
Total orders-on-hand
1,731
1,535
1,358
986
The remaining turnover on non-profitable projects is NOK 75 million (247). Provision has been made in the accounts for the anticipated losses on these projects. The accumulated income for ongoing projects is NOK 1,169 million (1,054). Contributions of NOK -13 million (54) have been taken to income.
ANNUAL REPORT 1994
Profit and loss account 28
A/S VEIDEKKE PROFIT AND LOSS ACCOUNT
(Figures in NOK million)
NOTE
1994
1993
2,713.4 - 735.5 - 681.3 - 992.0 - 241.4 - 65.3 - 3.0
2,791.2 - 687.3 - 697.4 - 1,110.7 - 158.0 - 77.6 8.3
Total operating costs
- 2,718.5
- 2,722.7
OPERATING PROFIT
- 5.1
68.5
45.7 - 40.4 10.3
67.9 - 36.1 9.2
10.5
109.5
- 49.3 45.0
- 3.1 4.6
6.2
111.0
4.5 11.2 2.1 - 9.5 - 2.1
37.1 15.5 18.7 - 9.5 49.2
6.2
111.0
TURNOVER Cost of materials Salaries and social costs Subcontractors Other operating expenses Depreciation Bad debts
Financial income Financial expenses Share profit/loss ships PROFIT BEFORE TAXATION Tax payable Change deferred tax PROFIT FOR THE YEAR Transfers: Group contribution Dividend Legal reserve Restricted revenue reserve Distributable reserve TOTAL TRANSFERS
ANNUAL REPORT 1994
A B H
C C
Balance sheet 29
A/S VEIDEKKE ASSETS at 31 December
(Figures in NOK million)
NOTE
1994
1993
D E
318.2 310.6 40.0 58.1 40.0 107.0
304.7 294.5 25.6 80.4 48.9 93.8
873.9
847.9
50.0 9.5 91.1 60.3 5.3 0.8 161.6 182.1 99.5
44.9 17.6 99.7 54.2 56.2 2.6 165.4 190.2 102.5
660.2
733.3
1,534.1
1,581.2
NOTE
1994
1993
I
92.2 373.3 143.5 6.3 220.4
43.5 376.1 132.5 35.3 182.9
835.7
770.3
243.8 35.2
253.5 93.1
LONG-TERM LIABILITIES
279.0
346.6
Share capital (5,622,830 shares at NOK 10 each) Legal reserve Restricted revenue reserve Distributable reserve
56.2 43.6 19.1 300.5
56.2 41.5 28.7 337.9
419.4
464.3
1,534.1
1,581.2
134.8 298.6
123.4 228.2
Liquid assets Debtors Short-term receivables, group companies Other short-term receivables Stocks Development projects for sale
F
TOTAL CURRENT ASSETS Shares in subsidiaries Shares in associated companies Long-term receivables etc. Long-term receivables, group companies Share in limited partnerships - ships Goodwill Machinery etc. Buildings Land
7 8 G 10 H H H H
TOTAL FIXED ASSETS TOTAL ASSETS
LIABILITIES AND SHAREHOLDERS' EQUITY at 31 December Interest-bearing debts Creditors VAT, withheld tax, social security etc. Short-term debt, group companies Other short-term debts TOTAL CURRENT LIABILITIES Long-term liabilities Deferred tax
TOTAL SHAREHOLDERS' EQUITY
J
K
TOTAL LIABILITIES AND SHAREHOLDERS' EQUITY Secured liabilities Guarantees
ANNUAL REPORT 1994
L 20
Statement of cash flows 30
A/S VEIDEKKE
(Figures in NOK million)
1994
1993
10.5 65.3 13.1 49.3 10.3 12.5
109.5 77.6 - 25.2 - 3.1 - 9.2 153.4
53.6
- 243.5
44.2
59.5
CASH FLOWS FROM INVESTMENT ACTIVITIES Purchase of property, plant and equipment Proceeds from sale of property, plant and equipment Net change in other investments
- 75.2 39.7 24.2
- 89.9 55.7 7.8
Net cash from investment activities (B)
- 11.3
- 26.4
CASH FLOWS FROM FINANCING ACTIVITIES New long-term borrowing Repayments long-term debts Change in short-term borrowing Group contribution paid Dividend paid
1.0 - 15.0 47.2 - 37.1 - 15.5
24.2 - 16.2 7.7 - 23.5 - 12.7
Net cash from financing activities (C)
- 19.4
- 20.5
Net increase in liquid assets (A+B+C)
13.5
12.6
304.7 318.2
292.1 304.7
CASH FLOWS FROM OPERATING ACTIVITIES Profit before taxation Depreciation Gain/loss on sale of fixed assets Tax payable Share of profit/loss limited partnerships - ships Net change in receivables, stocks, development projects for sale Net change in current liabilities excluding short-term borrowing and dividends Net cash from operating activities (A)
Liquid assets at 1 January Liquid assets at 31 December
ANNUAL REPORT 1994
-
Notes to the accounts 31
A/S VEIDEKKE
(Figures in NOK million)
The accounting policies on pages 16 to 18 and part of the notes for the Group, also apply to the parent company.
A.
SALARIES Remuneration to Board Members amounts to NOK 445,000.-, while the President and C.E.O.’s salary amounts to NOK 871,900.-.
B.
OTHER OPERATING COSTS Remuneration to the company’s auditors amounts to NOK 1,540,000.- for auditing fees and NOK 372,755.- for consultancy fees.
C.
FINANCIAL INCOME AND FINANCIAL EXPENSES Financial income includes dividends of NOK 4.2 million (25.5), of which NOK 3.0 million (24.0) was paid by subsidiaries to the parent company. Other financial income from subsidiaries amounts to NOK 3.0 million (2.4). Financial costs to subsidiaries amount to NOK 0.0 million (0.4).
D.
LIQUID ASSETS 1994
E.
1993
Bank deposits Withheld tax on salaries and wages Securities Shares
275.6 26.0 10.3 6.3
241.8 21.7 35.0 6.2
Liquid assets
318.2
304.7
DEBTORS "Debtors" include provisions for bad debts amounting to NOK 20.6 million (20.6).
F.
OTHER SHORT-TERM RECEIVABLES "Other short-term receivables" include amounts due from debtors totalling NOK 44.4 million (66.0).
G.
LONG-TERM RECEIVABLES ETC. Shares amount to NOK 2.7 million (2.5). Deferred tax benefit amounts to NOK 11.2 million (10.4). Loans to employees amount to NOK 13.0 million (3.3).
ANNUAL REPORT 1994
Notes to the accounts 32
H.
FIXED ASSETS
Goodwill Machinery etc. Buildings Land Total
I.
Cost 1 Jan. 94
Additions 1994
Disposals 1994
Accum. Book deprevalue ciation 31Dec.94
Depreciation for year
5.7 682.3 241.1 102.5
0.0 57.6 16.5 1.1
0.0 66.4 19.5 4.1
4.9 511.9 56.0 0.0
0.8 161.6 182.1 99.5
1.8 56.9 6.6 0.0
1,031.6
75.2
90.0
572.8
444.0
65.3
OTHER SHORT-TERM DEBTS Accrued taxes payable amount to NOK 50.0 million (6.3). Dividends payable amount to NOK 11.2 million (15.5).
J.
TAXES TAXATION
1994
1993
Difference between accounting profit and profit assessable for tax purposes: Profit before taxation Permanent differences Refund (dividends) Change in timing differences Tax deficit merged companies
10.5 - 3.0 1.6 171.6 0.0
109.5 - 29.5 9.9 16.8 - 48.8
PROFIT ASSESSABLE FOR TAX PURPOSES (BASIS)
180.7
57.9
DEFERRED TAX
1994
1993
Timing differences: Short-term items Pension premium reserve Accelerated depreciation Limited partnerships - ships Gain and loss account Other long-term items Basis deferred tax
37.8 0.0 37.2 0.0 78.7 - 28.0 125.7
81.6 43.3 37.6 89.4 98.6 - 18.0 332.5
Deferred tax (28%)
35.2
93.1
Deferred tax benefit *
11.2
10.4
* Calculated on net pension commitments of NOK 40.0 million (37.1).
ANNUAL REPORT 1994
Notes to the accounts 33
K.
L.
SHAREHOLDERS' EQUITY 1994
1993
Shareholders' equity at 1 January Change due to merger Profit for the year Dividends Group contribution Introduction of new accounting standard for pension expenses
464.3 0.0 6.2 - 11.2 - 4.5 - 35.4
439.5 - 33.6 111.0 - 15.5 - 37.1 0.0
Total shareholders' equity at 31 December
419.4
464.3
1994
1993
134.8 143.7 13.4
123.4 143.0 13.8
SECURED LIABILITIES
Book liabilities secured by mortgage etc. Book value of mortgaged buildings Book value of mortgaged land
Auditors' report for 1994 To the Annual Shareholders’ Meeting of A/S Veidekke We have audited the annual report and accounts of A/S Veidekke for 1994, showing a net income for the year of NOK 6.2 million for the parent company and a consolidated net loss for the year of NOK 6.9 million. The annual report and accounts, which comprise the report of the Board of Directors, the profit and loss account, the balance sheet, the statement of cash flows, the accounting policies, the notes to the accounts and the Group accounts, are presented by the company’s Board of Directors and its President and C.E.O. Our responsibility is to examine the company’s annual report and accounts, its accounting records and other related matters. We have conducted our audit in accordance with relevant laws, regulations and Norwegian generally accepted auditing standards. We have performed those audit procedures considered necessary to confirm that the annual report and accounts are free of material misstatements. We have examined selected parts of the evidence supporting the accounts and assessed the accounting principles applied, the estimates made by management, and the contents and presentation of the annual report and accounts. To the extent required by Norwegian generally accepted auditing standards, we have reviewed the company’s internal control and the management of its financial affairs. The Board of Directors’ proposal for the allocation of the profit for the year and transfers between equity accounts complies with the provisions of the Norwegian Joint-Stock Companies Act. In our opinion, the annual report and accounts have been prepared in accordance with the requirements of the Norwegian Joint-Stock Companies Act and present fairly the financial position of the company and group as of 31 December 1994 and the result of its operations for the year ended, in conformity with Norwegian generally accepted accounting principles. Oslo, 28 February 1995 ERNST & YOUNG AS Ernst Alsaker State Authorized Public Accountant (Norway) Note: The translation into English has been prepared for information purposes only
ANNUAL REPORT 1994
Key Figures 34
1994
1993
1992
1991
1990
3,162 7.8 5.2 - 6.9 1,731
3,137 63.9 75.2 48.3 1,358
3,665 93.7 81.2 47.5 1,205
3,640 69.4 74.7 42.1 1,712
2,093 106.6 90.1 57.7 1,138
0.2 2.7 4.6 - 0.1
2.4 6.4 11.7 9.3
2.2 7.9 15.2 9.9
2.1 7.8 13.4 9.4
4.3 9.3 14.8 13.8
1,923 552 28.7 167
1,910 601 31.5 130
1,999 572 28.6 137
2,191 538 24.6 314
1,792 526 29.4 156
372 1.08 0.91 11.1
367 1.15 0.97 - 7.6
359 1.09 0.95 - 5.2
431 1.06 0.93 85.5
332 1.31 1.03 180.6
SHARES Market price Earnings per share 10) Market price/earnings (P/E) Cash flow per share 11) Market price/cash flow Dividend per share Outstanding shares (average 1,000)
116.50 - 1.25 6.65 17.5 2.00 5,509
170.00 8.84 19.2 30.64 5.5 2.75 5,463
68.00 8.70 7.8 31.44 2.2 2.25 5,463
102.00 7.74 13.2 31.85 3.2 2.25 5,439
130.00 12.53 10.4 31.61 4.1 2.25 4,603
EMPLOYEES Number of employees 31 December Wages and social benefits *
2,785 749
2,694 775
2,869 873
3,007 849
1,702 467
OPERATIONS * Turnover Operating profit Profit before taxation Ordinary profit for the year 1) Orders-on-hand excluding asphalt operations PROFITABILITY Gross profit margin (%) Return on total assets (%) 2) Return on working capital (%) Return on equity (%) 4) CAPITAL ADEQUACY * Total assets Total shareholders' equity Equity ratio (%) 6) Investments
3)
5)
LIQUIDITY Liquidity 31 December * Current ratio 7) Quick ratio 8) Net interest-bearing liabilities
9)
* Figures in NOK million
All the key figures have been revised to include deferred tax. Veidekke merged with Aker Entreprenør in 1991. The key figures for 1994 have not been revised since the introduction of the accounting standard for pension expenses. 1) Ordinary profit for the year: Profit for the year plus extraordinary items less tax on extraordinary items. 2) Return on total assets: Profit before taxation plus financial expenses as a percentage of average total assets. 3) Return on working capital: Profit before taxation plus financial expenses as a percentage of average total assets less interest-free short-term and interest-free long-term debts. 4) Return on equity: Profit after taxation as a percentage of average total shareholders’ equity. 5) Total shareholders’ equity: Book equity including minority interests. 6) Equity ratio: Total equity as a percentage of total assets at 31 December. 7) Current ratio: Current assets divided by short-term liabilities. 8) Quick ratio: Most liquid current assets divided by short-term liabilities. 9) Net interest-bearing liabilities: Short-term interest-bearing liabilities plus long-term interest-bearing liabilities, less liquid assets and interest-bearing receivables from project financing. 10) Earnings per share: Ordinary profit for the year divided by the average number of outstanding shares (fully watered down). 11) Cash flow per share: Profit before extraordinary items plus ordinary depreciation less payable tax on ordinary profit less minority interests divided by the average number of outstanding shares.
ANNUAL REPORT 1994
Shareholder policy and ownership structure 35
It is Veidekke’s policy to secure for its shareholders a high, stable return on their investments over time. This return, given in the form of a dividend and rising share value, should reflect the financial development of the company. The return over a period of time should be well in excess of secured financial investments. Over the past five years, the company has distributed approximately 25 per cent of its profit in dividends. Veidekke shall be regarded by Norwegian and international investors as an attractive, liquid investment option. Investor relations, share analyses Veidekke works continuously to provide its shareholders and the financial market with open, frequent and adequate information about the company, significant events affecting its operations, all relevant financial matters, as well as the company’s future prospects. The company wishes in this way to supply the financial market with sufficient information about Veidekke to ensure that the market price of its shares is always the best possible reflection of the status and development of the company. Veidekke holds regular meetings with investors and analysts. When interim reports are published, they are presented to the market at special meetings with brokers. The results of the first quarter are made available at the Annual General Meeting. Veidekke shares are quoted on the Oslo Stock Exchange’s main list. Veidekke seeks to achieve the best possible liquidity in its shares through good investor relations. Good liquidity helps to ensure that the price of the share reflects the company’s earnings and real assets. Most brokers prepare analyses which include an evaluation of the investment value of Veidekke shares, and in 1994 2.7 million Veidekke shares were traded on the Oslo Stock Exchange.
ANNUAL REPORT 1994
Ownership structure Provided that the company fulfils reasonable expectations of earnings and looks after its shareholders in a satisfactory manner, Veidekke is best served by being an independent company. This means that Veidekke wants its ownership to be spread over a number of owners, none of whom is able to dominate the company through their shares. Veidekke’s Articles of Association limit the voting rights of any one shareholder at the General Meeting, and this limit is set at 10 per cent of the company’s share capital. There were no significant changes in ownership during 1994. Employees hold 9 per cent of the shares and 20 per cent is held by foreign investors. Employee-owners It is an advantage for Veidekke as a company, and consequently for all of its shareholders, that it remains a typical feature of the company to have employees who are shareholders and who collectively own a substantial share of the company. The value of a contracting company depends to a very large degree on the goodwill of its employees. Involving the employees as owners is an important and positive factor in the development of the company. Persons in senior management positions are expected to have shareholdings that are significant for each of them. Veidekke paves the way for greater participation, among other things by selling shares to the employees and by using shares in profit sharing. Every year, employees of Veidekke are given the chance to buy shares at a discount through the Foundation Veidekkeansattes Aksjekjøp. In 1994, each employee was offered 200 shares at a 20 per cent discount on the market price. 389 employees made use of this offer, purchasing a total of 51,739 shares.
Shareholder policy and ownership structure 36
Inside information Since a large number of Veidekke’s employees are shareholders in the company, it is important to ensure that the rules regarding insider trading are adhered to. Members of the Board and the corporate management are required to report any purchases or sales they make of shares to the Oslo Stock Exchange, and other key personnel are also subject to restrictions in order to prevent possible exploitation of inside information.
Key figures Key figures for Veidekke shares are given on page 34 of this report. Interim reports 1995 The Annual General Meeting will be held on 27 April 1995. The report for the first three months will be published at the Annual General Meeting. The report for the 2nd quarter will be published on 17 August and the report for the 3rd quarter on 6 November.
Major shareholders as at 31 December 1994 Vital Forsikring A/S Folketrygdfondet Avansefondene UNI Storebrand Livsforsikring A/S Norsk Hydros Pensjonskasse Aker a.s Gjensidige Forsikring State Street Bank & Trust Chase Manhattan Bank NA Kommunal Landspensjonskasse Morgan Guaranty Trust Co. of N.Y. The Northern Trust Co. UNI Storebrand Finans Industriforsikring A/S Skandinaviska Enskilda Banken
ANNUAL REPORT 1994
Number of shares
Per cent share of total
543,778 491,800 425,912 364,225 280,006 274,380 272,030 249,855 170,100 157,000 134,298 131,526 102,200 98,000 95,811
9.7 8.7 7.6 6.5 5.0 4.9 4.8 4.4 3.0 2.8 2.4 2.3 1.8 1.7 1.7
Areas of Activity 37
Veidekke has so far completed eight petrol stations for Statoil in Germany. Photo: Ole R. Paulsen
1994 Areas of activity
1993
Turn- Profit before over taxation
Building Heavy Construction Asphalt Property Other activities
1,557.7 950.9 686.9 49.6 - 83.6
Total
3,161.5
13.0 - 35.0 35.7 2.6 - 11.1
1992
Turn- Profit before over taxation
Turn- Profit before over taxation
1,490.8 859.6 719.6 55.0 12.0
20.9 22.2 30.5 4.3 - 2.7
1,766.4 1,088.0 750.5 70.5 - 10.9
0.3 52.1 24.6 17.0 - 12.8
5.2 3,137.0
75.2
3,664.5
81.2
Comments The share of turnover and profit contributed by associated companies is included in the figures for the individual areas of activity. The turnover has been eliminated under "Other activities". The item "Other activities" also includes Veidekke's share of the result in Noremco and non-assigned management costs. This item is further affected by eliminated internal profit on non-residential buildings erected for Veidekke's own account, the sale of the company Con-Form A/S in Norway and sale of interests in limited shipping partnerships.
ANNUAL REPORT 1994
Building 38
The market The growth in the commencement of new dwellings and non-residential buildings that started in the second half of 1993 continued into 1994. Despite the upswing in building activity, the market was still characterised by surplus capacity and fierce price competition. The commencement of new dwellings hit rock bottom in 1992 with a total of 15,600 units. House-building began to pick up the following year, particularly in the latter half of the year. Growth continued in 1994 and 21,000 dwellings were started on. The average size of dwelling grew too, both because the individual houses were larger and there was a veer in the direction of more one-family houses. It is anticipated that the number of dwellings started on will continue to rise somewhat in 1995. While the area of non-residential buildings started on in the first half of the eighties was about 2.5 million sq.m., this figure reached almost 4.4 million sq.m. during the building boom. It then fell back to about 2 million, which has been the level for the past three years. As in the case of house-building, there was an upturn in new non-residential building from the autumn of 1993, and in 1994 2.5 million sq.m. were started on, which was an increase of 500,000 sq.m. compared with the year before. The generally positive trend in the Norwegian economy and rise in employment figures mean that a high commencement figure can also be expected in 1995. Activities Veidekke’s building division had a turn-
ANNUAL REPORT 1994
over of NOK 1,558 million in 1994 (NOK 1,491 million). Profits were slightly lower in 1994 than in 1993, as a result of provisions for non-profitable projects in the first quarter. Total earnings for the rest of the year were on a par with the year before. Further organisational development was also given priority in 1994, with the emphasis on areas such as purchasing and cooperation with suppliers, project management and focus on the customer. Orders-on-hand showed an upward trend throughout the year. Major new contracts included the Ski Shopping Centre for the Olav Thon Group, the Arctic Hotel in Tromsø for Rica Hotels, the Vinterbro Shopping Centre for Steen & Strøm Invest and the new police headquarters in Bodø. These contracts were all signed as a result of direct negotiations with the client. This is a demanding form of contract based on mutual trust between the parties, which can also help to meet the client’s needs in a more rational, cost-effective way than by the usual tendering procedure. At the end of the year, orders-on-hand stood at NOK 1,154 million (NOK 654 million). The order books are satisfactory for all divisions. The market for non-residential building is very weak in Sør-Trøndelag, but this is partly offset by the increase in activity in North Norway and particularly in Tromsø. Veidekke has been able to maintain the same level of activity in the Lillehammer area in spite of a decline in the market following the completion of the Olympic construction work.
Building 39
A good supply of building sites has made it possible for Veidekke to capitalise on the upswing in the building market. While the number of dwellings started on for Veidekke’s own account was 33 in 1992, increasing to 139 in 1993 and to 258 in 1994. These dwellings have sold very well and the number of unsold dwellings has not increased in spite of the substantial increase in activity. At the end of the year, the number of unsold dwellings was 39, as against 43 the year before. Being aware of the importance of reducing the risk, Veidekke spreads its development over several projects and sets certain minimum requirements regarding advance sales before projects are initiated. Including the dwellings erected by Veidekke for other clients, the company’s total dwellings came to about 600 units in 1994. In addition to new residential and nonresidential building, Veidekke is involved in extensive renovation work. The main bulk of this work is in Oslo, but this type of activity is also increasing in other major urban areas.
International operations Veidekke’s international building activity is concentrated in Germany, where it is based in the Berlin area. The most important contracts Veidekke GmbH had in 1994 were the building of altogether eight petrol stations for Statoil and a subcontract for the German contractors Philipp Holzmann. Con-Form Ltd. in Poland, which makes concrete elements for the building market in Berlin, is also closely associated with the German building division. Veidekke’s German division had a total turnover of NOK 163 million in 1994, which gave a loss of NOK 14.1 million. Most of this loss can be ascribed to the contract for Philipp Holzmann which will be completed in March 1995 after a construction period of about nine months. The parties disagree about the financial settlement and the dispute will be settled by arbitration. At the end of 1994, orders-on-hand amounted to NOK 150 million, the largest single contract being the construction of the petrol stations for Statoil.
Foto: Rune Rommetveit
Top: The Kim Tvedt furniture centre in Bergen covers 12,000 sq. m. and was built as a joint venture by Veidekke and Selmer. Right:The theatre-concert hall in the Gullbring Cultural Centre in Bø in the county of Telemark. The Centre also houses a swimming pool, a sports hall and a cinema. Photo: Ole R. Paulsen
ANNUAL REPORT 1994
Building 40
This new area is part of the anniversary extension of the Norwegian Folk Museum in Oslo. Veidekke was the main contractor for this work. Photo: Jiri Havran
Photo: Ole R. Paulsen
Photo: Ole R. Paulsen
Photo: Knut Houm
ANNUAL REPORT 1994
Photo: Dagfinn Hårstad
Photo: Torkel Backelin
1. Åstadlia in Asker is a housing project containing 48 owneroccupied flats built for Veidekke's own account. 2. New officers' quarters at Olavsvern Naval Base in Troms. Veidekke has previously carried out extensive development work on this base for the Norwegian Navy. 3. New wing, extension and conversion work at the Holmenkollen Park Hotel for Rica Hotels. 4. Veidekke is erecting a new research building for university studies on Svalbard. Other contracts in 1994 were a quayside depot for Store Norske Spitsbergen Kullkompani and work for the EISCAT-project, a radar station for ionospheric research. 5. Veidekke is the largest contractor in the market when it comes to the renovation of housing cooperatives. This is the Nordre Åsen housing cooperative in Oslo.
Heavy Construction 41
The market For quite some time now, the heavy construction market has been labouring under the decline in government investment in hydropower and defence installations. This has been offset to some extent - but not nearly enough - by an increase in the investment in transport and communication projects. On the whole, the construction market has slumped heavily since the peak years of 1987-88. One of the contributory causes of this decline is the fact that investment in industry and land-based oil installations was especially high during these two years. The sagging market is clearly reflected in the order books of the private construction companies. Orders-on-hand have been sliding more or less continuously for the past two years. An improvement is anticipated, however, when the major contracts relating to the Gardermo development are put out on tender. Growth of up to about five per cent is expected in the heavy construction market from 1994 to 1995. A significant proportion of all contracts in this market are performed by public departments for their own account, particularly the Public Roads Administration and the municipal authorities. Activities At the beginning of 1994, heavy construction had a noticeably larger volume of orders-on-hand than the year before. It was to transpire, however, that the prices for some of these projects were too low and the accounts showed a substantial deficit at the end of the second quarter. By then the projects in question had been reviewed in detail and allowance was made for possible losses right up to completion. In the case of two of these projects, claims have been brought against the client for what Veidekke considers to have been extracontractual work. These claims have not been booked as income in the accounts.
ANNUAL REPORT 1994
At the same time, far-reaching changes were made in the heavy construction division, which was given new management and a new organisational structure. Considerable work has been put into developing the organisation. A comprehensive programme of improvements has also been initiated. This programme, “Bridges Can Move Mountains”, is untraditional in that the improvements are being done from the bottom up. This project has been initiated with the full support of the union representatives at Veidekke. It is Veidekke’s aim that this process will eventually be implemented throughout the company. The second half of the year developed as expected, giving a break-even for heavy construction after the heavy losses in the first six months. This resulted in a loss for the year of NOK 35 million (NOK +22.2 million). Turnover was NOK 951 million (NOK 860 million). Although competition for new contracts remained fierce in 1994, Veidekke succeeded in obtaining several interesting contracts, including the tunnel entrance and ramps for the GMB high-speed railway at Etterstad on the new Gardermo railway line (NOK 74 million), stone crushing at Garderfjell in a joint venture with Selmer (NOK 110 million), the reconstruction of an intersection on the E 18 (NOK 29 million) and a long-term contract for Elkem at the Tana quartzite quarry (NOK 51 million). Orders-onhand stood at NOK 577 million at the end of the year (NOK 704 million). One of the new contracts awarded in 1995, for work on the underground line in Oslo, is worth NOK 72 million. There is a general promise of improvement in the balance between supply and demand in the heavy construction market in 1995. However, there are no signs of improvement for tunnelling work in the short term. With this situation in mind, adjustments were made in
Heavy Construction 42
capacity towards the end of last year. Veidekke’s policy of giving priority to profitability rather than volume means that the heavy construction division is aiming for a turnover this year that is slightly lower than in 1994. International operations Noremco, which has its headquarters in Tanzania, has been engaged in building and construction in East Africa since 1981. Veidekke owns 47.5 per cent of this company. The bulk of its activities has been related to development aid projects financed by Norwegian or Nordic authorities, but Noremco has also built up a substantial network of local clients. 1994 was the first year that the company had to register a loss for its operations, one of the main reasons being that turnover was lower than expected due to the delay in the commencement of two major projects. During a review of the company’s accounting routines, losses were also revealed on two projects that were completed in 1993. A decision was made to introduce the same practice for allocations for projects that Veidekke applies in Norway. Veidekke’s share of the company’s turnover and loss for 1994 were NOK 67 million and NOK -7.6 million respectively. The corresponding figures for the previous year were NOK 78 million and NOK 1.4 million. Veidekke has carried out work worth about NOK 115 million on the longest pontoon bridge in the world, the Nordhordland Bridge between Steinestø and Knarvik. Veidekke was involved both as a partner in a joint venture and as a subcontractor.
Photo: Anders Haakonsen
ANNUAL REPORT 1994
Nocon, owned by Veidekke, Selmer and Norwegian Contractors, aims to contribute to increased exports based on the companies’ expertise in the fields of tunnelling and complex concrete structures. At the end of 1994, Nocon was involved in five projects and had orderson-hand amounting to NOK 166 million. One of these projects is the conversion of the Warnow Shipyard for Kværner in Germany, while the others are located in the Middle East and East Asia. The most important product areas from now on are hydropower projects and marine concrete structures, with Indo-China and East Asia as important markets. Through the Advisory Group of Norway (AGN), Veidekke has been participating for ten years as a consultant and client’s representative in hydropower development in China. This is a small operation in terms of turnover, but it gives a satisfactory profit. Veidekke has also sold consultancy services to other clients, such as Statoil in connection with the terminal for the gas pipeline to Emden. In 1994, Veidekke and Siab were awarded a joint contract for tunnelling work for the extension of a water treatment plant in Stockholm, Sweden. This project is progressing as planned and is expected to be completed in the course of 1995.
Heavy construction 43
Photo: Per-Kristian Edvardsen
Photo: Ole R. Paulsen
Photo: Ole R. Paulsen
ANNUAL REPORT 1994
Photo: Anders Grimnes
1. In China, where hydroelectric power is being developed on a vast scale, the Advisory Group of Norway (AGN) has been contributing Norwegian hydropower expertise for the past eleven years. AGN is presently acting as consultants for the Ertan plant in the province of Sichuan. Installed capacity is 3,300 MW, with six generators of 550 MW each. The photograph shows the inlet and the concrete and crushing plant for the dam. 2. The hilly ground at Tjeldbergodden has been transformed by blasting and filling into a flat area measuring 1,200 x 200 metres. The work also included a 300-metre long jetty and a submerged tunnel for the intake of cooling water for the future methanol plant. 3. It took sixteen days, using a travelling form, to cast the permanent gate for Kværner’s building dock at Hanøytangen. 4. Veidekke has carried out blasting and concrete work for the expansion of six large water treatment sections for Vestfjorden Avløpsselskap VEAS. 5. In Tanzania, Veidekke has been involved through Noremco in the development of the Pangani Power Plant.
Photo: Chr. Urrang
Asphalt 44
The market After remaining fairly stable for several years, the asphalt market fell last year by about six per cent. The Public Roads Administration increased its share of the market, with the result that private asphalt contractors suffered a ten per cent decline. At the same time, the Public Roads Administration is by far the most important customer and is responsible for about fifty per cent of all contracts awarded to private contractors in the market. Other public clients are the Civil Aviation Administration and the Ministry of Defence. Local authorities and private clients make up the rest of the market. Most of the asphalt produced is used for the renovation and upkeep of existing roads, while the volume used on new investments does not normally exceed more than 15 to 20 per cent. The structure in the asphalt business has been relatively stable in recent years. Veidekke, with its subsidiary Korsbrekke og Lorck (Kolo) and associated company Kongsvinger Asfalt, along with Nodest Vei and Icopal (formerly Fjeldhammer Brug) are the largest private producers, while the Public Roads Administration is another significant operator. The market is, however, characterised by surplus capacity and, as in the case of the heavy construction market, there are many small companies competing for the contracts. In addition to permanent production facilities, an increasing number of mobile asphalt plants owned by both major and minor companies, are appearing on the market. Franzefoss and Selmer have established a new asphalt company under their joint ownership, which will add to the surplus capacity in the market and increase pressure on prices. Activities Veidekke and its subsidiaries had a turnover of NOK 687 million in 1994 (NOK 720 million), which gave a profit of NOK 35.7 million (NOK 30.5 million). The higher profit, in spite of a lower
ANNUAL REPORT 1994
turnover, was a result of the rationalisation in operations and gains on sales of equipment, plus the fact that operating conditions towards the end of the year were better than the year before owing to the relatively late onset of winter. Veidekke and Kolo own a total of 33 asphalt plants spread over most of Norway. The largest and most modern is located in Hobøl. The quality of the raw materials is vital for the end product and Veidekke and Kolo’s 23 stonecrushing plants around the country give a good raw material basis for their production of asphalt, both as regards volume and quality. The total production of crushed stone and gravel was 2.5 million tons, which makes Veidekke and Kolo one of the largest producers in the country. Most of this volume is used for Veidekke’s own production and the rest is sold to external customers. Exports are being built up and the 1994 volume of 300,000 tons is expected to increase to 425,000 in 1995. Thanks to higher sales and cost reductions, crushed stone and gravel operations achieved better results than the previous year. The Group’s stonecrushing expertise has also won several contracts pertaining to the Gardermo development. As the leading asphalt contractor in the country, Veidekke gives priority to product development and improvements in production and asphalt-laying methods. This is often done in collaboration with the client in the form of product development contracts. Veidekke offers a wide range of products for different uses and has been working on the further development of cold mix - a costsaving, environmentally friendly alternative to traditional hot mix - for many years. Veidekke and Kolo lead the field when it comes to asphalt cores for rockfill dams and have completed a number of these in Norway. Veidekke is currently working on a large contract for
Asphalt 45
Statkraft linked with the building of an asphalt core and filter in the Storglomvatn Dam and the Holmvatn Dam, which form the reservoir for the Svartisen power plant. This special expertise is also marketed internationally. The prospects for 1995 indicate that the asphalt market will remain much the same as last year, or possibly be slightly better. The amounts allocated in the government’s budget for 1995 for the upkeep of national and county roads are about the same as in 1994. To this can be added a grant of NOK 200 milli-
on for the upgrading of the road network in preparation for the abolishment of the restrictions concerning the maximum permitted axle load during the spring thaw. However, there is some uncertainty about how large a proportion of these contracts the Public Roads Administration will carry out for its own account. The general upswing in the economy and improvement in market conditions for much of the business sector should indicate the possibilities of some growth in the municipal and private asphalt markets.
Asphalting work for private clients is an important market segment for Veidekke.
ANNUAL REPORT 1994
Photo: Anders Haakonsen
Asphalt 46
Photo: Jostein Nordstrøm
Photo: Kjell Rustad
Photo: Terje Moldaunet
1. Veidekke is surfacing the track of the Arctic Circle Raceway, Norway’s national centre for motor sports at Storforshei in Nordland. 2. In 1994, Veidekke laid a total of 700,000 sq.m. of asphalt to level the tracks worn by studded tyres. This represents a very interesting market. 3. When the Storglomvatn Dam is completed in 1997, it will be 125 metres high, the world’s highest dam with an asphalt core. It is part of the major Svartisen hydropower development. 4. Laying a damp-proof membrane on a concrete bridge.
Photo: Hallvard Søvik
ANNUAL REPORT 1994
Property 47
Profit and loss account Rental income Loss on sales Turnover Operating costs Depreciation Financial expenses Profit Figures in NOK million
50.7 1.1 49.6 16.7 10.4 19.9 2.6
The market The market for commercial property did not improve at all in 1994. As a result of low building costs and the low interest rate, there was a rise in the development rate even though there was no noticeable increase in the demand for premises. This has put lasting pressure on rents and the situation is not expected to change very much during the next few years.
down into NOK 36.3 million from external tenants and NOK 14.4 million from Veidekke’s own operations. Six small properties were sold during the year at a loss of NOK 1.1 million, giving a turnover of NOK 49.6 million. Total operating costs were NOK 16.7 million. The property division showed a profit of NOK 2.6 million, after depreciation of NOK 10.4 million and net financial expenses of NOK 19.9 million.
The property market in the Oslo area is functioning well and tenant mobility is good. New requirements regarding area utilisation, area size, location and environment have led to a demand for new premises, often at the expense of old buildings. A stable trend can therefore be expected for new properties with a good location, while older, not so rational premises will continue to fall behind. The demand for premises varies a great deal from one part of the country to another. Factors such as easy access by car and short distance to public communications are becoming more important. This means that demand is more concentrated at junction points, such as central Oslo, Skøyen, Lysaker and Helsfyr. Outside Oslo, the market is generally characterised by surplus capacity. Success here will depend on the ability to combine good local knowledge with a local footing and a network of contacts.
The book value of the properties at the end of the year was NOK 461 million, compared with NOK 422 million in 1993.
How the situation will develop in the long term will of course depend on general framework conditions such as growth in employment and the interest rate. In the Oslo region, major projects such as the conversion of Fornebu airport into an industrial and/or residential area, will have a tremendous impact on the market.
Activities Veidekke’s total property amounted to 89,139 sq.m. at the end of 1994. Rental income was NOK 50.7 million, broken
ANNUAL REPORT 1994
At the end of the year the vacancy rate was 4 %, measured in rental value. The average remaining term for existing leases is 5.2 years. Leases with a total value of NOK 2.7 million expire in the course of 1995. Together with the vacant area, this represents a rental value of NOK 4.9 million that must be renegotiated or let to new tenants in 1995. Three major projects were completed in 1994. Fornebuveien 9 in Bærum and the Police Station in Larvik are both fully let on long-term leases, while Kirkebrygga in Fredrikstad has been sold at a good profit. This project is included in Veidekke’s building figures. Veidekke’s largest property development project for its own account is its share of premises at Skøyen in Oslo. The formalities regarding land use, development contracts and site demarcation have almost been completed and the project will be marketed in 1995. Development work will start as soon as leases have been signed on acceptable terms for a substantial part of the area. Through its property division and regional operations, Veidekke has acquired broad expertise in the fields of development, building and management. This expertise will be built on and used to increase assets and growth. Veidekke’s
Property 48
wide network of contacts and its sound financial standing put it in a strong position among the leaders in these market segments. Veidekke will also offer its skills and experience to other property owners and develop and manage projects for other owners. In some cases, Veidekke
will consider going in as owner, either alone or as part of a joint venture. Once these projects have been completed, however, Veidekke’s first objective will be to evaluate them for sale, to ensure that the Property Division’s share of the company’s total balance is not noticeably increased.
Photo: Ole R. Paulsen
Top: The new police station in Larvik, built by Veidekke as the main contractor for Prospect A/S. Right: Made-to-measure workplaces for the new tenants, Grøner AS, at Fornebuveien 9 in Bærum.
Photo: Erik Kamfjord
ANNUAL REPORT 1994
Property 49
Photo: Bjørn Blegen
1. Demolition work is underway at the old NEBB property at Skøyen in Oslo. Veidekke is a partner in a property company which has the right to build 30,000 sq.m. of business and office premises on this site. 2. Tullins gate 2 in Oslo has been completely renovated and now offers 6,900 sq.m. of attractive office premises. Veidekke owns 45 % of this property. 3. The entrance hall and reception area at Tullins gate 2 are representative of the high standard of this building.
Photo: Ole R. Paulsen
Photo: Ole R. Paulsen
ANNUAL REPORT 1994
Property 50
List of properties as at 1 January 1995 Property
District
Schweigaards gate 33b Fornebuveien 1 - 3 Ringeriksveien 193/201 Tullins gate 2 Trygve Nilsens vei 8 Iduns gate 2 H. Martinsens vei 27 Markveien 28 Fornebuveien 11 - 13 Østgaards gate 8
Oslo Bærum Bærum Oslo Oslo Oslo Oslo Oslo Bærum Oslo
Ownership %
100 Leasehold 50 2,660 100 37,657 45 1,124 100 Leasehold 100 809 100 Leasehold 762 100 100 6,393 100 308
Total Oslo and district Fosskvartalet * Gråterudveien 1 Sande Næringsbygg Tordenskjolds gate 10 Prinsekvartalet Gullhaug Senter Drammen Glass Kilemoen Larvik Police station * Gråterudveien 45 Glitre Tollbugaten 30 Sande Stasjon Ås Teknosenter
Gross floorage in sq. m. Office/ Wareh./ business industry Other Total 4,380 3,485 2,698 2,976 1,351 235 432 108 5,640 0
0 0 3,900 113 1,290 0 5,263 0 0 0
49,713 21,305 10,566 Lier Drammen Sande Holmestrand Larvik Holmestrand Drammen Ringerike Larvik Drammen Gol Drammen Sande Tønsberg
50 100 100 50 100 100 50 100 50 100 100 100 100 100
Total Vestfold/Buskerud Strandtorget Shopping centre Smedasundet 50 Kokstadveien 48b Sognshøy Mellomila 24 Langbakken 16 Stjørdal Greåkerveien Totlandsveien Sandane Moelv Trøgstad
Site sq. m.
2,399 5,327 1,800 392 3,588 3,063 24,303 36,295 1,202 3,664 2,000 64 600 1,106
3,741 0 5,822 0 1,752 0 1,366 0 1,610 0 1,600 0 814 11,765 0 0 1,756 0 980 0 150 375 300 0 500 0 267 0
85,803 20,658 12,140 Lillehammer Haugesund Bergen Råde Trondheim Ås Stjørdal Sarpsborg Bergen Gloppen Ringsaker Trøgstad
23 100 100 100 50 50 100 100 100 100 100 100
Total other areas of Norway
5,843 5,508 5,198 3,597 1,390 1,225 1,234 450 6,919 170
0 0 100 0 90 0 100 0 0 0
0 0 0 3 0 0 0 0 0 0
3,825 35,695 31,534
24
0
5.0
3,763 2,853 1,658 1,362 1,014 1,125 2,700 350 1,671 461 180 80 238 253
0 6 7 0 0 0 0 100 0 0 100 0 0 0
2 19 9 0 21 5 25 0 0 47 0 0 52 0
8.1 1.3 3.2 2.5 1.3 3.5 1.2
2,234 35,032 17,710
5
12
5.7
0 0 0 0 0 2,102 105 1,077 0 541
4,380 3,485 6,598 3,089 2,641 2,337 5,800 1,185 5,640 541
1,135 4,876 0 5,822 0 1,752 0 1,366 849 2,459 0 1,600 180 12,759 0 0 0 1,756 70 1,050 0 525 0 300 0 500 0 267
Oslo Bærum
Total development projects * Associated company
ANNUAL REPORT 1994
50 100
5.1 3.0 10.0 10.0 5.4 10.0
19.9 0.7 0.6 1.0
2,328 1,032 934 836 1,862 789 280 173 100 230 650 0
0 3,078 925 1,088 0 0 690 0 618 340 1,070 620
0 0 0 0 0 0 0 769 0 0 0 0
2,328 4,110 1,859 1,924 1,862 789 970 942 718 570 1,720 620
2,700 1,850 1,100 888 759 431 336 337 160 180 400 242
0 68 100 100 70 58 100 100 0 100 100 0
0 0 0 0 0 0 0 0 0 0 0 0
5.0 3.0
87,760
9,214
8,429
769 18,412
9,383
56
0
4.3
6,828 89,139 58,627
24
0
5.2
Development projects: Skøyen Fornebuveien 7
5.1 2.7
1,380 5,860 6,500 31,041 1,028 1,900 7,550 6,219 6,493 4,429 11,000 4,360
223,276 51,177 31,135
Total
Rental income 1995 (Nok 1,000 ) Remaining period % % Total Internal Vacant (years)
12,750 17,000 1,400 1,500
0 0
0 17,000 0 1,500
14,150 18,500
0
0 18,500
3.0 3.0
1.2
The housing estate of the future 51
The key features of the housing estate of the future are climatic adaptation, adaptation to the natural surroundings, waste disposal, energy savings, a healthy living environment and self-sufficiency. Photo: Ole R. Paulsen
The new owners are in the process of moving in to the “housing estate of the future” in Borge in the county of Østfold, where Veidekke is responsible for the building of fifteen ecological one-family houses. These houses have their own water supply and their own underground treatment systems for waste water. Annual savings are estimated to be as high as NOK 12,000. The base price for each house is NOK 695,000. This project has been developed by the Foundation Østfoldforskning (STØ), SG Arkitekter and Veidekke.
Effluent from the ordinary water-flushed toilets is fed first to a tank that separates dry matter from the water. While the dry matter is converted to compost in the tank, the water is run off through an ultraviolet filter into the drainpipe for waste water.
The housing estate has been designed on the philosophy of totality, and interference with nature has been kept to an absolute minimum. The original vegetation runs close to the houses and the road network, acting as a protective barrier against the wind and cold. Each house is positioned in the terrain to achieve maximum utilisation of passive solar energy.
The one and a half-storey houses have been designed as low-energy houses. The choice of building materials is based as far as possible on natural, non-toxic materials. The houses are designed for mechanical ventilation and heat recovery and for the use of active forms of solar heating. The size of the houses meets the requirements of the Norwegian State Housing Bank, while allowing for a wide freedom of choice when it comes to layout, interior fittings and other equipment.
The estate is supplied with water under pressure from a deep-drilled groundwater well. Waste water and sewage is fed to three different types of ecological treatment plants which return the treated water to the ground outside. The houses all have the same type of drainage system.
ANNUAL REPORT 1994
The local council has agreed to waive the annual charges for water and sewerage, thus halving the amount payable to the sanitation department. Biodegradable waste is composted in the area and non-biodegradable waste is sorted at source for later collection.
The ground has been prepared and parcelled out to give each house its own garden plot and a communal area for the cultivation of useful plants.
Organisation 52
PRESIDENT AND C.E.O. Terje R. Venold
FINANCIAL CONTROL Dag Andresen
MACRO ECONOMICS/ STRATEGY Torkel Backelin
FINANCE AND INVESTOR RELATIONS Jørgen G. Michelet CORPORATE VICE PRESIDENT Deputy president / C.E.O. Petter Eiken
BUILDING OSLO Magnar Huse
BUILDING EAST Pål P. Syse
BUILDING WEST Carl I. Veland
ANNUAL REPORT 1994
BUILDING NORTH Ståle Brovold
HUMAN RESOURCES INFORMATION Egil Lorentzen
GERMANY Veidekke GmbH
PROPERTY Leif E. Johansen
HEAVY CONSTRUCTION Ole A. Opsahl
ASPHALT Asle Tveter
KORSBREKKE OG LORCK AS Eigil Flaathen
Addresses
HEAD-OFFICE Olav Brunborgs vei 4 P.O. Box 3, N-1361 Billingstad Phone: +47 66 98 53 00 Fax: +47 66 98 13 44
District Grenland Tollbodgaten 29 P.O. Box 166, N-3901 Porsgrunn Phone: +47 35 55 67 00 Fax: +47 35 55 91 25
PREPERTY DIVISION Olav Brunborgs vei 4 P.O. Box 3, N-1361 Billingstad Phone: +47 66 98 53 00 Fax: +47 66 84 94 70
Napastaa Entreprenør A/S N-3800 Bø i Telemark Phone: +47 35 95 04 11 Fax: +47 35 95 09 59
HEAVY CONSTRUCTION DIVISION Ringeriksveien 193 B P.O. Box 111, N-1314 Skui Phone: +47 67 15 41 00 Fax: +47 67 13 90 89 DIVISION OSLO Trygve Nilsens vei 8 P.O. Box 84 Ellingsrudåsen, N-1006 Oslo Phone: +47 22 32 35 50 Fax: +47 22 32 72 90 DIVISION EAST Rygge P.O. Box 70, N-1580 Rygge Phone: +47 69 28 01 37 Fax: +47 69 26 09 15 Holmestrand Havnegaten 7 Postuttak H, N-3081 Holmestrand Phone: +47 33 05 14 04 Fax: +47 33 05 37 03 Property and project development Storgaten 13 P.O. Box 300, N-3101 Tønsberg Phone: +47 33 31 61 90 Fax: +47 33 31 36 06 District S. Akershus Langbakken 16 P.O. Box 55, N-1430 Ås Phone: +47 64 94 11 65 Fax: +47 64 94 15 62 District Østfold Greåkerveien 27 P.O. Box 68, N-1720 Greåker Phone: +47 69 14 50 66 Fax: +47 69 14 55 05 District Buskerud Gråterudveien 1, N-3036 Drammen Phone: +47 32 88 05 90 Fax: +47 32 88 05 07 District Vestfold Prinsegaten 11 P.O. Box 318, N-3251 Larvik Phone: +47 33 18 60 60 Fax: +47 33 18 67 45
Design: Bjelvin Design Printing: Optimal April 1995
District Indre Østland Marisagveien 8 P.O. Box 203, N-2391 Moelv Phone: +47 62 36 89 99 Fax: +47 62 36 90 30 DIVISION WEST Region Bergen Kokstadveien 48 B P.O. Box 94/95, N-5061 Kokstad Phone: +47 55 99 03 00 Fax: +47 55 99 01 20 Region Haugesund Smedasundet 50, N-5500 Haugesund Phone: +47 52 72 95 00 Fax: +47 52 72 80 14 Region Sogn og Fjordane P.O. Box 63, N-5801 Sogndal Phone: +47 57 67 82 24 Fax: +47 57 67 86 50 DIVISION NORTH Mellomila 24 P.O. Box 3573, N-7002 Trondheim Phone: +47 73 51 00 11 Fax: +47 73 51 00 87 District Tromsø Tomasjordnes P.O. Box 324, N-9001 Tromsø Phone: +47 77 68 86 00 Fax: +47 77 68 80 08 ASPHALT DIVISION Olav Brunborgs vei 4 P.O. Box 104, N-1361 Billingstad Phone: +47 66 98 53 00 Fax: +47 66 98 06 73 KORSBREKKE OG LORCK AS Olav Brunborgs vei 4 P.O. Box 23, N-1361 Billingstad Phone: +47 66 98 57 00 Fax: +47 66 98 24 88 Veidekke GmbH Symeonstr. 6, D-12279 Berlin, Tyskland Phone: +49 30 721 3032 Fax: +49 30 722 6062
P.O. Box 3 N-1361 Billingstad Norway
CONTENTS:
Page
Five-year Review
1
Highlights
2
Playing an active role
4
The Report of the Board of Directors
7
Accounts for Group and Parent Company
13
Auditors’ Report
33
Key Figures
34
Shares and Shareholders
35
Areas of Activity
37
The Housing Estate of the Future
51
Organisation
52
Addresses
53
PUBLICATION DATES FOR INTERIM REPORTS IN 1995 • 1st quarter: 27. April • 2nd quarter: 17. August • 3rd quarter: 6. November The Annual General Meeting will be held on 27 April 1995
Kirkebrygga on the banks of the river in Fredrikstad contains exclusive owneroccupied flats, a multi-story car park and business premises. This development was carried out on a turn-key basis in collaboration with the GEAS architect and consulting firm. The building project was a resounding success. Foto: Ole R. Paulsen
VEIDEKKE
• Table of Contents • Overview • Summary 1994 • Key figures • Report of the Board of Directors • Income Statement • Balance Sheet • Cash Flow Analysis • Notes • Shareholders Policy 1994
Annual Report 1994