Valuing Air Quality Impacts of Transportation: A Review of Literature
Ackchai Sirikijpanichkul Madhumita Iyengar Professor Luis Ferreira
School of Urban Development Faculty of Built Environment and Engineering Queensland University of Technology (QUT) Brisbane, Australia
June 2006
Valuing Air Quality Impacts of Transportation: A Review of Literature Ackchai Sirikijpanichkul, Madhumita Iyengar and Luis Ferreira School of Urban Development, Queensland University of Technology, Brisbane.
Abstract The monetary valuation of air quality impacts of transportation is increasingly being adopted when undertaking cost-benefit analysis of projects or strategies aimed at reducing the negative effects of transport on the environment. This paper provides a review of the evidence available on the most appropriate methodologies to be used for such air quality impact valuations. The paper deals with the main issues in identifying and categorising air quality impacts; the methodologies adopted to quantify mortality and morbidity effects of air pollution on health; and the valuations put forward by studies in Europe, the US and in Australia. Unit monetised values by pollutant are summarised in the paper. The valuations for each pollutant currently being proposed for Australian conditions have been derived using in some cases European values corrected for local conditions. There is considerable uncertainty in some of the estimates to warrant further research. There is little research or evidence available on non-health impacts of air quality deterioration, such as local and regional economic activity and employment effects due to loss of tourism revenues.
Keywords: air pollution, health effects, transport emissions, epidemiology, exposure, environment, health risks, premature mortality, morbidity, valuation, health costs, policy. The authors would like to acknowledge the suggestions/comments provided on this work by their colleagues at QUT. The views expressed in this paper are those of the authors, and do not necessarily represent those of the School of Urban Development, QUT. The usual caveats apply. Author Contacts Prof. Luis Ferreira / Ackchai Sirikijpanichkul, Research Associate School of Urban Development, Faculty of Built Environment and Engineering Queensland University of Technology (QUT), Brisbane. Phone: 61 7 3864 1542 Fax: 61 7 3864 1515 E-mail:
[email protected],
[email protected] Madhumita Iyengar, Senior Policy Analyst Budget Group, Department of Finance & Administration, Canberra. Phone: 61 2 6215 3109 Fax: 61 2 6215 3256 E-mail:
[email protected]
Valuing Air Quality Impacts of Transportation: A Review of Literature
Page i
Table of Contents
Abstract ...............................................................................................................................i Table of Contents............................................................................................................ ii List of Tables................................................................................................................... iii List of Figures ..................................................................................................................iv 1) Overview.................................................................................................................... 1 2) Transport Emissions and Externalities ................................................................ 1 2.1 2.2
3)
Identifying Impacts of Air Pollution ................................................................... 4 3.1 3.2 3.3 3.4
4)
Estimating Transport Share in the Total Emission Causing Health Effects......... 9 Estimating Value of Statistical life (VOSL) ............................................................. 10 Quantifying Acute Health Effects............................................................................ 11 Quantifying Chronic Health Effects ........................................................................ 11 Valuing Children Health Effects .............................................................................. 12 Estimating Health Costs of Indoor Air Pollution .................................................. 13
Valuation Methodology........................................................................................ 13 5.1 5.2 5.2.1 5.2.2 5.3 5.4
6)
Background ................................................................................................................... 4 Health Effects................................................................................................................ 6 Global Warming ........................................................................................................... 8 Other Impacts ............................................................................................................... 9
Current Research Issues.......................................................................................... 9 4.1 4.2 4.3 4.4 4.5 4.6
5)
What are Externalities?................................................................................................ 2 Quantifying Externalities ............................................................................................ 2
Overview ..................................................................................................................... 13 Health........................................................................................................................... 15 Mortality.................................................................................................................. 18 Morbidity ................................................................................................................ 19 Global Warming ......................................................................................................... 20 Other Impacts ............................................................................................................. 21
Empirical Evidence on Valuation of Air Quality Impacts ............................. 21 6.1 International Practice................................................................................................. 21 6.1.1 European Practice .................................................................................................. 22 6.1.2 United State Practice.............................................................................................. 23 6.2 Australian Practice ..................................................................................................... 25 6.3 Policy Relevance: Valuing Air pollution in Cost Benefit Analysis .................... 27
7) 8)
Research Questions for Australian Conditions ............................................... 28 References................................................................................................................ 29
Valuing Air Quality Impacts of Transportation: A Review of Literature
Page ii
List of Tables Table 2.1 Measuring Techniques for Economic Impacts .................................................... 3 Table 2.2 Overview of Sensitivities of the Most Important Cost Categories with their Uncertainty Range........................................................................................... 4 Table 3.1 Characteristics, Causes and Effects by Type of Air Pollution .......................... 5 Table 3.2 Vehicle Pollution Emissions................................................................................... 5 Table 3.3 Health Effects of Air Pollutants and Populations at Risk................................. 6 Table 3.4 Estimated Marginal Damage Costs from CO2 ..................................................... 8 Table 3.5 GHG and Global Warming Potential.................................................................... 9 Table 5.1 Externality Valuation Approach .......................................................................... 13 Table 5.2 Methodologies to Value the External Costs of Transport ............................... 14 Table 5.3 External Cost Measure and Its Definition and Use .......................................... 14 Table 5.4 Study Designs on Air Quality and Health Impacts.......................................... 15 Table 5.5 Approaches to Determine a Monetary Value on the Benefits of Greenhouse Gas Reductions........................................................................................................ 20 Table 6.1 Air pollution related average external health costs for 17 European Countries for the years 1995 and 2010 ................................................................. 22 Table 6.2 Emission Factors (gm/pkt) ..................................................................................... 23 Table 6.3 A ......... Comparison of Estimates of Health, Material and Vegetation Effects ($/kg) .......................................................................................................................... 24 Table 6.4 Costs of Air Pollution, Comparison of Studies................................................. 24 Table 6.5 Marginal costs in US$/kg of a 10% reduction in road-traffic related emissions in the US (1991)..................................................................................... 25 Table 6.6 Calibrated Values of Transport Externality Unit Cost in 2001AUS $ ........... 25 Table 6.7 Assumed Unit Health Costs for Pollutant Emissions in 2003 AUS $ per Tonne of Pollutant .................................................................................................. 26 Table 6.8 Total Economic Costs of Motor Vehicle-related Pollution ($M) in Australian Capital Cities, 2000.................................................................................................. 26 Table 6.9 Total Economic Costs of Motor Vehicle-related Pollution ($M) – Regional Areas, 2000 ................................................................................................................ 26 Table 6.10 Total Economic Costs of Motor Vehicle-related Pollution ($M) Australia, 2000 ............................................................................................................................ 27 Table 6.11 Health Benefits as a Percentage of Overall Benefits in Recent Cost-benefit Studies ............................................................................................... 28
Valuing Air Quality Impacts of Transportation: A Review of Literature
Page iii
List of Figures Figure 5.1 A Process to Quantify Health Impacts................................................................ 18 Figure 6.1 The Composition of Environmental Damages due to Air Emissions from Fuel Combustion in Six Cities.................................................................... 22
Valuing Air Quality Impacts of Transportation: A Review of Literature
Page iv
1)
Overview
Transport emissions are the major sources of air pollution in urban areas. Recent research has established a strong association between serious public health effects (premature mortality as well as morbidity) and air pollution due to transport emissions (see Chapter 4, BTRE (2005) for a review of literature). The issue of health risks posed by the transport sector has become a global environmental concern now and governments in different countries have implemented various policy measures to curb the adverse public health effects related to transport emissions. These measures include mandatory use of unleaded petrol, air quality control through improved engine technology (catalytic converter), regulated emission standard, reduced level of sulphur in diesel fuel and traffic monitoring. In economic analysis, transport emissions related health effects are seen as transport externalities, that is, impacts felt by those who are not direct users of the transport system (say, the society/community living in a busy traffic area - nearby a marketplace or a main road). It is important to know the monetary values of premature mortality and morbidity costs born by the society due to transportation in order to assess the efficacy of both new (proposed) and existing transport network. Over the years, these health effects of air pollution have been quantified extensively by various studies (mostly in developed countries context), where dollar value is assigned to justify and/or monitor the policy measures implemented. This paper attempts to review these studies conducted in relation to transport sector. The purpose of this review paper is twofold: • to identify the issues still need to be discussed and researched for a better and environment friendly transport network • to focus on Australian findings and suggest the priority areas of research in Australian transport context. The paper is organised in six sections. The first section discusses briefly the issues on transport emissions and externalities. The second section covers the literature on impacts of air pollution. The issues of current concern and research focus (in particular, children health) are addressed in the following section. The fourth section takes a look at the valuation methodology where a detailed analysis of the health costs estimation is presented. A discussion on the current practices in the valuation of air quality impacts is carried out in the fifth section. Finally, in its concluding comments, the paper identifies future research direction in the Australian context in the last section.
2)
Transport Emissions and Externalities
The general observation is that transport atmospheric emissions have increased during the 1990s in developed as well as developing countries, particularly in the urban sector, due to sheer growth in traffic volume and increased vehicle-passenger ratio. For example, the share of public transport in the urban areas in Australia accounted for less than 10 per cent of urban trips, Cox (2000). The average vehicle occupancy rate in Australia is around 1.1 persons, which is quite low. A low rate of vehicle occupancy means higher emissions for a given level of passenger kilometres travelled.
Valuing Air Quality Impacts of Transportation: A Review of Literature
Page 1
This upward trend in traffic growth is expected to continue in future as well. Forecasts for 2020 in the European Union (EU) depict a further rise in both passenger and freight transport, PEP-WHO, (2005). This implies increased transport emissions and hence related externalities, that is, health effects of air pollution. Within the transport modes, motor vehicles are the major emitters of air pollutants in urban Australia, contributing more than 75% of the carbon monoxide emissions and most of the oxides of nitrogen and organic compounds, EA (2001) and BTRE (2002). It is observed that water transport (shipping) accounted for 1.1 per cent of transport emissions in 2001-2002, while air transport and rail transport both contributed to only 0.3 per cent in Australian transport scenario. For the same year, road transport was found to emit about 94.4 per cent of transport emissions in Australia.
2.1 What are Externalities? Transport related externalities are impacts felt by those who are not users of the transport system (ie: third parties who are not compensated if they suffer a cost; or asked to pay if they receive a benefit). Examples include environmental impacts (air, water and land pollution; noise; visual intrusion and aesthetic value; and fauna and flora) and energy impacts (where the price paid for energy does not reflect the rate of resource depletion). Rizzi and Ortuzar (2003) defined an externality in economics terms as: ‘Any action taken by an economic agent that has an impact on the utility or on the production function of one or more third agents without incorporating the economics effects of those impacts in his/her private accounting’.
The most discussed transport externalities are public health effects of air pollution due to transport emissions. Additional examples of transport externalities are accessibility, external transportation costs, land use, community liveability, economic development, safety and equity. The most common urban life feature, motor vehicle use by individuals and/or commercial bodies, imposes various external costs including public costs for road and parking facilities, traffic congestion, crash risk, and various environmental damage impacts. As noted in the earlier section, other modes of transport also impose external costs, but generally at a lower rate per trip (Litman, 2000). External costs of transport are important indicators revealing market inefficiencies in the transport sector. They express those costs which are not paid by the users, leading to suboptimal prices and traffic volumes i.e. with prices usually too low, traffic volumes will be too high.
2.2 Quantifying Externalities Quantifying transport externalities has become an increasingly important issue in policy decision making in the developed countries. However, the issue is complex since it has budget implications (particularly, tax and income implications) and other economic considerations. In addition, it involves both methodological issues and considerable uncertainty in its estimated values. In fact, approaches to quantifying health effects as transport externalities pose a major challenge for researchers. This issue is discussed in detail in Section 3.2.
Valuing Air Quality Impacts of Transportation: A Review of Literature
Page 2
A vast size of research literature exists on the valuation of transport externalities. This include studies conducted by Delucchi and Shi-Ling (1996), Litman (2000), Austroads (2003), Austroads (2004), Watkiss (2002), Pratt (2002), Brand & Preston (2002). Air pollution cost has been quantified in terms of damage to health in most of the studies; for example, OECD (1994), Brunekreef (1997), Kunzli, et al. (2000), WHO (2000), Fisher, et al. (2002) and Amoako & Lodh (2003), PEP-WHO (2005). A study by Transfund (2002) provided advice on the valuation of externalities to be used in New Zealand transport project appraisal. In Australia, ATC (2004) and AustRoads (2004) provide some indicative unit costs to convert some externalities, such as vehicle emissions, into monetised values. However, the use of such values is highly qualified: for example, ATC (2004) states, ‘The valuation of externalities is an evolving area of expertise, therefore the values should be treated with caution’.
Some environmental impacts have local, regional and global effects, as well as short and long-term effects (eg: air pollution with its impact on local residents and on global warming). This makes it very difficult to arrive at valuations that capture these effects. Monetary estimates of such impacts have considerable uncertainty and are usually given in fairly wide ranges for each impact dependent on the type of approach used and the specific setting. Litman (2000) conducted research on economic quantification and explored different method for each externality, for instances, accessibility, consumer cost savings, physical activities and health, reduced transportation externalities, land use efficiency, community liveability, economic development, and equity. Measuring techniques for each economic impact are as shown in Table 2.1. Table 2.1 Measuring Techniques for Economic Impacts Economic Impacts Accessibility and savings
Health
External costs
Efficient land use
Livability
Description Ability to reach goods, services and activities. Consumer transportation cost savings. Amount of active transportation and net impacts on public health. Reductions in transportation costs for facilities, congestion, crashes, and environmental impacts. More efficient land use associated with more pedestrian-oriented land use patterns. The quality of the local environment and community interactions.
Measuring Techniques Travel modeling, analysis of travel options, consumer expenditure surveys. Travel and health surveys to determine the number of people who benefit from the transport project. Determine to what degree the transport project reduces motor vehicle travel, and the economic savings that result. Identify the full economic, social and environmental benefits of more pedestrian oriented land use. Property values, business activities, consumer preference surveys.
Valuing Air Quality Impacts of Transportation: A Review of Literature
Page 3
Economic Impacts Economic development
Equity
Description Effects on commercial activity, and shifts in consumer expenditures toward more locally produced goods. Distribution of resources and opportunities.
Measuring Techniques Market surveys and property assessments. Input-output table analysis.
Various indicators of horizontal and vertical equity.
Adapted from: Litman (2000)
However, External cost estimation has to deal with several uncertainties. The reasons are manifold: • The data basis (population, traffic volumes, economic performance), • The physical indicators for damages (accidents, noise exposure rates, emission estimates etc.), • The unit values for the estimation of external costs (basic methodological uncertainties, value transfer procedures etc.). For example, OECD (2003) Report estimating external costs of transport in Central and Eastern Europe, showed the results of some sensitivity calculations of the valuations of individual cost categories. The sensitivities consider reasonable ranges of unit values. Table 2.2 Overview of Sensitivities of the Most Important Cost Categories with their Uncertainty Range. Cost category
Share of total costs
Accident
50%
Relevance for transport means Road
Air pollution (Health Costs)
41%
Road and Rail
3%
Road and Rail
Noise
Sensitivities considered
Range of sensitivities
Risk value (1,5 Mio €) was replaced by 1,0 Mio€, on the other hand by 2,0 Mio €. Long term mortality: 0.46 to 1.83 million Euro.
-33% to +33%
WTP 15 and 45 €/dB(A), reference 30 €/dB(A) 3 % All modes Climate Change Upper and lower bound for scientific shadow rate CO2 (6 and 12 € per t CO2 ). Source: Table 11, External costs of transport in Central and Eastern Europe, OECD Final Report, May 2003.
-35% to +71% -33% to +33% -25% to +50%
Based on mathematical mechanisms, individual ranges cannot just be summed up in order to get an overall range of uncertainty. Some uncertainties can even outweigh themselves.
3)
Identifying Impacts of Air Pollution
3.1 Background Air pollution costs refer to damage caused mainly by motor vehicle emissions. It is because pollution costs imposed by other modes of transport is insignificant, though
Valuing Air Quality Impacts of Transportation: A Review of Literature
Page 4
some studies included rail transport induced air pollution in estimating costs, OECD (2003). This cost estimation includes human health, environmental damage and avoidance actions (such as restrictions on sports and other personal physical activities during air pollution events) resulting from various air emissions produced by motor vehicles, Litman (2002). Levinson et al. (1998) classified the types of air pollution into four categories: photochemical smog, acid deposition, ozone depletion and global warming, where the characteristics, causes and effects of each category are summarized in Table 3.1. Table 3.1 Characteristics, Causes and Effects by Type of Air Pollution Air Pollution Photochemical Smog
Characteristics Occurs low in the atmosphere and at ground level. Seasonal in nature and peaking in the summertime.
Acidic Deposition (Acid Rain)
Most prevalent in Eastern North America and Europe, is found in troposphere. Chlorofluorocarbons (CFCs) makes the layer of ozone become thinner.
Stratospheric Ozone Depletion
Global warming (Greenhouse Effect)
Trace gases in the troposphere absorbing heat emitted by the earth and radiate some of it back, thus warming the global atmosphere.
Causes Tailpipe emissions from automobiles. Ozone (O3), by reaction between Volatile Organic Compounds (VOCs), and Nitrogen Oxides (NOx) and water in the presence of sunlight Sulfer Dioxide (SO2), and Nitrogen Dioxide (NO2) react with H2O to form sulfuric and nitric acid. Chlorofluorocarbons (CFCs)
Man-made pollutants including Carbon Dioxide (CO2), Methane (CH4), Nitrous Oxide (N2O), O3, and CFCs
Effects Health, vegetation and material damages.
Health, vegetation and material damages. More intense ultraviolet radiation towards the earth. Raising the average planetary temperature, resulting in a slight melting of polar ice-caps and a consequent rise in the sea level.
Source: Levinson et al (1998)
Various types of motor vehicle pollution emissions and their impacts were summarized by US EPA (1999a) and ORNL (2000) in Table 3.2. Table 3.2 Vehicle Pollution Emissions Emission Carbon dioxide (CO2) Carbon monoxide (CO) CFCs
Harmful Scale Effects A byproduct of Fuel production Climate change Global combustion. and engines. A toxic gas which Engine Human health, Very local undermines blood’s ability Climate change to carry oxygen. Ozone depletion Global Durable chemical harmful Older air conditioners, to the ozone layer and aerosol climate. Description
Sources
Valuing Air Quality Impacts of Transportation: A Review of Literature
Page 5
Emission
Description
Sources
Fine particulates (PM10; PM2.5)
Inhaleable particles consisting of bits of fuel and carbon. Unburned fuel. Forms ozone. Element used in older fuel additives.
Diesel engines and other sources. Fuel production and engines. Fuel additives and batteries.
Hydrocarbons (HC) Lead
Harmful Effects Human health, aesthetics.
Scale Local and Regional
Human health, Regional ozone precursor. Circulatory, Local reproductive and nervous system. Methane (CH4) A gas with significant Fuel production Climate change Global greenhouse gas properties. and engines. Nitrogen oxides Human health, Local and Various compounds. Some Engine (NOx) ozone precursor, Regional are toxic, all contribute to ozone. ecological damages. Ozone (O2) Major urban air pollution NOx and VOC Human health, Regional problem resulting from plants, aesthetics NOx and VOCs combined in sunlight. Road dust Dust particles created by Vehicle use. Human health, Local vehicle movement. aesthetics. Sulfur Oxide (SOx) Lung irritant, and causes Diesel engines Human health Local and acid rain. risks, acid rain Regional Volatile organic A variety of organic Fuel production Human health, Local and hydrocarbons compounds that form and engines. ozone precursor. Regional (VOCs). aerosols. Toxics (e.g. VOCs that are toxic and Fuel production Human health Very local * benzene) carcinogenic. and engines. risks Sources:
US EPA (1999a) and ORNL (2000); * SCAQMD (2002)
3.2 Health Effects Extensive research on the health effects of air pollution has been carried out in different parts of the world characterised by differing air quality, different pollutant mixes and levels, climate, available civic amenities and differing socioeconomic status of the population. Most of these studies observed that air pollution has an association with both short-term and long-term mortality as well as morbidity effects on the exposed population. Since transport emissions generate and add to air pollution, quantification of the health effects of transport induced air pollution has remained an important research focus in 1990s, COMEP (1998); WHO (1999); Watkis (2002); PEP-WHO (2005). Emissions produced by vehicles and related sources have a variety of effects on human health, varying from eye irritation and nausea to chronic lung diseases, cancer, or heart failure, Marquez et al. (2004). Health effects of air pollutants and populations at risk are summarized as shown in Table 3.3. Table 3.3 Health Effects of Air Pollutants and Populations at Risk Pollutant Sulfur Dioxide
Quantified Health Effects1 Morbidity in exercising asthmatics:
Unquantified Health Effect1
Other Possible Effect1
Population at Risk2
Respiratory symptoms in
Elderly people; sufferers of
Valuing Air Quality Impacts of Transportation: A Review of Literature
Page 6
Pollutant (SO2)
Nitrogen Oxides (NOx)
Particulate Matter (PM) / TSP / Sulfates
Lead
Ozone (O3)
Quantified Health Effects1 Changes in pulmonary function, Respiratory symptoms Morbidity: Respiratory illness
Mortality Morbidity: Chronic and acute bronchitis, Hospital admissions, Lower respiratory illness, Upper respiratory illness, Chest illness, Respiratory symptoms, Minor RADs, All RADs, Days of work loss, Moderate or worse asthma status, (asthmatics) Mortality Morbidity: Hypertension, Nonfatal coronary heart disease, Nonfatal strokes, Intelligence quotient (IQ) loss effect on lifetime earnings, IQ loss effects on special education needs
Unquantified Health Effect1
Increased airway responsiveness
Changes in pulmonary function
Health effects for other age ranges other than those studied, Neurobehavioral function, Other cardiovascular diseases, Reproductive effects, Fetal effects from maternal exposure, Delinquent and antisocial behavior in children Increased airway responsiveness to stimuli, Centroacinar fibrosis, Inflammation in the lung
Mortality Morbidity: Respiratory symptoms, Minor RADs, Respiratory RADs, Hospital admissions, Asthma attacks, Changes in pulmonary function, Chronic sinusitis and hay fever Carbon Morbidity: Behavioral Monoxide Hospital admissions, effects, (CO) Congestive heart failure, Other hospital Decreased time to onset of admissions angina Sources: 1. Gwilliam and Kojima (2003); 2. AATSE (1997)
Other Possible Effect1 non-asthmatics, Hospital admissions Decreased pulmonary function, Inflammation of the lung, Immunological changes Chronic respiratory diseases other than chronic bronchitis, Inflammation of the lung
Population at Risk2 respiratory disease
Sufferers of respiratory disease, such as children with asthma
Elderly people with respiratory and cardiovascular diseases; people with respiratory diseases, such as children with asthma
Children
Immunologic changes, Chronic respiratory diseases, Extrapulmonary effects (changes in the structure or function of the organs) Other cardiovascular effects, Developmental effects
Valuing Air Quality Impacts of Transportation: A Review of Literature
Elderly people; people with respiratory diseases
People with ischemic heart conditions
Page 7
For the quantitative assessment of health effects, WHO (2000) and other international studies suggest that PM10 or SO2 are useful indicators of the health risk of transport sources of ambient air pollution. Their exposure metrics have been used in epidemiological studies throughout the world in the past two decades. The health effects associated with air pollutants in epidemiological studies include mortality and a range of morbidity outcomes including hospitalization for cardiovascular or respiratory disease, emergency room and urgent care visits, asthma exacerbation, acute and chronic bronchitis, restrictions in activity, work loss, school absenteeism, respiratory symptoms, decreased lung function etc. , Ostro (2004). In recent years, quantification of transport related health effects (including premature mortality and respiratory morbidity) has become an important tool to guide the policy decisions in transport and land use policies. These values provide relevant information for the policy makers on the effects (both size and extent) of the intervention on public health.
3.3 Global Warming Of all human activities, driving motor vehicles produces the most intensive Carbondioxide (CO2) emissions and other toxic gases per capita. A single tank of gasoline releases 140 ~180 kilograms of CO2. Over 25% of transportation-related GHG emissions originate from urban passenger travel, Yang (1998). Tol (2000) estimated the external costs of greenhouse gas emissions from transport, that is, marginal damage costs from CO2 using Extern-E approach, see the Table 3.4 below: Table 3.4 Estimated Marginal Damage Costs from CO2 Emission Level Minimum Low Medium High Maximum
Cost per tonne of CO2 equivalent reduction in Euro 0 1 2 4 16
Following the offset approach, the marginal costs of abatement have been estimated for Germany at Euro 19 per tonne of CO2 equivalent, Friedrich (2000). According to the US National Climate Data Center (2001), global temperatures increased by over 1 degree Fahrenheit over the course of the last 120 years, and will likely rise even more during this century. Such abrupt temperature changes will cause a broad range of impacts, Yang (2002): - Sea levels will rise, flooding coastal areas - Glaciers and polar ice packs will melt - Heat waves will be more frequent and more intense - Droughts and wildfires will occur more often - Habitat changes or is destroyed and species will be pushed to extinction. Apart from CO2, other compounds that contribute to the formation of greenhouse gas emissions are as shown in Table 3.5.
Valuing Air Quality Impacts of Transportation: A Review of Literature
Page 8
Table 3.5 GHG and Global Warming Potential Greenhouse Gas Carbon Dioxide (CO2) Methane (CH4) Nitrous Oxide (N2O) Ozone (O3) CFC
Relative Effectiveness 1 70 210 1,800 4,000
Decay Time (years) 120-500 7-14.5 120 0.01 50
Relative Effectiveness in 100 Years 1 15-30 320 3 4,000
Source: Rhode (1988)
The greenhouse effectiveness of a gas in the atmosphere depends, in part, on its concentration. As the atmospheric concentration of a gas increases, the effectiveness of additional gas decreases. The relative effectiveness means the effectiveness of a greenhouse gas relative to carbon dioxide. The relative effectiveness refers to global warming potential (GWP) of a gas relative to carbon dioxide GWP. The decay time is a rough measure of how long the greenhouse gas remains in the atmosphere. If the decay time is 150 years, one-half of the initial amount remains in the atmosphere after 150 years, Yang (2002).
3.4 Other Impacts Apart from health and global warming impacts, transport users may experience some other air pollution impacts including - Exacerbated liveability and environment for local residents, tourists, and visitors that lead to lower economic income from tourism and discourage a new investment - Visual intrusion and decrease in the aesthetic value of scenic view and urban landscape - Lower land and property value - Air pollution from transport industry/factory, especially SO2, contributing to acid rain can damage built structures and vegetation - Air pollution encourages the use of air conditioning indoor (home and/or car), which increases the amount of energy consumption and makes the indoor air quality even worse. However, quantification of both health costs induced by indoor air pollution and nonhealth costs of air pollution still remain grey areas due to identification and separation problem of the air pollutants and their health effects in the estimation methodology.
4)
Current Research Issues
4.1 Estimating Transport Share in the Total Emission Causing Health Effects Transport emissions produce a range of different ambient air pollutants and major pollutants are monitored and measured by the air quality authorities. The relative contribution of each source and type of pollutant can vary every day, depending on meteorological conditions and the quantity from mobile and static sources. In practice, environmental protection authority air quality monitoring stations sample or capture PM10 from all sources including transport and then the transport proportion is
Valuing Air Quality Impacts of Transportation: A Review of Literature
Page 9
determined from this sampled mass concentration of PM10. The derivation of the transport proportion is fraught with several difficulties, Fisher et al (2002) including: • vehicle emission contributions dominate during peak hours but be negligible at night • emissions vary during day of the week—vehicle emissions tend to be lower in the weekend, but more people are outdoors making exposure cases higher • there is seasonal variation in the emissions, particularly, regions with home heating emissions • vehicle emission tend to disperse at the ground level implying more health effects • people exposure to vehicle emissions varies depending on the nature of their life style and work environment. After deriving the transport proportion, measuring the proportion of any major pollutant in the total transport emissions is again very difficult (almost impossible) due to multiple sources of emissions. However, quite a few studies have done this estimation using different methods, Kunzli et al (1999); Nerhagen et al (2003); BTRE (2005); PEP-WHO (2005). The current concern in this context is how to derive the transport share (by modes) as well as pollutant share in the total air pollution. This share is crucial for policy makers as it reflects the social cost burden in dollar values. There are also some questions about which air pollutants should be targeted if we do agree that policy measures need to be taken. There is a widespread consensus that the smaller particles (less than PM2.5) carry the highest cost burden but it is not always clear that the epidemiology has sorted out the interactive effects of multi-pollutant contexts. So long as pollutants are correlated, then a cautious approach would involve selecting just one 'representative' pollutant.
4.2 Estimating Value of Statistical life (VOSL) The conventional evaluation of mortality or the risk of mortality is based on the VOSL estimated using Willingness To Pay (WTP) or Human Capital (HC) approach. The validity of this estimation of VOSL depends on a number of economic assumptions as well as the assumed ‘linearity’ between risk and payment. Though this linearity assumption works well for a small range of the risk of death, it is not a good measure for large ranges of risk levels like mortality induced by air pollution, Bickel (2003). Another issue arises from the evidence suggesting that the WTP for reducing environmental mortality risks is higher than for traffic accidents risks (PEP, WHO 2005). WTP approach does not allow different valuation of life on the basis of age (say, productive adults and non-productive children and olds) due to its ethical reasons. But evidence, Johansson (2002) implies that at least for the aged people above 65 yrs VOSL may be declining. A critical review of more than 60 studies of mortality risk premiums from ten countries and approximately 40 studies that present estimates of injury risk premiums shows that the effects of age on the value of a statistical life is positive, Viscusi and Aldy (2003). The study using meta-analysis indicates an income elasticity of the value of a statistical life from about 0.5 to 0.6. A later study by Viscusi and Aldy (2004) finds that workers’ value of statistical life exhibits an inverted U-shaped relationship over workers’ life cycle based on hedonic wage model estimates, age-specific hedonic Valuing Air Quality Impacts of Transportation: A Review of Literature
Page 10
wage estimates, and a minimum distance estimator. The value of statistical life for a 60year old ranges from $2.5 million to $3.0 million – less than half the value for 30 to 40year olds. Another study supporting different pattern for the VSL over the life cycle, with the VSL being roughly constant until the age of 40 but sharply dropping at older ages is carried out by Cropper et al (1994). This study reported the results of surveys of over 3,000 respondents given choices between various pairs of life-saving activities. It found that for the median respondent, saving one 20-year-old is equivalent to saving seven 60-yearolds, while saving the lives of 20-year-olds and 40-year-olds are viewed similarly. Some studies have used this approach in quantifying the mortality cost of air pollution related to motor vehicle emission by reducing the total VOSL by an acceptable percentage. For example, BTRE (2005) used a VOSL reduced by 30% to reflect the difference of age pattern between traffic accidents fatalities and emission mortalities. So, the obvious question arises whether in estimating the value of VOSL, should every year of life have the same value or should the years after productive age (say, above 65) count less. This is mainly an ethical question with an economic implication, which needs to be addressed. So far, different studies have dealt with this question differently, PEPWHO (2005). A related question would be to define the productive age: is it 55 or 60 or 65 and so on.
4.3 Quantifying Acute Health Effects Over the past two decades, the emergence of large body of literature on the health effects of air pollution using time-series analysis (spanning five different continents) has demonstrated associations between daily counts of mortality and daily or multi-day changes in air pollution, Morgan et al (1998), Petroeschevsky et al (2001) etc. (see Table – 5.4). Time series studies provide estimates of the cases of premature mortality in the short term (say, daily) due to acute exposures to air pollution. With increasing statistical sophistication, these studies have shown that either one-day or multi-day averages are associated with both total and cardiopulmonary mortality. However, in spite of these studies providing a clear lower bound on mortality effects, there is limited evidence of what period of life is 'lost' due to exposure to air pollution. It is known now that acute air pollution tends to have its major effects on older people. But, the questions arise: • what is the period of life lost by this group, and • how would that period of life lost be valued? Recent evidence suggests the period life lost, i.e. the time at which death would otherwise occur, could be a matter of days only, Maddison (2000), due to acute exposure. If this is true, there is an issue for economic valuation, namely, what is the correct notion of economic value to apply and what are the implications for policy.
4.4 Quantifying Chronic Health Effects Though not large, we still have quite a few studies on valuing chronic effects of air pollution, i.e. reduced life expectancy due to the health effects of fairly continuous
Valuing Air Quality Impacts of Transportation: A Review of Literature
Page 11
exposure over long periods of time, Pope et al (1995); Künzli et al. (2000); and BTRE (2005). The results of these studies appear to be consistent in suggesting that life expectancy is reduced by a few months to a few years, Brunekreef (1997) and Pope (2000). For example, Maddison (1998) applies the same US methodology, Pope et al (1995) to the UK for an hypothetical wholesale elimination of particulate matter, and estimates that the change in the conditional life expectancy of the 80+ age group is 1.1 months; that for the 70-79 age group is 2.1 months, and the 60-69 age group is 3.0 months. Rabl (2000), again using the same studies, estimates that a 50-70% reduction in particulate matter (PM2.5)(about 10 ug/m3) would decrease loss of life expectancy in the European Union and the USA by around 6 months. Generally cohort studies (see Table 5.4) are used to quantify chronic health effects of air pollution. The WHO working group (2000a) concluded that cohort studies provide the most complete estimates of both the number of deaths attributable to air pollution and the average reduction in life span associated with air pollution exposure. The question is, then, what needs to be valued in economic terms of the periods of life expectancy lost. This raises the issue of whether we should be using the 'value of a statistical life' (VOSL) or the value of a life year lost (VOLY). The issue arises of how to place economic values on life expectancy reduced by chronic exposure. Using VOSLs to derive VOLYs may not be justified and this means we need studies that value life expectancy changes, Pearce (2001).
4.5 Valuing Children Health Effects Children are more vulnerable to ambient air pollutants due to greater relative exposure, immature metabolism and developing stage of physiology, Kleinman (2000); MathieuNolf (2002); and Gauderman et al (2002). Results from several studies have consistently indicated that neonatal or early post-neonatal (1-12 months) exposure to air pollution contributed to mortality due to respiratory causes, PEP-WHO (2005). Quite a few studies have found evidence on a higher prevalence of respiratory symptoms among children living near motorways or freeways, and also a higher prevalence of chronic coughing, wheezing, asthma attacks and rhinitis in areas with higher truck traffic density, Oosterlee et al (1996); van Vliet et al (1997); van Der See et al (1999); Venn et al (2001); and Lin et al (2002). A strong statistical association has been observed between decreased lung function of children living near motorways and increased air pollution levels from truck and motor vehicle traffic, Brunekreef et al (1997) and Nakai et al (1999). Findings from the international collaborative study on the impact of Traffic-Related Air Pollution on Childhood Asthma (commonly known as TRAPCA) confirmed the association between traffic-related air pollution and coughing in children under two years of age, Gehring et al (2002). Given this background, it is necessary quantify – assign a dollar value - the health costs and reduced life expectancy costs of the children from transport emissions. So far, no economic evaluation is available for the VOSL or VOLY for the children. The international practice is to apply the same cost as for the adults, until child-specific values are available, PEP-WHO (2005). Other challenges regarding quantifying children health effects are:
Valuing Air Quality Impacts of Transportation: A Review of Literature
Page 12
• • •
how to estimate the quantitative relationships between exposure and health effects (exposure response function) how to choose pertinent health effects in children how to put a dollar value on the effects of physical, mental and social health and well being of the children.
4.6 Estimating Health Costs of Indoor Air Pollution Most of the studies quantifying cost of air pollution are conducted for outdoor pollution. However, comparative risk studies conducted in recent years by the United States Environmental Protection Agency and its Science Advisory Board have consistently ranked indoor air pollution among the top five environmental risks to public health, Ezzati & Kammen (2001). The most important compounds in indoor air environments include suspended particulate matter, sulfur dioxide, nitrogen oxides, carbon monoxide, photochemical oxidants (as ozone) and lead – a large portion of these pollutants coming from vehicle emissions. Moreover, indoor sources may lead to an accumulation of some compounds rarely present in ambient air. In developed countries, pollutant concentrations indoors are similar to outdoor concentrations, with the ratio of indoor to outdoor concentration ranging from 0.7 to 1.3. Poor indoor air quality can result in significant adverse effects on our health and environment including a significant cost burden to the economy. The Commonwealth Scientific and Industrial Research Organisation estimates that the cost of poor indoor air quality in Australia may be as high as $12 billion per year, Brown (1998). The issue in this context is twofold: • how important is indoor air pollution in the context of transport externalities, and • how to quantify the social cost burden of the indoor air pollution due to transport emissions.
5)
Valuation Methodology
5.1 Overview The emergence of a large body of literature in last two decades on valuing transport externalities has brought various methodologies on board for discussion. The following approaches, as shown in Table 5.1, have been put forward to value externalities, Blum (1998): Table 5.1 Externality Valuation Approach Approach Resource Valuation (Damage Cost Approach) Avoidance Valuation (Avoidance Cost Approach) Risk Approach Contingent Valuation (Utility Approach)
Methodology By the corresponding resource price (e.g. Prices for damage or repair) By the possibility of substituting the resource for one without the externality impact By the discounted expected monetary value based on an evaluation of risk By the willingness to pay in order to reduce negative effects*.
Valuing Air Quality Impacts of Transportation: A Review of Literature
Page 13
Source: Blum (1998); * Stated preference surveys are usually undertaken to derive values which reflect how much individuals are willing to pay to benefit from or to avoid an impact. This method is used for air and noise pollution valuations.
Revealed preference (RP) and stated preference (SP) data are generally collected from attitudinal surveys. The ultimate goal is to design appropriate valuation techniques to derive willingness to pay (WTP) measures for reducing each of the externalities, Nash (1997). NSW EPA (1995) and Tsolakis and Houghton (2003) classified the methodologies to value the external costs of transport into three categories as shown in Table 5.2. Table 5.2 Methodologies to Value the External Costs of Transport Approach Market Based
Surrogate Market Based Opinion Based
Methodology By costs and prices from conventional markets Damage Costs: The actual costs of damages or of repairing the damage Avoidance Costs: The cost of preventing the damage By proxies such as changes in property values (hedonic pricing) in areas of high traffic noise or extreme air pollution By responses to surveys or expert opinions (willingness to pay for an environmental gain or for acceptance of an environmental loss) by a range of stated preference techniques.
Sources: NSW EPA (1995) and Tsolakis and Houghton (2003)
In general, tangible costs such as medical treatment costs are assessed using marketbased methods. Intangible costs, such as loss of quality of life or pain and suffering, are better assessed by opinion-based techniques. If local data are not available, benefit transfer methodologies can be employed to take data from another time and/or place and recalibrate it for local conditions. Several external cost measures are taken into the evaluation, Marquez et al. (2004), as shown in Table 5.3. Table 5.3 External Cost Measure and Its Definition and Use Measure Total external costs Average external costs (per traffic unit) Average external costs (per ton-km unit) Marginal external costs Short run marginal costs Long run marginal costs
Definition and Use All externalities in a specified place over a specified period Comparison between situation or modes Comparison between freight alternatives Costs of adding one extra unit to the traffic being evaluated Consider just the additional variable cost of operation Also include fixed costs of running, or the costs over the extended system
Source: Marquez et al. (2004)
Average cost often serves as a proxy for marginal costs where the cost of each extra unit of supply is not known. The choice of methodology depends on type, availability, quality plus scope and scale of data. Top down approaches are used to allocate aggregate costs and particularly useful when comparing impacts in different places since they give a consistent method. In contrast, bottom up analysis of detailed data is best for in-depth analysis of impacts in specific areas, Marquez et al. (2004).
Valuing Air Quality Impacts of Transportation: A Review of Literature
Page 14
5.2 Health The review of the literature suggests that epidemiological studies, that establish doseresponse relationships linking environmental variables to observable health effects, formed a major part of the research on air quality and health in the 1990s. However, megaanalysis and chamber studies have recently become more popular. All of the study designs are summarised in Table 5.4. Table 5.4 Study Designs on Air Quality and Health Impacts Categories
Description
Research Studies
Epidemiological studies including:
(Association between the incidence of diseases (effects) and risk factors and the level of pollutants in the air.)
Early studies
Association between air pollution exposure and excess mortality rates.
Brimblecombe (1987); Chinn et al (1981); Bell and Davis (2001)
Time series analysis
Correlation between daily changes in pollution and changes in health. The analysis considers confounding factors such as season, temperature and day of the week Disadvantages: It cannot establish the causal nature of the associations demonstrate.
Katsouyanni et al (1995); Schwartz et al (1996); Schwartz (1997 and 1999); Anderson et al (1996); Touloumi et al (1996 and 1997); Burnett et al (1998a and b); Samet et al (1995, 1997 and 1998); Sartor et al (1997); Borja-Aburto et al (1997); Simpson et al (1997); United Kingdom Committee on the Medical Effects of Air Pollutants (1998); Streeton (1997); Bascom et al (1996); Wordley et al (1997); Morgan et al (1998a and b); Denison et al (2000); Prescott et al (1998); Sheppard et al (1999); Morris and Naumova (1998); Yang et al (1998); Petroeschevsky et al (2001); Pope et al (1995b)
Cohort studies
Conduct the study on clearly defined populations over a period of time. They include not only the deaths caused by short-term but also long-term exposure. Cohort studies are suitable for a sufficiently large number of population over a reasonably short period. Disadvantages: Very expensive and time consuming.
Henry et al (1991b); Dockery et al (1993); Pope et al (1995a and 2002); Abbey et al (1999); Krewski et al (2000); Brunekreef and Holgate (2002)
Valuing Air Quality Impacts of Transportation: A Review of Literature
Page 15
Categories
Description
Research Studies
Panel studies
Short-term studies, conducted on volunteers on a daily or weekly basic, provide data on health endpoints and objective measures of lung or cardiac function. They are usually large and collaborative, and generally take a multi-country analytical approach.
Atkinson et al (2001)
Case control studies
A group of subjects with a particular health effect is compared with a group of subjects without any health effect. Both groups are exposed to the same air pollution levels and pollutant effects are investigated as an exposure-response function.
Nyberg et al (2000); Miyao et al (1993)
Chamber studies
Analyse the mechanism by which exposure to individual air pollutants affect human and animal health but do not examine either the mixtures or temporal variation that occur in natural exposures.
Samet et al (2001); Schelegle et al (2003); Holz et al (2002); Nel et al (1998); Brunekreef and Holgate (2002)
Meta-analysis
Reduce the uncertainty associated with individual study by using the statistical pooling of results from several studies to obtain aggregate values. It recognizes the inherently stochastic properties of the estimation process so it seeks to estimate the mean and variance of the ‘mother’ distribution. It is the basis for extrapolating doseresponse relationships to the situations where no specific epidemiological study has been done.
Ostro (1994 and 1996); Pope and Dockery (1994); Schwartz (1994)
Source: BTRE (2005)
A WHO working group (2000) examined methodological issues related to the health impact assessment of air pollution. The group concluded that cohort studies provide the most complete estimates of both the number of deaths attributable to air pollution and the average reduction in life span associated with air pollution exposure. However, the group agreed that time series studies would continue to play an important role in understanding exposure–response relationships. It also identified sensitivity analysis as having a critical role in bringing across the uncertainty of the impact estimates, BTRE (2005). Economic valuation involves three important steps, WPRO (2004): - Establish average levels of ambient PM10;
Valuing Air Quality Impacts of Transportation: A Review of Literature
Page 16
-
Relate these levels to mortality and morbidity statistics of respiratory and cardiovascular diseases; and Apply unit economic values. The basic equation of deriving the total economic cost (TEC) of PM for each outcome variable is: TEC = change in ambient concentration x exposure-response coefficient x population at risk x unit economic value
A number of methodological issues, raised by the valuing of health impacts of pollution, fall into two groups: (a) the actual identification and measurement of health impacts; and (b) estimating monetary values for associated mortality (death) and morbidity (illness), Lvovsky (1998). CEC (1995) developed a methodology known as the Impact Pathway Approach for quantifying the costs due to airborne pollutants in the ExternE project series. It comprises the following steps: emission estimation, dispersion and chemical conversion modelling, calculation of physical impacts, and monetary valuation of these impacts. For the calculation of the costs of direct emissions from vehicle operation, emission inventories in spatial disaggregation are needed. For each emission inventory, Europe-wide impacts are calculated and subtracted from impacts resulting from a reference inventory without these emissions. This procedure using a reference inventory is required, because of air chemistry processes where “background” emissions play an important role. Besides emission data, the distribution of the population over space is the second central input for the calculations of the most important costs of air pollution, i.e. the health costs, O’Mahony et al. (2005). In summary, a process to quantify health impacts of air pollution is illustrated in Figure 5.1.
Valuing Air Quality Impacts of Transportation: A Review of Literature
Page 17
Figure 5.1 A Process to Quantify Health Impacts Other Sources
Transport Sources
Emissions (pollutants) Emission Factor for - Fuel - Vehicle - Load - Speed
Dispersion
Receptors
Exposure-Response Analysis
Relative Risk Health outcome cases
Economic valuation
Application of unit costs Total economic cost
Source: BTRE (2005)
The approach follows the European concept often referred to as the ‘dose-response’ or ‘impact pathway’ (AEA Technology (2002); World Health Organization - WHO (2000)). In Australia, The Commonwealth Industrial and Scientific Research Organisation airshed model, The Air Pollution Model, is applied to predict air pollutant concentration in the atmosphere, Hurley (2002). The approach involves the following steps, BTRE (2005): - assessing and quantifying emissions from the pollutant source (motorised vehicles) - assessing the resulting air pollution concentrations in the surrounding area - assessing exposure-response functions that link health cases e.g. respiratory and cardiovascular disease to pollutant increments - valuing health cases using economic values of human life derived by either the willingness-to-pay or human-capital approach.
5.2.1
Mortality
There are a number of parameters which is used for quantifying the value of mortality. These include, Lvovsky (1998): •
Value Of a Statistical Life (VOSL) – defined by individual actions in which people trade money against a small reduction in personal safety can be used to infer the value of a statistical life (VOSL). The VOSL is estimated using Hedonic Wage Analysis (HWA).
Valuing Air Quality Impacts of Transportation: A Review of Literature
Page 18
•
Human Capital Approach (HCA) – is the present value of future income. There is a substantial literature on the valuation of life that relies on HCA. BTRE (2002 and 2005) has estimated VOSL using this approach. Seemingly straightforward, valuation using HCA in developed countries is considered as ‘conservative’ since it gives an ‘at least’ value. However, the application of HCA to developing countries can still be problematical due to distorted wages, cross subsidization of public services, difficulties with valuing various homemaking services and high unemployment rates.
•
Expected Loss of Discounted Life Year, Moore and Viscusi (1988) – reflects the remaining years of life.
•
Disability-Adjusted Life Years (DALYs) – this is a standard measure of the burden of disease, which combines life years lost due to premature death and fractions of years of healthy life lost as a result of illness or disability, WDR (1993) and Murray and Lopez (1996). A weighting function that incorporates discounting is used for years of life lost at each age, to reflect the different social weights that are usually given to the illness and premature mortality at different ages.
•
Contingent Valuation Method (CVM) – This is a survey method whereby respondents are asked how much they would be Willing-To-Pay (WTP) to reduce the occurrence of disease (morbidity) and to reduce the risk of death (mortality).
•
Benefits Transfer (BT) - is a method by which unit economic values estimated in a developed country are transferred to a developing country. Life Expectancy involves: ¾ estimating the change in life expectancy by age group implied by the change in ambient particulates; ¾ establishing a WTP for the change in life expectancy by age group; and ¾ multiplying these two values with each other and by the population in each age group, and adding up.
•
The point to be noted here is that assigning a value to human life can cause community discomfort and policy maker problems, since valuation vary so obviously. For example, Australian studies vary from a low of $1 million though a median of 5 million to a high of $12 million per fatality, Marquez, et al. (2004).
5.2.2
Morbidity
Air pollution affects human morbidity, and the valuation of illness and disability is very important to assessing the social costs and cost-benefit analysis of control measures. Methods employed for valuing morbidity include, Lvovsky (1998): - Value Of a Statistical Life (VOSL) - Disability-Adjusted Life Years (DALYs) - Contingent Valuation Method (CVM) - Benefits Transfer (BT) (These four methods above have been explained earlier in Mortality section)
Valuing Air Quality Impacts of Transportation: A Review of Literature
Page 19
-
-
-
Cost Of Illness (COI) - uses estimates of the economic costs of health care and lost output up to recovery or death. These comprise the sum of direct costs (hospital treatment, medical care, drugs, and so on) and indirect costs, which is the value of output lost, usually calculated as the wage rate multiplied by lost hours, and often using an imputed wage for home services. Health Status Index - attempts to measure individuals' perceptions of the Quality of Well-Being (QWB) on a cardinal scale from 0 (death) to 1 (perfect health). Valuation of Chronic Bronchitis – as Chronic Bronchitis (CB) is the most severe morbidity endpoint, for which the dose-relationship is established, Abbey et al (1999). This may be done by contingent valuation analysis, Viscusi et al. (1991) and Krupnick and Cropper (1992).
Concerning the appropriate relative risk ratio for the calculation of health effects, a series of Exposure-response functions are recommended, such as, Lvovsky (1998): - Respiratory Hospital Admissions (RHA), - Cardiovascular Hospital Admissions (CHA), - Emergency Room Visits (ERV); - Chronic Bronchitis (CB); - Bed Disability Days (BDDs), - Restricted Activity Days (RAD), - Asthma Attack (AAs), - Acute Respiratory Symptoms (ARS), and - Lower Respiratory Illness in Children (LRI). There are far fewer exposure-response studies for morbidity, due to exposure to air pollution, which makes the available meta-analytical estimates less robust as compared to the mortality effects. However, the morbidity effects account for more than half of the overall burden of the health costs due to air pollution. The largest portion of the morbidity costs falls on new cases of chronic bronchitis, which, according to some studies, even exceed the economic costs of premature death due to air pollution (see, for example, US EPA (1997)), Lvovsky (1998). Recent studies are generally attributing a higher cost to pollutant emissions and particularly PM emissions, than earlier studies. This may reflect more recent scientific research, which measures the longer-term rather than shorter-term impact of air pollutants on health with a better understanding of the mechanisms of effects (see for example, Amoako et al. (2003) and Fisher et al. (2002)).
5.3 Global Warming As shown in Table 5.5, three approaches are adopted to determine a monetary value on the benefits of greenhouse gas reductions, Clinch (1999): Table 5.5 Approaches to Determine a Monetary Value on the Benefits of Greenhouse Gas Reductions Approach Damage-Avoided Approach (Damage Cost Approach) Offset Approach
Methodology Value a tonne of carbon not emitted by the cost of the damage that would have been done by global warming in the event that it had been emitted. Measure the value of not emitting a tonne of carbon using one method, by the next cheapest alternative method.
Valuing Air Quality Impacts of Transportation: A Review of Literature
Page 20
Approach Avoided-Cost-of-Compliance (Control Cost Approach)
Methodology Measure the tonne of saved carbon by the avoided cost of compliance with a global/regional CO2 emission’s regional agreement.
Source: Clinch (1999)
5.4 Other Impacts There is little research on quantifying other air pollution impacts. Clue (2004) conducted a study on evaluating the economic cost of visibility impairment. Visibility has been defined as ‘the greatest distance at which an observer can just see a black object viewed against the horizon sky’, which in metric terminology is known as the visual range, Malm (1999). The established links between air pollution and visibility impairment were recently examined in detail by Watson (2002). The science of visibility is also well documented by Malm (1999). A number of studies on quantifying economic value on visibility are based on the following methods, Clue (2004): - Revealed or stated Preference survey techniques - Contingent Valuation Method of Analysis (CVM) – this is the most widely used methodology - Hedonic Price Analysis, Delucchi et al (2002) and Beron et al (2001) - Contingent Choice, Haider et al (2002). To date, information and data obtained from this US research provides the bulk of research available. Three studies in particular have been widely referenced in assessing the economic value of visibility: McClelland et al (1993), Chestnut and Rowe, (1990) and Chestnut and Dennis (1997). US EPA (1999b), derived visibility values for residential visibility and recreational visibility separately, and used the logarithmic model. In addition, WTP can be derived as a function of baseline visibility, the magnitude of improvement, location and household income. For example, for in-region recreational visibility, WTP is calculated, US EPA (1999c). The negative impact of air quality deterioration on local and regional economic output has received little attention. The impact on tourism related employment and revenues through loss of air quality has not been quantified.
6)
Empirical Evidence on Valuation of Air Quality Impacts
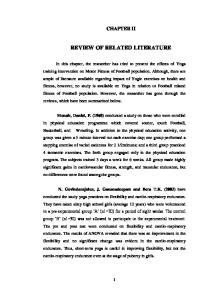
6.1 International Practice The World Bank undertook a study that assessed the magnitude of various damages in urban areas that may be attributed to different fuels, sectors and pollutants, Lvovsky et al., (1998). The damages considered in the study include: the adverse health effects of exposure to air pollution in urban areas; local non-health effects, i.e. reduction in visibility, soiling and material damages; and global climate change impacts. The analysis was applied to six large cities in different parts of the world suffering from the high
Valuing Air Quality Impacts of Transportation: A Review of Literature
Page 21
levels of air pollution -- Bangkok, Thailand; Krakow, Poland; Manila, Philippines; Mumbai, India; Santiago, Chile; and Shanghai, China. These cities differ in geographical and climatic conditions; demographic characteristics; fuel mix and use patterns; sectoral composition; and income levels; and thus together represent a span of different factors affecting the magnitude of the environmental costs of various fuel uses. Therefore, the evidence emerging from this exercise is likely to be representative of the typical situation in many urban areas of developing countries. The social costs of all environmental impacts assessed in the study reach US $ 3 billion, with health impacts being the predominant portion of the costs for each city. Figure 6.1 shows the shares of the health, ‘local’ non-health, and climate change impacts of the study, Lvovsky (1998). Figure 6.1 The Composition of Environmental Damages due to Air Emissions from Fuel Combustion in Six Cities Non - Health Costs 8 % Climate Change Costs
Health Costs 64 %
28 %
Source: World Bank estimates, Lvovsky, et al. (1998)
6.1.1
European Practice
The UNITE research project is an EU funded aimed to provide information about the costs, benefits and revenues of all transport modes including environmental and social costs. The project involved compiling accounts for 17 countries across Europe including Germany; Switzerland (TRANCHE A, Link et al. (2002)), Austria; Denmark; Spain; France; Ireland; Netherlands; UK (TRANCHE B, Link et al. (2003a)), Belgium; Finland; Greece; Hungary; Italy; Luxembourg; Portugal; and Sweden (TRANCHE C, Link et al. (2003b)) with each country having its own set of accounts in such a format those comparisons, where possible, could be made. Air pollution related average external health costs for 17 European countries for the years 1995 and 2010 are presented in Table 6.1. Table 6.1 Air pollution related average external health costs for 17 European Countries for the years 1995 and 2010 Euro per 1,000 passkm/tonne-km Average Costs (1995) Average Costs (2001) Source: Infras/IWW (2000)
Car 13.9 12.9
Motor-cycle 6.6 11.6
Motor Vehicles Bus 15.3 16.9
LDV 114.9 98.9
HDV 26.7 26.7
O’Mahony et al. (2005) compared transport costs in Ireland with some of other European countries examined in the UNITE project. In the case of Ireland, estimates of emissions
Valuing Air Quality Impacts of Transportation: A Review of Literature
Page 22
are made by the Environmental Protection Agency (2001) using an energy balance model for fuel used in all road vehicles. For the global warming calculations, the input data for the calculation of the costs of CO2 are made using fuel consumption data and from information on energy consumption and the electricity production mix (rail), O’Mahony et al. (2005). The costs of air pollution for 1998 road transport were calculated in the ExternE project series, CEC (1995). The method for calculating costs of global warming due to CO2 emissions basically consists of multiplying the amount of CO2 emitted by a cost factor. Due to the global scale of the damage caused, there is no dependency on how or where the emissions take place. A European average shadow value of €20 per tonne of CO2 emitted was used for valuing CO2 emissions within UNITE. This value represents a central estimate of the range of values for meeting the Kyoto targets in 2010 in the EU based on an evaluation by Capros and Mantzos (2000). They report a value of €5 per tonne of CO2 avoided for reaching the Kyoto targets for the EU, assuming a full trade flexibility scheme involving all regions of the world. For the case that no trading of CO2 emissions with countries outside the EU is permitted, they calculate a value of €38 per tonne of CO2 avoided. Fahl et al. (1999) estimate €19 per tonne of CO2 for meeting a 25% emission reduction from 1990 to 2010 in Germany, Link et al. (2003a).
6.1.2
United State Practice
The literature on the VOSL, or Willingness-To-Pay (WTP), is relatively well-developed and there exist several analyses in which the empirical estimates, mainly from the US, are reviewed, such as Miller (1990), Viscusi (1992, 1993) and TER (1996). The two most complete surveys of the existing literature suggested a mean VOSL of US$ 3.6 million, IEI (1992) to US$ 4.8 million, US EPA (1997), in 1990 dollars. Small and Kazimi (1995) developed corrected emission factors as shown in the rightmost three columns in Table 6.2, while an estimate of pollution per unit output shown in the left two columns of Table 6.2, was produced by combining the total emissions with an estimate of passenger kilometres travelled by jets and Highway in the United States, GAO (1992). They also analysed the costs of air pollution from cars in the Los Angeles region. The evidence on mortality and morbidity and its association with pollutants (VOC, PM10, SOx, NOx) was reviewed and various exposure models of the Los Angeles region were combined with health costs. A value of life of US$4.87 million was put into the baseline assumptions. Table 6.2 Emission Factors (gm/pkt) Jets (1) Passenger km travelled Pollutant: CO VOC NOx SOx PM10 C
Highways (1)
5.8 x 10¹¹
5.4 x 10¹²
0.28 0.093 0.13
6.053 0.95 1.11
100
46
Gasoline Car (2)
Light-duty Diesel Truck (2)
8.125 2.348 0.787 0.038 0.024
Valuing Air Quality Impacts of Transportation: A Review of Literature
1.000 0.226 0.933 0.076 0.247
Heavy-duty Diesel Truck (2)
5.828 1.472 9.801 0.360 1.474
Page 23
Note: pkt = passenger kilometre travelled; data for 1989: VOC = volatile organic compounds, CO = carbon monoxide, NOx = nitrous oxides, SOx = sulphur oxides, PM10 = particulate matter, C = carbon Sources: (1) GAO (1992), Bureau of Transportation Statistics (1994), carbon information from Energy Information Administration (1994); (2) Small and Kazimi (1995), 1992 fleet average, (gm/km) from EMFAC7F, updated for VOC underestimate by 2.1.
Levinson et al. (1998) compared the health cost estimated by Small and Kazimi (1995) with the one estimated by Fuller et al. (1983) and Pace (1990) using a US$2.7 million value of life for consistent comparison with their accident data. Fuller et al. (1983) and Pace (1990) also estimated material and vegetation damage from air pollution. Table 6.3 shows a comparison of estimates of health, material and vegetation effects in $/kg. It demonstrated that particulate matter (PM10) is a primary cause of mortality and morbidity costs, followed by morbidity due to ozone. In addition, SOx and NOx are the primary source of material and vegetation damages, respectively. Nordhaus (1994) made his effort in estimating a ‘carbon tax’, which would be the price of damages from pollution, by using a macro-economic/global climate model. The model was adopted to estimate the appropriate tax at a given point of time to optimize the amount of pollution, trading off economic costs of damages due to greenhouse gases and the damages due to imposing the tax. The results showed that $5.29 in tons of carbon equivalent for the 1990s was the appropriate value. Later, environmentalists proposed a range of carbon taxes from $5.80 / tonne to $179.40 / tonne, IBI (1995) which was relatively much higher. However, their estimate consider only the cost of damage without concerning the economic burden imposed by the new tax or the changes in behaviour required to obtain the equilibrium, Levinson et al. (1998). Table 6.4 shows a comparison of some European and US studies in the costs of air pollution. Table 6.3 A Comparison of Estimates of Health, Material and Vegetation Effects ($/kg) Pollutant Fuller CO VOC + NOx SOx PM10
n.a. $1.22 $0.84 $1.20
Health Damage Ottinger Small and Kazimi n.a. n.a. $1.64 $3.04 $4.61 $13.82 $0.94 $12.85
Material Damage
Vegetation Damage
Fuller
Ottinger
Fuller
Ottinger
$0.0063 $1.19 $1.60 $1.03
n.a. $0.03 $0.31 $0.00
n.a. $0.025 $0.0019 n.a.
n.a. $0.03 $0.00 $0.00
Sources: Fuller et al. (1983), updated to 1995 US dollars using medical care inflation rate: Pace (1990), updated from 1990 Canadian to 1995 US dollars; Small and Kazimi (1995), in 1995 US dollars, Los Angeles region; $2.7 M Value of Life.
Table 6.4 Costs of Air Pollution, Comparison of Studies Mode Cars Trucks Passenger Rail Freight Rail Air Shipping
Hansson/ Markham 0.43 – 1.44 1.03 – 1.71 0.17 – 0.37 0.22 1.08 0.20
Kageson/ T&E* 0.47 – 1.86 0.50 – 0.71 0.08 0.08 0.70 -
Planco 2.26 1.48 0.13 0.20 0.22
Swiss MoT 0.15 1.69 0.00 0.00 -
INFRAS/ IWW 0.35 – 1.33 0.52 – 2.77 0.08 – 0.44 0.03 – 0.15 0.18 – 1.09 0.15 – 0.91
Note: All costs, 1995 US cents per pkt or per tkt. Source: IBI (1995), exhibit 3.4., Infras/IWW (1995) T&E = Study for Ministry of Transport and Environment.
Valuing Air Quality Impacts of Transportation: A Review of Literature
Page 24
The marginal costs of a 10% reduction in road-traffic related emission of air pollutants in the US for 1991 are presented by Delucchi (2000) in Table 6.5. Table 6.5 Marginal costs in US$/kg of a 10% reduction in road-traffic related emissions in the US (1991) Health Costs Vehicle emissions, road dust, and upstream emissions Low High 0.01 0.1 1.5 22.08 1.45 31.69 4.4 35.28 0.13 1.25 0.02 0.12
Emission Chemical Component CO NOx PM10 SOx VOC VOC + NOx (O3) Source: Delucchi (2000)
6.2 Australian Practice Tsolakis and Houghton (2003) present estimates of transport externalities in Australia, using the Benefit Transfer method, calibrated from the European Infras/IWW (2000)1 and ExternE2, European Commission (1999), studies. Values from five countries, Denmark, Ireland, Greece, Portugal and Spain, are selected on the basis of characteristics similar to Australia, including the percentage of population residing within urban areas, the level of economic development characterised by purchasing power parity, and similar population weighted urban densities. In addition, the level of “vehicle intrusiveness” (in urban vehicle-km per hectare of urbanised land) is similar between these countries. The actual calibration process depended on the externality considered. For externalities such as air pollution, health effects, and noise, three factors relating to car occupancy, population density, and economic conditions are used. For other externalities (such as climate change), the procedure includes only adjustment for car occupancy. More specifically, a population weighted population-density ratio has been used in preference to simple population density ratio, and a Purchasing Power Parity (PPP) ratio is used in preference to Gross Regional Product (GRP) per capita. These estimates are presented in Table 6.6 based on the latest health cost estimates derived for Australian conditions by Watkiss (2002) in Table 6.7. The separate unit health cost estimates vary according to population densities (Bands 1 to 4), CSIRO, BTRE, ABARE (2003). Table 6.6 Calibrated Values of Transport Externality Unit Cost in 2001AUS $
Air Pollution (human health effects) Climate Change
Vehicle Calibrated* Estimated* * Calibrated* Estimated**
A $ / 1,000 passenger km Car Motorcycle Bus 19 6 22
A $ / 1,000 vkt Car Bus 21 270
A $ / 1,000 tkm LDV HDV 100 22
19
6
22
21
270
100
22
47 13
30 8
30 8
60 17
355 100
150 42
16 4
Source: Tsolakis and Houghton (2003)
1
2
Infras/IWW (2000) provides estimates of climate change avoidance costs. It is based on a specific emission reduction target and calculates a marginal avoidance cost to reach the specified target. The ExternE methodology is based on the ‘impact pathway’ approach, which produces estimates of damage costs.
Valuing Air Quality Impacts of Transportation: A Review of Literature
Page 25
Notes: * The ‘calibrated’ values are based on the Infras/IWW climate change abatement cost of €135 per tonne CO2 (which is based on a 50% emissions reduction target). ** The ‘estimated’ values are based on an EU abatement cost of €38 per tonne CO2 (which is based on the Kyoto Protocol emissions reduction target of 8%). Air pollution, noise and urban separation costs are mostly relevant to urban areas.
In Australia, the motor vehicle proportion of PM10 emission is highest in Southeast Queensland (31%), followed by Sydney-Newcastle-Wollongong in New South Wales and Port Phillip Region in Victoria (28 and 20 %, respectively), BTRE (2005). Table 6.7 Assumed Unit Health Costs for Pollutant Emissions in 2003 AUS $ per Tonne of Pollutant Emission NOx CO NMVOCs SOx PM
Band 1 1,750 3 850 11,380 341,650
Band 2 1,750 0.8 880 4,380 93,180
Band 3
Band 4
260 0.8 180 2,800 93,180
0 0 0 50 1,240
Source: CSIRO, BTRE, and ABARE (2003) after Watkiss (2002) Band 1 = Inner areas of larger capital cities (Sydney, Melbourne, Brisbane, Adelaide and Perth). Band 2 = Outer areas of large capital cities. Band 3 = Other urban areas, including other capital cites (Canberra, Hobart and Darwin) and other urban areas. Band 4 = Non-urban areas.
BTRE (2005) estimate the economic costs of ambient air pollution from motor vehicles following two phases: an impact assessment and the calculation of the value of statistical life, the valuation of life quality and the direct cost of resources. These are then used to estimate total economic costs as shown in Tables 6.8, 6.9, and 6.10. Table 6.8 Total Economic Costs of Motor Vehicle-related Pollution ($M) in Australian Capital Cities, 2000 Capital Cities Sydney Melbourne Brisbane Adelaide Perth Hobart Darwin Canberra All capital cities
Mortality 713 448 197 113 104 8 5 8 1,596
Morbidity 323 211 98 49 49 3 2 735
Total 1,036 658 295 162 153 11 7 8 2,330
Source: BTRE (2005) Note: The figures shown are the base values from the estimation.
Table 6.9 Total Economic Costs of Motor Vehicle-related Pollution ($M) – Regional Areas*, 2000 Regional Areas* in NSW VIC QLD SA
Mortality
Morbidity
Total
116 64 40 10
40 19 15 2
156 83 54 12
Valuing Air Quality Impacts of Transportation: A Review of Literature
Page 26
Regional Areas* in WA TAS NT ACT All regional areas
Mortality
Morbidity
Total
12 8 0 na 250
4 2 0 na 82
16 10 0 na 332
Source: BTRE (2005) Note: - The figures shown are the base values from the estimation. - na not available. Totals may not add due to rounding. Mortality cost estimated using a VOSL of A$ 1.3 million. * Regional areas are defined as all areas outside of capital cities.
Table 6.10 Total Economic Costs of Motor Vehicle-related Pollution ($M) Australia, 2000 State NSW VIC QLD SA WA TAS NT ACT Australia
Mortality 829 512 236 122 115 17 5 8 1,846
Morbidity 363 230 113 52 53 5 2 na 817
Total 1,192 741 349 174 169 22 8 8 2,663
Source: BTRE (2005) Note: - The figures shown are the base values from the estimation. - na not available. Totals may not add due to rounding. Mortality cost estimated using a VOSL of A$ 1.3 million. • Regional areas are defined as excluding capital cities and towns with less than 5000 people.
6.3 Policy Relevance: Valuing Air pollution in Cost Benefit Analysis Studies conducted by US EPA (1997 and 1999) analysed retrospective and prospective costs and benefits of air pollution policy and concluded that there were extremely high benefit-cost ratios (for example, 44) for the central estimate of benefits and costs in the retrospective study, US EPA (1997) and more modest but very attractive ratios (about 4:1) in the prospective study, US EPA (1999) and Portney (2000). Moreover, EPA regards these values could be cases of probable underestimates. In these studies, the total benefits are mainly contributed by health benefits (99% if damage to children's IQ is included). The EPA's analysis has, however, been subjected to very critical analysis Lutter (1998) and Sieg et al. (2000). The significant feature of all these studies is that, whatever may be the views of the individual estimates of benefits and costs, eventually health benefits dominate. However, ecosystem impacts tended to be confined to agriculture (crops). Even in the cost-benefit studies of actual and proposed European Directives on air quality control, health benefits - in the form of reduced premature mortality and reduced morbidity – turns up as a prominent figure. Table 6.11 shows a selection of studies relating to air pollutants and reveals that health benefits account for a minimum of onethird and a maximum of nearly 100 per cent of overall benefits from pollution control. Moreover, in most cases these benefits exceed the costs of control by considerable margins. Health benefits therefore 'drive' positive benefit-cost results, as they do in the USA studies.
Valuing Air Quality Impacts of Transportation: A Review of Literature
Page 27
Table 6.11 Health Benefits as a Percentage of Overall Benefits in Recent Cost-benefit Studies Study
Benefits as % total benefits
Title and subject area
Holland and Krewitt (1996)
Benefits of an Acidification Strategy for the European Union: reductions of SOx, NOx, NH3 in the European Union
86-94%. Total benefits cover health, crops and materials.
AEA Technology (1998a)
Cost Benefit Analysis of Proposals Under the UNECE Multi-Effect Protocol: reductions of SOx, NOx, NH3, VOCs
80-93%. Total benefits cover health, crops, buildings, forests, ecosystems, visibility
AEA Technology (1998b) and Krewitt et al (1999)
Economic Evaluation of the Control of Acidification and Ground Level Ozone: reductions of NOx and VOCs. SO2 and NH4 held constant.
52-85% depending on inclusion or not of chronic health benefits. Total benefits include health, crops, materials and visibility
AEA Technology (1998c)
Economic Evaluation of Air Quality targets for CO and Benzene
B/C ratio of 0.32 to 0.46 for CO. Costs greatly exceed benefits for benzene. Benefits consist of health only.
AEA Technology (1998d)
Economic Evaluation of Proposals for Emission Ceilings for Atmospheric Pollutants
B/C ratios of 3.6 to 5.9. Health benefits dominate.
AEA Technology (1999)
Cost Benefit Analysis for the Protocol to Abate Acidification, Eutrophication and Ground level Ozone in Europe
VOSL + morbidity accounts for 94% of benefits. B/C ratio = 2.9.
IVM; NLUA and IIASA (1997); Olsthoorn et al (1999)
Economic Evaluation of Air Quality for Sulphur Dioxide, Nitrogen Dioxide, Fine and Suspended Particulate Matter and Lead: reductions of these pollutants
32-98%. Total benefits include health and materials damage
7)
Research Questions for Australian Conditions
The following issues and questions are raised by BTRE (2005) for the studies on health effects of air pollution in Australia: -
Are the overseas relative risk ratios appropriate for Australia? The major air pollutants with adverse health effects and their sources have been identified. However, the exact nature of the association between air pollutants and
Valuing Air Quality Impacts of Transportation: A Review of Literature
Page 28
-
-
8)
the exposed population, given different attributes e.g. age, existing health conditions, needs further research. The individual impacts of each pollutant on human health still need further investigation. What are the minimum threshold levels of air pollutants, beyond which health effects occur. WHO (2000) has presented guidelines on the likely threshold levels for major air pollutants, but these may not be universally applicable. How to quantify and value the loss of life is still diverse and needs standardisation. The following also needs attention: • the health impact of very fine particles – PM1 and PM2.5. • measurement of indoor pollution and its contributory sources. • more robust estimates of particulate emissions from road dust sources. • more accurate measurement of the motor vehicle share of local air pollution. • the appropriateness of using surrogate pollutants to measure the combined impact of pollutants on health. • the extent of length of life loss that is associated with premature death from pollution causes.
References
AATSE (1997) Economics of benefit and cost – Supporting report No. 6. Urban Air Pollution in Australia: An Inquiry by the Australian Academy of Technological Sciences and Engineering for Environment Australia. (Australian Academy of Technological Sciences and Engineering: Melbourne). Abbey, D.E., Nishino, N., McDonnell, W.F., Burchette, R.J., Knutsen, S.F., Beeson, W.L. and Yang, J.X. (1999), Long-term inhalable particles and other air pollutants related to mortality in non-smokers, American Journal Respiratory and Critical Care Medicine, Vol. 159, no. 2, pp. 373-382. AEA Technology Environment (2002) Fuel taxation inquiry: the air pollution costs of transport in Australia – a report to the Commonwealth of Australia, March 2002, Oxon, United Kingdom. AEA Technology (1998a) Cost-Benefit Analysis of Proposals Under the UNECE Multi-Pollutant Multi-Effect Protocol, Report to UK Department of Environment, Transport and Regions, London and to UNECE Task Force on Economic Aspects of Abatement Strategies, Geneva. AEA Technology (1998b) Economic Evaluation of the Control of Acidification and Ground Level Ozone, (provisional), Report to DGXI of the European Commission, Brussels. AEA Technology (1998c) Economic Evaluation of Air Quality Targets for CO and Benzene, DGXI, European Commission, Brussels. AEA Technology (1999) Cost-Benefit Analysis for the Protocol to Abate Acidification, Eutrophication and Ground Level Ozone in Europe, Ministry of Housing, Spatial Planning and the Environment, The Hague, Netherlands, Publication No. 133. Amoako, J., Ockwell, A. and Lodh, M. (2003) The economic consequences of the health effects of transport emissions in Australian capital cities, Proceedings of the 26th Australian Transport Research Forum, 1-3 October 2003, Wellington, New Zealand. Amoako, J. and Lodh, M. (2003) The economic consequences of the health effects of transport emissions in Australian capital cities. Prepared by the Bureau of Transport and Regional Economics, Canberra, for the 32nd Australian Economists’ Conference, 29th September- 2nd October, 2003, Canberra. Anderson, H.R., de Leon, A.P., Bland, J.M., Bower, J.S., and Strachan, D.P. (1996) Air pollution and daily mortality in London: 1987–92, British Medical Journal, no. 312, pp. 665–71.
Valuing Air Quality Impacts of Transportation: A Review of Literature
Page 29
ATC (2004a) National guidelines for transport system management in Australia, Volume 1: Framework Overview. Australian Transport Council: Guidelines Assessment Methodology Working Group, November ATC (2004b) National guidelines for transport system management in Australia, Volume 2: Project Appraisal. Australian Transport Council: Guidelines Assessment Methodology Working Group, November ATC (2004c) National guidelines for transport system management in Australia, Volume 3: Foundation Material. Australian Transport Council: Guidelines Assessment Methodology Working Group. Atkinson, R.W., Anderson, H.R., Sunyer, J., Ayres, J., Baccini, M., Vonk, J.M., Boumghar, A., Forastiere, F., Forsberg, B., Touloumi, G., Schwartz, J. and Katsouyanni, K. (2001) Acute Effects of Particulate Air Pollution on Respiratory Admissions: Results from APHEA 2 Project, American Journal of Respiratory and Critical Care Medicine, vol. 164, no. 10, pp. 1860–1866. AustRoads (2003) Valuing environmental and other externalities, Report AP-R229/03. Austroads, Sydney. AustRoads (2004) Guide to project evaluation. Part 4: Project evaluation data. Report No. AP-G82/04, Sydney. Bascom, R., Bromberg, P.A., Costa, D.A., Devlin, R., Dockery, D.W., Frampton, M.W., Lambert, W., Samet, J.M., Speizer, F.E., and Utell, M. (1996) Health effects of outdoor air pollution: part I, American Journal of Respiratory and Critical Care Medicine, no.153, pp. 477–98. Bell, M.L. and Davis, D.I. (2001) Reassessment of the lethal London fog of 1952: novel indicators of acute and chronic consequences of acute exposure to air pollution, Environmental Health Perspectives, 109, (suppl. 3), pp. 389–94. Beron, K., Murdoch, J., and Thayer, M. (2001). The Benefits of Visibility Improvement: New Evidence from the Los Angeles Metropolitan Area. Bickel, P. (2003) Economic Valuations of Health Effects Due to Airborne Pollutants in Extern-E, ECE/WHO, “PanEuropean Program on Transport, Health and Environment”, Workshop on Economic Valuations of Health Effects due to Transport, June 12-13, Stockholm. Blum, U. (1998) Positive Externalities of Transportation and the Allocation of Infrastructure – an Evolutionary Perspective. Journal of Transportation and Statistics Vol. I, No. 3, 1998, S. 81-88 Borja-Aburto, V.H., Loomis, D., Bangdiwala, S.I., Shy, C.M., and Rascon-Pacheo, R.A. (1997) Ozone, suspended particles and daily mortality in Mexico City, American Journal of Epidemiology, vol. 145, no. 3, pp. 258–68. Brabin, B., Smith, M., Milligan, P., Benjamin, C., Dunne, F., and Pearson, M. (1994) Respiratory morbidity in Merseyside school children exposed to coal dust and air pollution, Archives of Diseases in Childhood, vol. 70, pp. 305-312. Brimblecombe, P. (1987). The big smoke, Routledge, London. Brown (1998) Beating the $12 billion cost of polluted air, Media Release, CSIRO, Ref 98/55. Brunekreef, B. (1997). Air pollution and life expectancy: is there a relation? Occupational and Environmental Medicine, vol 54, pp781-784. Brunekreef, B. and Holgate, S.T. (2002) Review: air pollution and health, The Lancet, vol. 360, p. 1233-1142. BTRE (2005) Health impacts of transport emissions in Australia: Economic costs, BTRE working paper 63, Bureau of Transport and Regional Economics, Australian Government. Bureau of Transport & Regional Economics (BTRE) (2002) Greenhouse gas emissions from transport—Australian trends to 2020, Report 107, BTRE, Canberra. Bureau of Transportation Statistics (1994) Transportation statistics: Annual report 1994. Bureau of Transportation Statistics, U.S. Department of Transportation, January 1994.
Valuing Air Quality Impacts of Transportation: A Review of Literature
Page 30
Burnett, R.T., Cakmak, S., and Brook, J.R. (1998a) The effect of the urban ambient air pollution mix on daily mortality rates in 11 Canadian cities, Canadian Journal of Public Health, Issue 3, pp. 152–6. Burnett, R.T., Cakmak, S., Razienne, M.E., Stieb, D., Vincent, R., Krewski, D., Brook, J.R., Philips, O., and Ozkayanak, H. (1998b) The association between ambient carbon monoxide levels and daily mortality in Toronto, Canada, Journal of the Air and Waste Management Association, vol. 48, no. 8, pp. 689–700. Capros, P. and Mantzos, L. (2000) Kyoto and technology at the European Union: costs of emission reduction under flexibility mechanisms and technology progress, Int. J. Global Energy Issues, 14, pp. 169-183. CEC (1995) ExternE: Externalities of energy. Vol 2. Methodology, European Commission, DG XII, Science and Research Development, Brussels. Chestnut, L.G. and Dennis, R.L. (1997). Economic Benefits of Improvements in Visibility: Acid Rain Provisions of the 1990 Clean Air Act Amendments. Journal of Air and Waste Management, Vol 47, pp. 395-402. Cited in US EPA (1999b). Chestnut, L.G. and Rowe, R.D. (1990). Economic Valuation of Changes in Visibility. State of the Science Assessment for NAPAP. Cited in US EPA (1999b). Chinn, S., Florey, C.D.V., Baldwin, I.G., Gorgol, M. (1981). The Relation of Mortality in England and Wales 1969– 73 to Measurements of Air Pollution, Journal of Epidemiology and Community Health, no. 35, pp. 174–9. Clinch, J. P. (1999) Economics of Irish forestry: Evaluating the returns to economy and society, COFORD, Dublin. Clue, S. L. (2004) Air pollution: Evaluation the economic cost of visibility impairment. Civil Exchange, November 2004, Hong Kong. Committee on the Medical Effects of Air Pollutants (COMEP) United Kingdom (1998) Quantification of the effects of air pollution on health in the United Kingdom, The Stationery Office, UK Department of Health, London. Corbo, G.M., Forastiere, F., Dellí Orco, V., Pistelli, R., Agabiti, N., De Stefanis, B., Ciappi, G., and Perucci, C.A. (1993) Effects of environment on atopic status and respiratory disorders in children, Journal of Allergy and Clinical Immunology, vol.92, pp. 616-623. Cox, Wendell (March 2002) The Illusion of Transit Choice, Veritas. San Antonio, TX: Texas, Public Policy Foundation. http://www.demographia.com/illusion.pdf. Cropper, M.L., Aydede, S.K., Portney, P.R. (1994) Preferences for Life Saving Programs : How the Public Discounts Time and Age, Journal of Risk and Uncertainty, 8, 243-265. CSIRO, BTRE and ABARE (2003) Appropriateness of a 350 ML Biofuels Target, Report to the Australian Government, Department of Industry, Tourism and Resources, Canberra, December, available at http://www.btre.gov.au/docs/BiofuelsStudy_MainReport.pdf. Denison, L., Morgan, G., Streeto, J., Simpson, R., Petroeschevsky, A., Thalib, L., and Rutherford, S. (2000) Melbourne mortality study, effects of ambient air pollution on daily mortality in Melbourne 1991–1996, EPA publication 709, Environmental Protection Agency, Victoria. Delucchi, M. and Hsu, Shi-Ling (1996) External damage cost of direct noise from motor vehicles. Annualised social cost of motor vehicle use in the U. S., Report 14, December 1996, Institute of Transportation Studies, University of California-Davis. Delucchi M.A. (2000). Environmental Externalities of Motor-Vehicle Use in the US. Journal of Transport Economics and Policy, ISSN 0022 5258, Volume 34, Part 2, May 2000, pp135-168. Delucchi, M.A., Murphy, J.J., D.R. McCubbin, D.R. (2002). The Health and Visibility Cost of Air Pollution: A Comparison of Estimation Methods. Journal of Environmental Management, Vol 64, pp.130-152.
Valuing Air Quality Impacts of Transportation: A Review of Literature
Page 31
Dockery, D.W., Pope, C.A., Xu, X., Spengler, J.D., Ware, J.H., Fay, M.A., Ferris, B.G., and Speizer, F.E. (1993) An association between air pollution and mortality in six U.S. cities, New England Journal of Medicine, vol. 329, pp. 1753–9. Dockery, D.W., Speizer, F.E., Stram, D.O., Ware, J.H., Spengler, J.D., and Ferris, B.G. Jr. (1989) Effects of inhalable particles on respiratory health of children, American Review of Respiratory Diseases, March;139(3): pp.587-94. Environmental Protection Agency (2001) Emissions data spreadsheets for 1996 – 1999. EPA, Dublin, Ireland. Energy Information Administration (1994) State Energy Data Report 1994. Energy Information Administration, Department of Energy,USA. Environment Australia (EA) (2001) Atmosphere Theme Report, Australia State of Environment Report 2001, Canberra. (www.ea.gov.au/soe/2001/atmosphere.html#urbanairquality accessed 11 June 2003) Environmental Protection Agency (2001) Emissions data spreadsheets for 1996 – 1999. EPA, Dublin, Ireland. European Commission (1999) ExternE Externalities of Energy. Volumes 7 to 10, European Commission, Belgium. Ezzati, M. and Kammen, D. M. (2001) Quantifying the Effects of Exposure to Indoor Air Pollution from Biomass Combustion on Acute Respiratory Infections in Developing Countries, Environmental Health Perspectives, Vol. 109, Number 5, May. Fahl, U., Läge, E., Remme, U., and Schaumann, P. (1999) E3Net. In: Forum für Energiemodelle und Energiewirtschaftliche Systemanalysen in Deutschland (Hrsg.) Energiemodelle zum Klimaschutz in Deutschland. Physica-Verlag, Heidelberg 1999. Fisher, G. W., Rolfe, K. A., Kjellstrom, T., Woodward, A., Hales, S., Sturman, A. P., Kingham, S. Petersen J, Shrestha, R. and King, D. (2002) Health effects due to motor vehicle air pollution in New Zealand. A Report submitted to the Ministry of Health, Wellington, New Zealand. Forastiere, F., Corbo, G. M., Pistelli, R., Michelozzi, P., Agabiti, N., Branciato, G., Ciappi, G. and Perucci, C.A. (1994) Bronchial responsiveness in children living in areas with different air pollution levels, Archives of Environmental Health, vol. 49, pp. 111–18. Freidrich R (2000) Marginal Energy-related External Costs of Transport, paper presented at External Costs of Energy Conversion- improvement of the Extern-E Methodology and Assessment of Energy-related Transport Externalities, Vlaams Europees Conferentiecentrum, Brussels, May 10, 2000. Fuller, J., Hokanson, B., Haugard, J., and Stoner, J. (1983) Measurements of Highway User Interference Costs and Air Pollution and Noise Damage Costs, NS 83-817, Institute of Urban and Regional Research, University of Iowa. Gauderman, W.J., Gilliland, F., Vora, H., Avol, E., Stram, D., McConnell, R., Thomas, D., Lurmann, F., Margolis, H.G., Rappaport, E.B., Berhane, K. and Peters, J.M. (2002) Association between air pollution and lung function growth in Southern California children: results from a second cohort, American Journal of Respiratory and Critical Care Medicine, vol. 165, no. 13. Gehring, U., Cyrys, J., Sedlmeir, G., Brunekreef, B., Bellander, T., Fischer, P., Bauer, C.P., Reinhardt, D., Wichmann, H.E., Heinrich, J. (2002) Traffic-related air pollution and respiratory health during the first 2 years of life, European Respiratory Journal, vol. 19, no. 4, pp. 690–98. Government Accounting Office (GAO) (1992) Air pollution: Global pollution from jet aircraft could increase in the future, GAO/RCED-92-72 (Washington, D.C.:GAO), p.19. Gwilliam, K. and Kojima, M. (2003) Urban Air Pollution: Policy Framework for Mobile Sources, DRAFT. Prepared for the Air Quality Thematic Group, World Bank, May 2003. Haider, W., Moore, J., Knoweler, D., and Anderson, D. (2002). Estimating Visibility Aesthetics Damages for AQVM. Report for the Environmental Economics Branch, Environment Canada. Halliday, J.A., Henry, R.L., Harkin, R.G. and Hensley, M.J. (1993) Increased wheeze but not bronchial hyperreactivity near power stations, Journal of Epidemiology and Community Health, vol. 47, pp. 282-286.
Valuing Air Quality Impacts of Transportation: A Review of Literature
Page 32
Henry, R.L., Abramson, R., Adler, J.A., Wlodarcyzk, J., and Hensley, M.J. (1991a) Asthma in the vicinity of power stations: I.A prevalence study, Paediatric Pulmonology, Vol.11, pp.127–33. Henry, R.L., Bridgman, H.A., Abramson, R., Adler, J.A., Wlodarcyzk, J., and Hensley, M.J. (1991b) Asthma in the vicinity of power stations: II. Outdoor air quality and symptoms, Paediatric Pulmonology, vol. 11, pp. 134–40. Holland, M and Krewitt, W. (1996) Benefits of an Acidification Strategy for the European Union, European Commission, DGXI, Brussels. Holz, O., Mücke, M., Paasch, K., Böhme, S., Timm, P., Richter, K., Magnussen, H. and Jörres, R.A. (2002) Repeated ozone exposures enhance bronchial allergen responses in subjects with rhinitis or asthma, Clinical and Experimental Allergy, vol. 32, issue 5. Hurley, P. (2002) The air pollution model (TAPM) version 2, part 1: technical description, CSIRO Atmospheric Research Technical Paper No. 55. See also . IBI Group (1995) Full cost transportation pricing study: Final report to transportation and climate change collaborative. Ottowa, Canada: IBI Group. IEI (Industrial Economics Incorporated), (1992). Revisions to the proposed value of life, Memo., Cambridge, Mass. Infras/IWW (1995) External effects of transport. International Union of Railways, IWW- Karlsruhe University, INFRAS Consultants. Infras/IWW (2000) External Costs of Transports – Accidents, Environmental and Congestion Costs in Western Europe, Union Internationale des Chemins de Fer UIR, Brussels. IVM, NILU and IIASA (1997) Economic Evaluation of Air Quality for Sulphur Dioxide, Nitrogen Dioxide, Fine and Suspended Particulate Matter and Lead, Report to DGXI, European Commission, Brussels. Johansson P-O (2002) The value of a statistical life: theoretical and empirical evidence, Applied Health Economics and Health Policy, 1(1), pp. 33–41. Katsouyanni, K., Zmirou, D., Spix, C., Sunyer, J., Schouten, J.P., Pönkä, A., Anderson, H.R., Le Moullec, Y., Wojtyniak, B., Vigotti, M.A. and Bacharova, L. (1995) Short-term effects of air pollution on health: A European approach using epidemiological time-series data, European Respiratory Journal, vol. 8. Kleinman, M.T. (2000) The health effects of air pollution on children, discussion paper, Department of Community and Environmental Medicine, University of California, Irvine. Krewski, D., Burnett, R.T., and Goldberg, M.S. (2000) Reanalysis of the Harvard six cities study and the American Cancer Society study of particulate air pollution and mortality: special report, Health Effects Institute, Cambridge, Massachusetts. Krupnick, A. and Cropper, M. (1992) The Effect of Information on Health Risk Valuations. Journal of Risk and Uncertainty; 5; 29-48. Kunzli, N., Kaiser, R. and Medina, S. (2000) Public health impact of outdoor and traffic related air pollution: A European assessment. Lancet, Vol 356. Künzli, N., Kaiser, R., Medina, S., Studnicka, M., Oberfield, G., Horak, F. (1999) Health costs due to road trafficrelated air pollution: an impact assessment project of Austria,France and Switzerland, prepared for the Third Ministerial Conference for Environment and Health, London. Levinson, D.M., Gillen, D., and Kanafani, A. (1998) The social costs of intercity transportation: A review and comparison of air and highway. Transport Reviews, 18, 3, 215-240. Lin, S., Munsie, J.P., Hwang, S.A., Fitzgerald, E., Cayo, M.R. (2002) Childhood asthma hospitalisation and residential exposure to state route traffic, Environmental Research, vol. 88(2), pp. 73-81.
Valuing Air Quality Impacts of Transportation: A Review of Literature
Page 33
Link, H., Stewart, L.H. (DIW), Doll, C. (IWW), Bickel, P., Schmid, S., Friedrich, R., Suter, S., Sommer, H., Marti, M. (Ecoplan), Maibach, M., Schreyer, C., and Peter, M. (INFRAS), ITS, University of Leeds with contributions from partners (2002) UNITE (UNIfication of accounts and marginal costs for Transport Efficiency), Deliverable 5: Pilot Accounts – Results for Germany and Switzerland, Competitive and Sustainable Growth (GROWTH) programme, Contract: 1999-AM.11157, v. 3.8, the European Commission 5th Framework – Transport RTD, May 29, 2002. Link, H., Stewart-Ladewig, L., Garcia, R. (DIW), Herry, M., Sedlacek, N., Tomschy, R. (Herry), PRODEC Planning Consultants, Betancor, O., Nombela, G. (EIET), Quinet, E., Schwartz, D., Taroux, J.P. (ENPCCERAS), O’Mahony, M. (TCD), Certan, C., Bossche, M., Devillers, E., Boersma, H. (NEI), Nellthorp, J., Tweddle, G., Sansom, T., Nash, C. (ITS, University of Leeds) with contributions from partners (2003a) UNITE (UNIfication of accounts and marginal costs for Transport Efficiency), Deliverable 8: Pilot Accounts – Results for Austria, Denmark, Spain, France, Ireland, Netherlands, and UK, Competitive and Sustainable Growth (GROWTH) programme, Contract: 1999-AM.11157, v. 5.9, the European Commission 5th Framework – Transport RTD, May 21, 2003. Link, H., Stewart-Ladewig, L., Garcia, R. (DIW), Herry, M., Godart, S., Himanen, V., Idstrom, T., Karjalainen , J. (JP-Transplan Ltd), Tervonen, J. and Otterstrom, T. (Electrowatt-Ekono Oy), Tsamboulas, D., Korizis, D., Roussou, A. (SYSTEMA), Tánczos, K., Legeza, E., Magyar, I., Bokor, Z., Farkas, G., Kővári, B., Kiss, B., Békefi, Z., Duma, L., Nagy, Z., Rónai, P. (BUTE), Ricci, A., Enei, R., Esposito, R., Fagiani, P., Giammichele, F., Leone, G., Pellegrini, D. (ISIS), Macário, R., Carmona, M., Caiado, G., Rodrigues, A., Martins, P. (TIS), Nääs, O., Lindberg, G. (VTI), Bickel, P. (IER), ITS, University of Leeds with contributions from partners (2003b) UNITE (UNIfication of accounts and marginal costs for Transport Efficiency), Deliverable 12: Pilot Accounts – Results for Belgium, Finland, Greece, Hungary, Italy, Luxembourg, Portugal, Sweden, Competitive and Sustainable Growth (GROWTH) programme, Contract: 1999-AM.11157, v. 3.5, the European Commission 5th Framework – Transport RTD, May 26, 2003. Litman, T. (2002) Transportation Cost Analysis: Techniques, Estimates and Implications. Victoria Transport Policy Institute, June 2002, Canada. Litman, T. (2000) Quantifying the benefits of non-motorized transport for achieving TDM objectives, Victoria Transport Policy Institute. Lutter, R. (1998) An Analysis of the Use of EPA's Benefit Estimates in OMB's Draft Report on the Costs and Benefits of Regulation, Comment 98-2, AEI-Brookings Center for Regulatory Studies, Washington DC. Lvovsky, K. (1998) Economic Costs of Air Pollution with Special Reference to India. Proceeding of the National Conference on Health and Environment, Delhi, India, July 7-9, 1998. Lvovsky, K., Maddison, D., Ostro, B., Hughes, G., and Pearce, D. (1998). Air Pollution and The Social Costs of Fuels, World Bank. Maddison, D.(1998) Valuing Changes in Life Expectancy in England and Wales Caused by Ambient Concentrations of Particulate Matter, Paper GEC 98-06, Centre for Social and Economic Research on the Global Environment, University College London, London. Maddison, D.(2000) Modelling Distributed Lag Effects in Epidemiological Time Series Studies, Centre for Social and Economic Research on the Global Environment, University College London, London, mimeo. Malm, W.C., (1999). Introduction to Visibility. Air Resources Division National Park Service. Marquez, L., Olaru, D. and Smith, N. (2004) Societal and other costs of road movement of freight through urban areas. Report for Department of Infrastructure Planning and Natural Resources, Metropolitan Freight Strategy: Freight Demand Management Review, Stage 1 – Part A, CSIRO – Transport Futures. Mathieu-Nolf, M. (2002) Poisons in the air: a cause of chronic disease in children, Journal of Toxicology and Clinical Toxicology, vol. 40, no. 4, pp. 483–91. McClelland, G., Schulze, W., Waldman, D., Schenk, D., and Irwin, J. (1993). Valuing Eastern Visibility: A Field Test of the Contingent Valuation Model. Prepared for Office of Policy, Planning & Evaluation, US EPA.
Valuing Air Quality Impacts of Transportation: A Review of Literature
Page 34
Miller, T. (1990) The Plausible Range for the Value of Life - Red Herrings among the Mackerel, Journal of Forensic Economics, Vol. 3(3), pp17-39. Miyao, M., Furuta, M., Ozawa, K., Kondo, T., Sakakibara, H., Ishihara, S., and Yamanaka, K. (1993) Morbidity of allergic rhinitis based on the national health insurance records of Japan, Tohoku Journal of Experimental Medicine, no. 169, pp. 345–50. Morgan, G., Corbett, S., and Wlodarczyk, J. (1998a) Air pollution and daily mortality in Sydney, Australia, 1989 through 1993, American Journal of Public Health, vol. 88, pp. 759–64. Morgan, G., Corbett, S., and Wlodarczyk, J. (1998b) Air pollution and hospital admissions in Sydney, Australia, 1990 through 1994, American Journal of Public Health, vol. 88, pp. 1761–66. Morris, R.D. and Naumova, E.N. (1998) Carbon monoxide and hospital admissions for congestive heart failure: evidence of an increased effect at low temperatures, Environment and Health Perspective, vol. 106, no. 10, pp. 649–53. Moore, M. and Viscusi, K. (1988) The quantity adjusted value of life, Economic Inquiry, Vol. 26, No. 3, pp 369388. Murray, C. and Lopez, A. (eds) (1996) The Global Burden of Disease. Cambridge, MA. Nakai, S., Nitta, H., Maeda, K. (1999) ‘Respiratory health associated with exposure to automobile exhaust. III: Results of a cross-sectional study in 1987 and repeated pulmonary function tests from 1987 to 1990’, Archives of Environmental Health, vol. 54(1), pp.26-33. Nash, C. (1997) Transport externalities: does monetary valuation make sense? In G. de Rus and C. Nash (eds.), Recent Developments in Transport Economics. Ashgate Press, London. Nel, A.E., Diaz Sanchez, D., and Ng, D. (1998) Enhancement of allergic inflammation by the interaction between diesel exhaust particles and the immune system, Journal of Allergy and Clinical Immunology, no. 102, pp.539–54. Nerhagen L., och Johansson H. (2003) Variations in the external cost of transport air pollution – the case of Sweden. VTI-notat 36A-2003. Nordhaus, W. (1994) Managing the global commons, Cambridge, MA: MIT Press. NSW EPA (1995) Envalue: A searchable environmental valuation database, NSW Environmental Protection Authority, http://www.epa.nsw.gov.au/envalue, Assessed June 2004. Nyberg, F., Gustavsson, P., Jarup, L., Bellander, T., Berglind, N., and Jakobsson, R. (2000) Urban air pollution and lung cancer in Stockholm, Epidemiology, vol. 11, no. 5, pp. 487–95. OECD (1994) Internalizing the social cost of transport. OECD, Paris. O’Mahony, M., Link, H., Stewart-Ladewig, L, and Bickel, P. (2005) Environmental and social transport costs: A case study of Ireland, Transport Research Board. Oosterlee, A., Drijver, M., Lebret, E., Brunekreef, B. (1996) Chronic respiratory symptoms in children and adults living along streets with high traffic density, Occupational and Environmental Medicine, vol. 53(4), pp.241-7. ORNL (2000) Transportation Energy Data Book, Oak Ridge National Laboratory, USDOE. Ostro, B. (1994) "Estimating the health effects of air pollution: a methodology with application to Jakarta”, Working paper 1301, World Bank, Washington DC. Ostro, B. (1996) A metodology for Estimating Air Pollution health Effects. WHO/EHG/96.5; Geneva. Ostro, B. (2004) Outdoor air pollution: Assessing the environmental burden of disease at national and local levels. Environmental Burden of Disease Series, No. 5, World Health Organization Protection of the Human Environment, Geneva.
Valuing Air Quality Impacts of Transportation: A Review of Literature
Page 35
Pace University Center for Environmental and Legal Studies, Buffalo, NY (1990) Environmental costs of electricity (New York: Oceana) Peach, H. (1997) Air quality and human health, Australia: state of the environment technical paper series (the atmosphere), Australian Government Department of the Environment, Canberra. Pearce, D. (2001) The Role of Economic Valuation of Health Effects in UN/ECE LRTAP Work: History, Debate, Outstanding Issues, Prepared for the UK DETR/UN ECE Symposium on THE MEASUREMENT AND ECONOMIC VALUATION OF HEALTH EFFECTS OF AIR POLLUTION, London, Institute of Materials, February 19-20, 2001. PEP, WHO (Transport, Health and Environment Pan-European Programme (THE PEP), UNECE/WHO) (2005) Transport-related Health Effects with a Particular Focus on Children. Towards an Integrated Assessment of their Costs and Benefits. State of the Art Knowledge, Methodological Aspects and Policy Directions, Topic Report: Economic valuation. Swedish Institute for Transport and Comminications Analysis (SIKA). Petroeschevsky, A., Simpson, R.W., Thalib, L., and Rutherford, S. (2001) Associations between outdoor air pollution and hospital admissions in Brisbane, Australia, Archives of Environmental Health, vol.56, pp. 37–52. Pope, C.A. (2000) ‘Epidemiology of fine particulate air pollution and human health: biological mechanisms and who’s at risk?’, Environmental Health Perspective vol. 108 (supplement 4), August, pp.713–723 (document viewed 15 February 2005 ) Pope, C.A., Burnett, R.T., Thun, M.J., Calle, E.E., Krewski, D., Ito, K., and Thurston, G.D. (2002) Lung cancer, cardiopulmonary mortality and long-term exposure to fine particulate air pollution, Journal of the American Medical Association, vol. 287, no. 9, pp. 1132–41. Pope, C.A. and Dockery, D.W. (1994) Acute respiratory effects of particulate air pollution. Annual Reveiw of Public Health, 1994;15:107-32 Pope, C.A., Dockery, D.W., and Schwartz, J. (1995a) Review of epidemiological evidence of heath effects of particulate air pollution, Inhalation Toxicology, vol. 7, pp. 1– 18. Pope, C.A., Thun, M.J., Namboodiri, M.M., Dockery, D.W., Evans, J.S., Speizer, F.E., and Heath, C.W. Jnr (1995b) Particulate air pollution as a predictor of mortality in a prospective study of US adults’, American Journal of Respiratory and Critical Care Medicine, vol. 151, pp. 669-674. Portney, P. (2000) Air pollution policy in Portney P (ed) Public Policies for Environmental Protection, 2nd edition, Washington DC: Resources for the Future, 77-124. Pratt, C. (2002) Estimation and valuation of environmental and social externalities for the transport sector. Proc. Australasian Transport Research Forum (ATRF). Canberra. Prescott, G.J., Cohen, G.R., Elton, R.A., Fowkes, F.G., and Agius, R.M. (1998) Urban air pollution and cardiopulmonary health: a 14.5 year time series study, Occupational and Environment Medicine, no. 55, pp. 697– 704. Rabl, A. (2000) Interpretations of Air Pollution Mortality: Number of Deaths or Life Years Lost?, Paris: Centre d'Energétique, Ecole des Mines de Paris, mimeo. Rhode H. (1988) A Comparison of the Contribution of Various Gases to the Greenhouse Effect, Science 248 (1990):1217-1219. U.S. Department of Energy, A Primer on Greenhouse Gases, DOE/NBB-0083, Washington, DC, March. Rizzi, L. I. and Ortuzar, J. de D. (2003) Stated preference in the valuation of interurban road safety. Accident Analysis and Prevention, 35, 9-22. Samet, J.M., Hatch, G.E., and Horstman, D. (2001) Effect of antioxidant supplementation on ozone-induced lung injury in human subjects, American Journal of Respiratory Critical Care Medicine, no. 164, pp.819–25.
Valuing Air Quality Impacts of Transportation: A Review of Literature
Page 36
Samet, J.M., Zeger, S.L., and Berhane, K. (1995) The association of mortality and particulate air pollution, in Particulate air pollution and daily mortality: replication and validation of selected studies: the phase I report of the particle epidemiology evaluation project, Health Effects Institute, Cambridge, MA. Samet, J.M., Zeger, S., Kelsall, J., Xu, J., and Kalkstein, L. (1997) Particulate air pollution and daily mortality: analyses of the effects of weather and multiple air pollutants, Health Effects Institute Research Report, Cambridge Massachusetts. Samet, J.M., Zeger, S., Kelsall, J., Xu, J., and Kalkstein, L. (1998) Does weather confound or modify the association of particulate air pollution with mortality? An analysis of the Philadelphia data, 1973–1980, Environmental Research, vol.77, no.1, pp.9–19. Sartor, F., Demuth, C., Snacken, R., and Walckiers, D. (1997) Mortality in the elderly and ambient ozone concentration during the hot summer of 1994 in Belgium, Environmental Research, vol. 72, pp. 109–117. SCAQMD (2002) Multiple Air Toxics Exposure Study (MATES-II), South Coast Air Quality Management District. Schelegle, E.S., Miller, L.A., Gershwin, L.J., Fanucchi, M.V., Van Winkle, L.S., Gerriets, J.E., Walby, W.F., Mitchell, V., Tarkington, B.K., Wong, V.J., Baker, G.L., Pantle, L.M., Joad, J.P., Pinkerton, K.E., Wu, R., Evans, M.J, Hyde, D.M., and Plopper, C.G. (2003) Repeated episodes of ozone inhalation amplifies the effects of allergen sensitization and inhalation on airway immune and structural development in Rhesus monkeys, Toxicology and Applied Pharmacology, vol. 191, pp. 74–85. Schwartz, J. (1994) Air pollution and daily mortality: a review and meta analysis. Environ Res, 1994; 64: 36-52 Schwartz, J. (1997) Air pollution and hospital admissions for cardiovascular disease in Tucson, Epidemiology, vol. 8, pp. 371–77. Schwartz, J. (1999) Air pollution and hospital admissions for heart disease in eight US counties, Epidemiology, vol. 10, pp. 17–22. Schwartz, J., Spix, C., Touloumi, G., Bachárová, L., Barumamdzadeh, T., Le Tertre, A., Piekarski, T., Ponce de Leon, A., Ponká, A., Rossi, G., Saez, M., Schouten, J.P. (1996) Methodological issues in studies of air pollution and daily counts of deaths or hospital admissions, Journal of Epidemiology and Community Health, vol. 50, (supplement 1), pp. S3–S11. Sheppard, L., Levy, D., Norris, G., Larson, T.V., and Koenig, J.Q. (1999) Effects of ambient pollution on nonelderly asthma hospital admissions in Seattle, Washington, 1987–1994, Epidemiology, vol. 10, pp. 23–30. Sieg, H., Smith, V.K., Banzaf, H.S and Walsh, R.(2000) Estimating the General Equilibrium Benefits of Large Policy Changes: the Clean Air Act Revisited, National Bureau of Economic Research, Working Paper 7744, NBER, Cambridge, Mass. Simpson, R., Williams, G., Petroeschevsky, A., Morgan, G., and Rutherford, S. (1997) Associations between outdoor air pollution and daily mortality in Brisbane, Australia, Archives of Environmental Health, vol. 52, no. 6, pp. 442–54. Small, K. A., and Kazimi, C. (1995) On the costs of air pollution from motor vehicles. Journal of Transport Economics and Policy, January, 7-32. Streeton, J.A. (1997) A review of existing health data on six air pollutants, a report to the National Environment Protection Council, National Environment Protection Council, Adelaide. TER (1996) Valuing morbidity: an integration of the willingness to pay and health status index literatures, Durham, NC. Tol, R (2000) External Costs of Emissions of Greenhouse Gasses, paper presented at External Costs of Energy Conversion- improvement of the Extern-E Methodology and Assessment of Energy-related Transport Externalities, Vlaams Europees Conferentiecentrum, Brussels, May 10, 2000.
Valuing Air Quality Impacts of Transportation: A Review of Literature
Page 37
Touloumi, G., Katsouyanni, K., Zmirou, D., Schwartz, J., Spix, C., Ponce de Leon, A., Tobias, A., Quennel, P., Rabczenko, D., Bacharova, L., Bisanti, L., Vonk, J.M., and Ponka, A. (1997) Short-term effects of ambient oxidant exposure on mortality: a combined analysis within the APHEA project, American Journal of Epidemiology, vol. 146, no. 2, pp. 177–85. Touloumi, G., Samoli, E., and Katsouyanni, K. (1996) Daily mortality and “winter type” air pollution in Athens, Greece—a time series analysis within the APHEA project, Journal of Epidemiology and Community Health, vol. 50 (supplement 1), pp. s47–51. Transfund New Zealand (2002) Transfund NZ’s Project Evaluation Manual, Amendment No. 6, 1 September 2002, New Zealand. Tsolakis, D. and N. Houghton (2003) Valuing environmental externalities, Proceedings of the 21st ARRB and 11th REAAA Conference, 18-23 May 2003, Cairns, Queensland, Australia. United Kingdom Committee on the Medical Effects of Air Pollutants (1998), Quantification of the effects of air pollution on health in the United Kingdom, The Stationery Office, UK Department of Health, London. US EPA (1997) The Costs and Benefits of Clean Air Act. U.S. Environmental Protection Agency. US EPA (1999a) Indicators of the Environmental Impacts of Transportation, Office of Policy and Planning. U.S. Environmental Protection Agency. US EPA (1999b) The Benefits and Costs of the Clean Air Act, 1990 to 2010. EPA Report to Congress. U.S. Environmental Protection Agency. US EPA (1999c) Regulatory Impact Analysis for the Final Regional Haze Rule. U.S. Environmental Protection Agency. US National Climate Data Center (2001) [http://www.ncdc.noaa.gov] Accessed October 2005. van der Zee, S., Hoek, G., Boezen, H.M., Schouten, J.P., van Wijnen, J.H., Brunekreef, B. (1999) Acute effects of urban air pollution on respiratory health of children with and without chronic respiratory symptoms, Occupational Environmental Medicine 56(12), pp. 802-12. van Vliet, P., Knape, M., de Hartog, J., Janssen, N., Harssema, H., Brunekreef, B. (1997) Motor vehicle exhaust and chronic respiratory symptoms in children living near freeways, Environmental Research 74(2), pp. 122-32. Venn, A.J., Lewis, S.A., Cooper, M., Hubbard, R., Britton, J. (2001) Living near a main road and the risk of wheezing illness in children, American Journal of RespiratoryCritical Care Medicine 164(12), pp. 2177-80. Viscusi, W.K. (1992) Fatal Tradeoffs: Public and Private Responsibilities for Risk. Oxford University Press, New York. Viscusi, W. K. (1993) "The value of risks to life and health", Journal of Economic Literature, Vol. XXXI, pp. 19121946. Viscusi, W.K., Magat, W.A., and Huber, J. (1991) Pricing health risks: survey assessments of risk-risk and dollar- risk tradeoffs, Journal of Environmental Economics and Management, Vol. 21, No. 1, pp32-51. Viscusi, W.K. and Aldy J.E. (2003) The Value of a Statistical Life:A Critical Review of Market Estimates Throughout the World, Journal of Risk and Uncertainty, Vol. 27, No.1, August Issue. Viscusi, W.K. and Aldy J.E. (2004) Age variations in workers’ value of a statistical life, Discussion Paper No.468, Harvard Law School, Cambridge, MA 02138. Ware, J.H., Ferris, B.G., Dockery, D.W., Spengler, J.D., Stram, D.O., and Speizer, F.E. (1986) Effects of ambient sulfur oxides and suspended particles on respiratory health of preadolescent children, American Review of Respiratory Diseases; 133: pp.834-42. Watkiss, P (2002). Establishing environmental externalities’. In ‘Clean generation? – Independent perspectives on pollution and waste from electricity generation’, published by British Energy, 2002.
Valuing Air Quality Impacts of Transportation: A Review of Literature
Page 38
Watson, J.G., (2002). Visibility: Science and Regulation. Air and Waste Management Association, Vol 52, pp. 628-713. Wordley, J., Walters, S., and Ayers, J.G. (1997) Short term variations in hospital admissions and mortality and particulate air pollution, Occupational Environmental Medicine, vol. 54, pp. 108–16. World Development Report (WDR) (1993) Investing in Health. Washington, D.C. The World Bank. World Health Organisation (WHO) (1999) Air quality guidelines for Europe, Geneva. World Health Organisation (WHO) Working group (2000a) Quantification of the health effects of exposure to air pollution, report of a World Health Organization working group, Bilthoven, Netherlands, November. World Health Organization (WHO) (2000) Quantification of the health effects of exposure to air pollution. Report of a WHO working Group, Bilthoven, Netherlands. WPRO (2004) Public Health Monitoring of the Metro Manila Air Quality Improvement Sector Development Program, Main Report, March 2004, p 144. Yang, M. (1998) Transportation and Environment in Xiamen, Transportation Research D, 3 (5), 297-307. Yang, W., Jennison, B.L., Omaye, S.T. (1998) Cardiovascular disease, hospitalisation and ambient levels of carbon monoxide, Journal of Toxicology and Environmental Health, vol. 55, pp. 185–96. Yang, M. (2002) Climate Change and GHGs from Urban Transport. Document 10B, Promotion of Renewable Energy, Energy Efficiency and GHG Abatement Program, Asian Development Bank.
Valuing Air Quality Impacts of Transportation: A Review of Literature
Page 39