USABILITY AND ACCEPTANCE OF E-LEARNING IN STATISTICS EDUCATION, BASED ON THE COMPENDIUM PLATFORM S. Poelmans, P. Wessa, K. Milis, E. Bloemen, C. Doom Hogeschool-Universiteit Brussel Brussels, Belgium
[email protected]
Abstract E-learning systems, also known as a virtual learning environments (VLE’s), are systems that use modern information and communication technology to support education and training efforts. In this paper we present the evaluation of a newly developed Compendium Platform (CP) that can be used to create educational applications that support effective learning of statistics and related analytical skills. Using the web-enabled CP, students are empowered to easily archive, exchange and reproduce statistical computations. The CP was applied in three statistics courses. Based on behavioral concepts from the Technology Acceptance Model (usefulness, ease of use and future usage intention) and object-based beliefs about the e-learning environment (information and system qualities), we tested an integrated and predictive e-learning acceptance model. Using a sample of 200 students, we report that the CP was well accepted and that the majority of our hypotheses are confirmed. System quality has a considerable impact on ease of use and does directly influence the students’ intention to use the CP in the future. The effect of information quality on intention is fully mediated by relative advantage. Relative advantage was used as an alternative to usefulness and is clearly a better predictor of usage intention. A detailed analysis indicates that the attractiveness of the user interface, the presence of appropriate search options and the availability of sufficient relevant information are critical success factors of the CP’s acceptance.
Keywords E-learning, Virtual Learning Environment, Technology Acceptance, IS Success, Website Usability, Compendium, Statistics Education
1. INTRODUCTION E-learning systems, also known as virtual learning environments (VLE’s), are systems that use modern information and communication technology to support education and training efforts [23]. Elearning consists of a repository for courses, manuals, exercises, interactive options and also (mass) communication functionalities that can assist the study process of individuals or groups of students. There are several advantages that can be achieved such as the creation of an (a)synchronous learning network, and the possibility to offer the learners a wide range of information sources and examples. The goal of e-learning is to increase the quality of learning activities by re-using and sharing information and knowledge, while the learner can determine his own pace [23],[15],[13]. In this paper we present the evaluation of a newly developed Compendium Platform (CP) that can be used to create educational applications that support effective learning of statistics and associated analytical skills (see [9]). The novelty of the CP lies in the fact that students are empowered to easily archive, exchange, reproduce, and reuse statistical computations. Using full text search phrases or keywords, students can access an archive of statistical manuals and exercises. The CP was implemented in three statistics courses and assessed by students in a survey. The goal of this article is two-fold. First we aim at evaluating the success of the CP. Second we want to propose a predictive and re-usable success model (on which the survey was based). The paper is structured as follows. In section 2 we give a concise overview of the literature on technology acceptance and IS success. This literature provides the underlying rationale for the research model and the hypotheses that we present in section 3. The research setting, applied
methods and the used measures are presented in section 4. In section 5 and 6 we analyze the data and present the results and the conclusions.
2. LITERATURE REVIEW E-learning seems to be on the verge of becoming the new learning paradigm. Some estimate that the e-learning market has a growth rate of up to 35% [23]. However, the benefits of such systems cannot be realized if learners do not accept or use the system in an appropriate manner [20],[15]. It is therefore important to investigate the drivers or determinants of e-learning success to assist VLE designers and lecturers in building systems that are useful and accepted by the end-user, being the learners. The use, success, and acceptance of information systems have been investigated in an overwhelming amount of studies. In general, two widespread and successful research models to measure and predict IS success can be distinguished: the technology acceptance model (TAM) created by Davis [1] (and extended into TAM2 [27]), and the IS success model of Delone and Mclean [7],[8]. Both models focus on the individual end-user and have been applied to assess a diversity of IT systems (like ERP, systems, GSS systems, CRM systems, e-Commerce, etc.) (e.g. [1],[12],[20],[6],[29]). Recently, these models also have been successfully applied to study the success of VLEs (such as in [23],[15],[25],[17],[18]). The TAM is a parsimonious model with grounded concepts and standardized measures. A strength of TAM is that it is specifically developed to predict and explain human behavior by measuring behavioral beliefs like “ease of use”, “usefulness” and “intention to use”. The TAM assumes that an IS is successful and accepted if users (will) use the system voluntarily. The TAM has been compared favorably with competing models such as the theory of planned behavior and the theory of reasoned action [27]. It is robust and has been used across different cultures, settings and information systems. Despite the fact that several studies have extended the model with a variety of explanatory variables a number of personality traits like computer anxiety or perceived self-efficacy (e.g. [25],[18]); social influences and service quality (the TAM2 ([27]); and concepts from the innovation literature ([29]) - the TAM in itself does not propose guidelines about design options or information qualities that can impact the acceptance of information technologies [28],[26]. Contrary to the TAM, the Delone & McLean’s IS success model identifies more objective system and information characteristics that may enhance user satisfaction and the usage and value of an information system [7],[8]. By focusing on design attributes (like system reliability or the quality of the provided information), the IS success model is more appropriate to provide designers with guidelines to build improved IS’s. Object-based concepts that measure specific system qualities however are mostly weak direct predictors of system usage [28]. Also a concept such as user satisfaction (often used in the Delone and McLean’s approach) constitutes a general attitude that tends to correlate only to a limited extent with single behaviors such as the future usage of an information system [28],[5]. Although a number of studies have used certain concepts (or measures) from the TAM and the IS Success model interchangeably, Wixom et al. ([28]) have integrated both approaches on a theoretical and conceptual level. These authors also validated their integrated research model using a sample of 465 users of data warehousing software. In short, Wixom et al. propose to use design characteristics (system and information qualities from the IS Success model) as determinants of Davis’ behavioral beliefs. Since two research goals guide this study – explaining and predicting the acceptance of the compendium platform and improving and extending its design – we use the integrated model as a starting point.
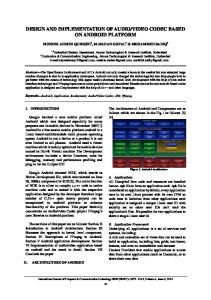
3. RESEARCH MODEL Drawn from Wixom et al [28] and thus using a combination of the TAM and the IS success frame of reference, we propose the parsimonious model shown in Figure 1.
Information Quality
Usefulness
Intention System Quality
Ease of Use
Object-based (IS Success)
Behavioural Beliefs (TAM)
Figure 1: The Research Model used in this paper In this model, “intention to use” is employed as a predictor of future usage. It was not useful to measure “the frequency of usage”. Although students did receive additional texts and papers, usage was mandatory because they had to use the CP to do their assignments, and they did not receive any lectures in addition to the compendium platform. The three concepts on the right side of the model belong to the TAM and are behavioral beliefs. Information and system quality are object-based concepts from the IS success model of Delone & Mclean. In correspondence with the literature, the model assumes that “perceived usefulness” and “ease of use” will mediate the influence of respectively “information quality” and “system quality” on “intention to use”. The quality of the information content of the system should indeed lead to the perception of functional usefulness and therefore to the intention to use the system in the future. On the other hand, the quality of the system itself (e.g. technical stability and reliability, sufficient search and navigational functionalities, attractiveness of the user interface) is supposed to lead to a system that is easy to use, which again is assumed to contribute to the perceived usefulness and an increased intention to use the e-learning environment. In order to investigate whether the mediation effects are partial or full, a direct relationship is added between system and information quality and intention to use. System quality can be defined as the stability, reliability and suitability of the hardware and software that provides the information that is required. It is a broad concept that has been measured in different ways [7],[30],[22]. Because our project is a web-based solution, we turned to the website usability literature to give the concept a concrete meaning. Following this literature we included dimensions such as navigation features, reaction speed, stability of the system, responsiveness (the ability of the software to give error messages or to recover actions), and (online) help functions (see [19],[31],[24], [16]). Information quality is a multi-dimensional concept that covers dimensions such as the understandability, the relevancy, the completeness and the effectiveness of the information provided by an information system [7],[15].
4. RESEARCH DESIGN 4.1. Sample and Procedure In January 2008, a field survey was conducted to test our research model and to evaluate the CP. At the end of the semester, after their final exam in statistics, students were given a printed, anonymous questionnaire to evaluate the compendium platform. The CP has been applied in three courses (three groups of students). At that time, students had been using the system for three months. They had received a hands-on training during the first classes but they were not given any additional lectures on statistics. The groups met every week to receive their
assignments (which were to be performed in small groups of 3 to 5 students). Questions could be asked through the electronic forum in the CP and groups were also given the assignment to evaluate the performance of their peers. After the exclusion of missing values, the sample that we tested in this study consists of 200 respondents, corresponding to a response rate of 81%. All respondents belong to the same cohort. Students were on average 21 years old, and they were preparing for their final master year. They either possessed a professional bachelor’s degree in business economics or business administration or they were in the final year of their bachelor in business economics. All students had previously received one or more basic statistical courses. The level of the statistics course in which they were using the compendium platform can be considered as intermediate.
4.2. Measurement Several items were used per construct. We based ourselves on existing scales and adapted or completed them if required. All items were measured on a 5-point likert-scale, ranging from 1 (totally disagree) to 5 (totally agree). Perceived Ease of Use, Perceived Usefulness and Intention to Use These three concepts stem directly from the TAM. We used an adapted version of the items that were proposed by Davis (1989). A concept that is similar to “perceived usefulness” is “relative advantage” (see for example [12]). By comparing the usefulness of a current system with an alternative, relative advantage implies a benchmark. In this study, all students had received statistical courses before, so we asked them to compare the CP with the more traditional lectures they had received in statistics so far. We tested the research model twice, altering between usefulness and relative advantage as a determinant of intention to use. Each construct was measured using 2 to 5 reflective items. The questions can be found in the appendix. System Quality In other to measure the quality of hard- and software of the compendium, we chose to use 11 items from the CSUQ (Computer System Usability Questionnaire). The CSUQ was developed at IBM and is composed of 19 questions [24],[14]. The 11 items measure several dimensions of website usability, including navigation possibilities (scrolling, navigating between pages, hyperlinks), (reaction) speed, stability of the system, responsiveness (such as error messages and recovery options) and help features (the available online help). System quality was measured with formative items because several features are independent of each other (e.g. good navigation features do not guarantee that the system has sufficient online help). The 11 items can be found in the appendix. Information Quality Since the CSUQ is a broad questionnaire measuring several aspects and dimensions, we also used it as a source to measure information quality. We kept and adapted 5 items, measuring: the organization, understandability, effectiveness and completeness of the information (the content) that is provided by the CP. Because of the different meanings of the dimensions, information quality was measured using formative items.
4.3. Research Method Next to descriptive statistics, we used PLSGraph and thus applied “partial least squares” (PLS) to test our explanatory model. PLS is less restrictive than covariance-based structural equation modeling such as LISREL or AMOS in terms of sample size and distributional requirements [3],[2]. PLS combines a structural model (i.e. theoretical relationships (or paths) between constructs) with a measurement model (i.e. relationships between a construct and its indicators (or items)). Contrary to other SEM methods, PLS does not require normality of the dependent variables. It has become very
popular in the past 10 years with multiple applications in IS-related journals such as “Information & Management”, “Computer & Education” or “Information Systems Research”. According to a generally accepted guideline, a sufficient sample to conduct PLS should be: (i) at least 10 times the number of formative items belonging to the most complex construct; or (ii) at least 10 times the highest number of structural paths leading to one factor, if this number exceeds the highest number of formative items [4]. In this paper, the number of structural paths is limited and system quality has 11 formative items, thus a sample of 110 would have been sufficient. Convergent validity was evaluated by examining the factor loadings; the recommendation of Hair et al. [11] is that those greater than 0.5 are considered to be significant. All factor loadings of the reflective items in the model are greater than 0.7, demonstrating more than adequate convergent validity. Discriminant validity is achieved (i) when the PLS indicators (items) load much higher on their own latent variable than on other variables, and (ii) when the square root of each construct's Average Variance Extracted (AVE) is larger than its correlations with other constructs [3]. In our sample both condifitions are met. The relevant loadings, correlations and AVE’s can be obtained from the authors upon request.
5. RESULTS Based on the sample of 200 students, the mean scores on intention, relative advantage and perceived usefulness are respectively 3.84, 3.54 and 3.56 on a 5-point Likert scale. These results show that CP is well accepted in general. In particular, 157 students give a positive score (more than a neutral “3”) for intention, thus indicating that they accept the CP and intend to use in the future. For relative advantage and perceived usefulness, the number of respondents giving a positive evaluation (more than 3) are respectively 128 and 149. Although usefulness and relative advantage are similar concepts and significantly correlated (a correlation coefficient of 0.52), the scores on relative advantage are more dispersed. Whereas only 16 respondents give a negative score for usefulness (less than 3), 35 students give a negative evaluation for relative advantage. These results are not surprising. As students had no real alternative for the compendium, it is likely that most of them will find it more or less “useful” to use the compendium to perform their assignments and to prepare for their final exam. Relative advantage, i.e. the extent to which an information system is perceived as being better then a known alternative, on the contrary, invites students to take a more critical stance and to compare the compendium to a reference point; the previous courses they have had in statistics. The difference between usefulness and relative advantage is also reflected in our research models in figure 2. We tested 2 similar models, alternating between usefulness and relative advantage as predictors of intention. The coefficients and R squares are presented in figure 2.
Figure 2: Research Model Results, using PLS Figure 2 shows that most of our hypotheses are confirmed. Information quality and system quality are important object-based concepts that directly influence behavourial beliefs like relative advantage, usefulness and ease of use. The effect of these concepts on intention needs more explanation. Figure 2 indicates that relative advantage was the best predictor of “intention to use”, fully mediating the impact of information quality. However, usefulness did not even partially mediate the impact of information quality on intention and could not be used in our sample to predict intention. Again, this result does not come as a surprise. It seems reasonable that only students who compare the CP favorably to an alternative with which they are familiar are likely to use it in the future. We therefore claim that to evaluate an innovative technology like a virtual learning environment a concept such as relative advantage is preferable to a more general concept like “usefulness” that lacks an explicit reference point. This is in correspondence with some findings in the literature (e.g. [12]). The fact that ease of use is not a direct predictor of intention has also been confirmed in the literature on the TAM [10]. Ease of use does influence usefulness (and to a much lesser extent relative advantage), but providing an easy to use learning platform is not sufficient. As students get more acquainted with the technology, they focus more on its instrumental value and the information content that it provides. The importance of system quality is also depicted in Figure 2. A well-designed platform should be stable and provide the learner a number of functionalities (help, feedback, search options) so that the information that it contains can be retrieved and accessed as required. In both models, system quality is not only a strong predictor of ease of use, but it also directly impacts intention. Additional tests also reveal that system quality does not directly impact usefulness, but it does have a significant effect on relative advantage. In sum, a sufficient level of system quality can be seen as a necessary and important condition for future use. In order to have more clues as to how we can improve the CP, we looked at information and system quality on a more detailed level. In Table 1 we present the different indicators of information quality and their correlation with the key concepts of the TAM. In Table 2 a similar correlation table is shown with the indicators of system quality.
IQ-1
IQ-2
IQ-3
IQ-4
IQ-5
intention
0.17**
0.13*
0.19**
0.13*
0.34***
rel.adv.
0.32***
0.28***
0.37***
0.16**
0.52***
usefulness
0.34***
0.33***
0.39***
0.12*
0.36***
Table 1: Kendall Correlation Coefficients between Information Quality items and TAM constructs (see also http://www.wessa.net/rwasp_iceri20081.wasp)
SQ-1
SQ-2
SQ-3
SQ-4
SQ-5
SQ-6
SQ-7
SQ-8
SQ-9
SQ-10
SQ-11
Intention
0.11
0.15*
0.2***
0.21***
0.26***
0.28***
0.15**
0.12*
0.29***
0.22***
0.15*
ease of use
0.26***
0.17***
0.23***
0.36***
0.36***
0.25***
0.11
0.16***
0.1
0.14*
0.05
Table 2: Kendall Correlation Coefficients between System Quality items and TAM constructs (see also http://www.wessa.net/rwasp_iceri20082.wasp)
Table 1 shows that all the information quality (IQ) indicators correlate significantly with relative advantage (coefficients from .16 to .52), usefulness (coefficients from .12 to .39), and intention (coefficients from .13 to .34). IQ-4, the organization of information on different website pages, is least correlated with usefulness and relative advantage. The direct correlations of IQ indicators with intention are, as can be expected, significantly lower. In general, “content sufficiency and effectiveness” (IQ-2, IQ-3, IQ-5), and “ease of finding information” (IQ-1) are important dimensions of information quality that correlate well with relative advantage and usefulness. Table 2 indicates that 10 items of system quality are significantly correlated with intention. 8 items are significantly correlated with ease of use. The presence of sufficient functionalities (SQ-5) and the “quality of the interface” (SQ-3, SQ-4, SQ-6 and SQ-8) are the most important dimensions of system quality, correlating strongly with ease of use and intention to use. In sum, we conclude that (course) content, search options, and the attractiveness of the user interface should receive special attention to improve the CP. This finding is in correspondence with our own experiences. The CP contains more than 4800 pages of information and for students it is a challenge to search for the appropriate pieces of information when completing an assignment.
6. CONCLUSIONS In this study we present the evaluation of a newly developed Compendium Platform (CP) that can be used to create educational applications that support effective learning of statistics and associated analytical skills (see [9]). The novelty of the CP lies in the fact that students are empowered to easily archive, exchange, reproduce, and reuse statistical computations. The goal that guides this study is two-fold: evaluating the usage of the CP and testing a predictive acceptance model that can help us in improving and extending the compendium and other virtual learning environments. Based on the literature on technology acceptance and IS success, we developed a parsimonious model, integrating the behavioral beliefs of the technology acceptance model (TAM) with the objectbased concepts of the IS Success Model of Delone and Mclean. In particular, the model includes information and system quality as multi-dimensional concepts that are supposed to have a direct impact on the usefulness and ease of use of the compendium. As an alternative to usefulness, we also used relative advantage, i.e. the comparison of the compendium to conventional statistical classes that students had received previously.
Usefulness (or relative advantage) and ease of use are proposed as a direct predictor of the intention to use the system. The model also tests the direct impact of information and system quality on intention. Because CP is a web-based solution, we turned to the website usability literature to measure system and information quality (both concepts include several dimensions). Multiple items were used per construct and scales from the literature were adapted or completed if required. Based on a survey with a sample of 200 students across three comparable courses in statistics, the scores on intention and relative advantage show that CP is well accepted. In particular, more than 150 students give a positive score for intention. After performing reliability and validity checks, the “partial least squares” (PLS) method was used to test our research model. We report that the majority of our hypotheses are confirmed. System quality has a considerable impact on ease of use and does directly influence intention. The effect of information quality on intention is fully mediated by relative advantage. Relative advantage is clearly a better predictor than the perceived usefulness of the system (as defined in the TAM). On a detailed level, “content sufficiency and effectiveness”, and “ease of finding information” are dimensions of information quality that correlate most with relative advantage, usefulness and intention. The presence of sufficient functionalities and the attractiveness of the user interface are important dimensions of system quality, correlating strongly with ease of use and intention. In sum, (course) content, search options, and the user interface should receive special attention to improve the CP. In the future, new variables will be added to increase the explanatory power and practical use of the research model. Unlike traditional e-learning environments, the CP allows us to measure in an objective way activity-based learning processes which yields information that was never observed before, for example: actual use of the computational framework; the creation of archived computations; the reproduction of archived computations for the purpose of peer review; social collaboration between students who work on assignments; actually submitted feedback messages to peers; observed fraud and free riding. This objective information will be complemented with examination results that measure conceptual understanding, and additional personal characteristics such as: attitudes towards learning and critical thinking; prior knowledge; and perceived learning experiences. The CP can and will also be used to build new applications that allow us to research a variety of computer-assited, pedagogical learning styles (for example the learning-by-doing approach based on educational games). The underlying research question relates to our conjecture that technology acceptance does not only depend on usability, system quality, and relative advantage, but also on the pedagogical paradigm in which the course is embedded. Finally, in order to present more general results, there is a need to use the usability model and to evaluate the CP in a more diverse student population (including non-academic education, and academic master students).
References [1] Amoako-Gyampah K. & A. F. Salam (2004), An extension of the technology acceptance model in an ERP implementation environment, Information & Management, Vol. 41(6), pp. 731-745. [2] Barclay D., Higgins C. & R. Thompson (1995), The Partial Least Squares Approach to Causal Modeling, Personal Computer Adoption and Use as an Illustration, Technology Studies, Vol. 2 (2), pp. 285-309. [3] Chin W. (1998), Issues and opinion on structural equation modelling, MIS Quarterly, Vol. 22 (1), pp. 7-16. [4] Chin, W. & P.R. Newsted (1999), Structural equation modelling analysis with small samples using partial least squares, in: R. Hoyle (ed.), Statistical Strategies for Small Sample Research, Sage Publications. [5] Davis, F. D. (1989), Perceived usefulness, perceived ease of use, and user acceptance of information technology, MIS Quarterly, Vol.13 (3), pp. 319-340. [6] Delone W. & E.R. Mclean (2004), Measuring e-Commerce Success: Applying the DeLone & McLean Information Systems Success Model, Vol. 9(1), pp. 31-47. [7] Delone W. & E.R. Mclean (2003), The DeLone and McLean Model of Information Systems Success: A Ten-Year Update, Journal of Management Information Systems, Vol. 19 (4), pp. 9–30.
[8] DeLone, W.H., & E.R. McLean (1992), Information Systems Success: The Quest for the Dependent Variable, Information Systems Research, Vol. 3 (1), pp 60-95. [9] freestatistics.org [10] Gefen D. & D. Straub (2000), The Relative Importance of Perceived Ease-of-Use in IS Adoption: A Study of e-Commerce Adoption, Journal of the Association for Information Systems, Vol. 1 (8), pp. 1-30. [11] Hair J.F., Anderson R.E., Tatham R.L. & W.C. Black (1992), Multivariate Data Analysis with Readings, 3rd edn. Macmillan, New York. [12] Karahanna E., Ahuja M., Srite M., & J. Galvin (2002), Individual differences and relative advantage: the case of GSS, Decision Support Systems, Vol. 32, pp. 327– 341. [13] Katz Y.J. (2002), Attitudes affecting college students' preferences for distance learning. Journal of Computer Assisted Learning, Vol. 18 (1), pp. 2-9. [14] Lewis J. R. (1993), IBM Computer Usability Satisfaction Questionnaires: Psychometric, 39 pp. Evaluation and Instructions for Use, Technical Report 54.786, IBM Corporation. [15] Lin H-F. (2007), Measuring Online Learning Systems Success: Applying the Updated DeLone and McLean Model, CyberPsychology & Behavior, Vol. 10 (6), pp. 817-820. [16] Lu J. (2003), A model for evaluating e-commerce base don cost/benefit and customer satisfaction, Information Systems Frontiers, Vol. 5 (3), pp. 265-277. [17] Martins L. L. & F.W. Kellermanns (2004), A model of business school students’ acceptance of a web-based course management system, Academy of Management Learning and Education, 3, pp. 7-26. [18] Ong C-S., Lai J-Y., & Y-S. Wang (2004), Factors affecting engineers’ acceptance of asynchronous e-learning systems in high-tech companies, Information & Management, Vol. 41 (6), pp. 795–804. [19] Palmer W. (2002), Web site usability, design, and performance metrics, Information Systems Research, Vol. 13 (2), pp. 151-167. [20] Pavlou P. (2003), Consumer Acceptance of Electronic Commerce: Integrating Trust and Risk with the Technology Acceptance Model, International Journal of Electronic Commerce Vol. 7 (3), pp. 101 – 134. [21] Pituch K.A. & Y-K. Lee (2006), The influence of system characteristics on e-learning use. Computers & Education, Vol. 47 (2), pp. 222-244. [22] Seddon P.B. (1997), A respecification and extensión of the Delone and McLean model of IS Success, Information Systems Research, Vol. 8 (3), pp. 240-253. [23] Sun P-C., Tsai R.J., Finger G., Chen Y-Y. & Y. Dowming (2008), What drives a successful eLearning ? An empirical investigation of the critical factors influencing learner satisfaction, Computers & Education, Vol. 50 (4), pp 1183-1202. [24] Tullis T. & J.N. Stetson (2004), A Comparison of Questionnaires for Assessing Website Usability, in Proceedings of the 13th International Usability Professionals Association (UPA) Conference, June 2004, Minneapolis/MN, USA. [25] van Raaij E.M. & J.L. Schepers (2008), The acceptance and use of a virtual learning environment in China, Computers & Education, Vol. 50 (3), pp. 838-852. [26] Venkatesh V., Morris M., Davis G. & F. Davis (2003), User acceptance of information technology:Toward a unified view, MIS Quarterly, Vol. 24 (3), pp. 425-478. [27] Venkatesh V. & F. D. Davis (2000), A theoretical extension of the technology acceptance model: Four longitudinal field studies. Management Science, Vol.46 (2), pp. 186-204. [28] Wixom B.H. & P. A. Todd (2005), A Theoretical Integration of User Satisfaction and Technology Acceptance, Information systems research, Vol. 16 (1), pp. 85-102. [29] Wu I-L. & K-W. Wu (2005), A hybrid technology acceptance approach for exploring e-CRM adoption in organizations, Behaviour & Information Technology, Vol. 24 (4), pp. 303-316. [30] Wu J-H. & Y-M. Wang (2006), Measuring KMS Success: A respecification of the Delone and Mclean’s model, Information & Management, Vol. 43 (6), pp. 728-739. [31] Zviran M., Glezer C. & I. Avni (2006), User satisfaction from commercial web sites: The effect of design and use, Information & Management, Vol. 43 (2), pp. 157-178.
Appendix Intention to Use 1. I intend to use this website when I need to apply statistics in the future 2. Next year, I will probably use the website/software again if I have to do statistical assignments Relative Advantage 1. Learning Statistics with this website is more effective than with a traditional handbook 2. To learn statistics, this website is better than the statistical courses I have had so far Perceived Usefulness 1. I can effectively complete my work using this website 2. I am able to complete my work quickly using this website 3. I am able to efficiently complete my work using this website Perceived Ease of Use 1. It was simple to use this website 2. I feel comfortable using this website 3. It was easy to learn to use this website 4. I believe I became productive quickly using this website Information Quality (IQ) 1. It is easy to find the information that I need 2. The information provided by the website is easy to understand 3. The information is effective in helping me complete the tasks and scenarios 4. The organization of information on the website pages is clear 5. The content of the website meets my expectations System Quality (SQ) 1. Whenever I make a mistake using the website, I recover easily and quickly 2. The information (such as online help, online messages, and other documentation) provided with this website is clear 3. The interface of this website is pleasant 4. I like using the interface of this website 5. This website has all the functions and capabilities I expect it to have 6. The website contains sufficient hyperlinks to navigate 7. I found scrolling frustrating when using the website * 8. It is easy to move from one page to another 9. Overall, I found that the website was able to quickly perform statistical computations 10. Overall, the websites reacts quickly and I don’t have to wait too long to go to a new page or to download information 11. The software is stable and doesn’t crash regularly
*This question was reverse coded