URBAN GROWTH AND COMMUTING PATTERNS OF THE POOR IN BANGKOK
R. Choiejit 1 and R. Teungfung 2
1
Department of Economics, Faculty of Social Science Srinakharinwirot University, Bangkok, Thailand.
[email protected] 2 Department of Social Science, Faculty of General Education, Rajamangala Institute of Technology, Nonthaburi, Thailand.
[email protected]
Abstract This paper aims to describe causes of urban growth in Bangkok and to investigate the commuting patterns of the poor in Bangkok. The result indicates that population growth, both in terms of natural increase and a large number of net in-migrants coupled with rapid economic growth prior the economic crisis in Thailand. And also the ineffective land use policy and regulations of federal and local authorities and the promotion of land transport and private vehicle use, also increase Bangkok urban area rapidly. Negative effects of rapid growth of Bangkok are identified. Moreover, the result also reveals commuting patterns are different among commuter’s demographic and household characteristics. Majority of commuters commute to work within their residential districts, particularly commuting within outer of Bangkok. Public transport and non-motorized mode are the necessary mode of transport for the poor and low status commuters in terms of levels of education and affordability. Comprehensive land use policy and practices are needed to investigate and implement. Mass rapid transport is needed to construct throughout the city as an effective transportation network. Keywords: Commuting Patterns in Bangkok, Growth of Bangkok urban area Introduction This paper aims to describe the growth of Bangkok, a capital city of Thailand, and to explore the commuting patterns of Bangkok’s residents, particularly the poor. This paper contains two major chapters, the first one mainly describe the growth of Bangkok. The latter one describes the commuting patterns of the poor and other characteristics of Bangkok’s commuters. The objective of the first chapter is to analyze causes of urban growth in Bangkok. Secondary data from various government and non-government sources are collected and analyzed for the first chapter. Household Traveling Survey compiled by the Department of Traffic and Transportation, Bangkok Metropolitan Administration (BMA) in 1999,is employed to investigate the commuting patterns of working age commuters who travel to work within BMA. Descriptive statistics are also employed to this study to explore the different characteristic of Bangkok’s commuters.
2 Growth of Bangkok Bangkok in early settlement Since King Rama I (Phra Buddha Yodfa Chulaloke) had established Krung Rattanakosin as the new capital city of Thailand in 1782 when it was moved from Krung Thonburi, at the west side to the east side of Chao Phraya River, and named officially “Krung Thepmahanakorn” or “Bangkok”. During the early period of Krung Rattanakosin (King Rama I to King Rama III reigns), the people were rely mainly on waterways and using boats for their commuting. Most of the people settled along both sides of the Chao Phraya riverbank and along the both sides of several canals nearby. Many canals were excavated during this period, Bangkok had many canals for transportation so it was known as “Venice of the East”. After the changing of the national policy to attached the world economy by King Rama IV, this shift transportation system from waterways to roadways. Many roads were constructed lined from the south of the city paralleling with the Chao Phraya River which passed through many business areas and foreign consular offices. This widen urban areas in the south of city. During King Rama V Reign, many roads were widened and improved, and many new ones were constructed in Bangkok, like a city in most of the western countries. Railway was constructed from Bangkok to other provinces throughout the country. The motor car was first introduced in the period of King Rama V. Roadways was become widely used when many roads were also built throughout city of Bangkok. Roadway transport was increasingly important, while waterways was declined in use. Besides, rail and tram transports were also introduced during King Rama V period. Rail was mainly used to connect between Bangkok and other provinces, while trams served for public transportation within Bangkok. During King Rama VI Reign, many roads and bridges were built for instance, King Rama VI Bridge, the first bridge over Chao Phraya River connecting the southern railway to central railway station “Hua Lumpong Railway Station”. The second bridge over Chao Phraya River and named “Buddha Yodpha Chulaloke” was built in 1932 connecting Bangkok to Thonburi, the west side of Chao Phraya River. This has brought civilization into Thonburi. In the period of King Rama VI Reign, new canal was no more dug. Most of these canals were filled, only major canals remains. Unfortunately, during the later periods public transportation by tram become less important and was gave up in finally, because of the promoting on roadways transport and private car use (Surasawadi, 2000; Ruengsilp, 1984; Poboon, 1997). Bangkok in Current Period Population Growth From the 1st to the 8th National Economic and Social Development Plans (19612001), has been focused the country development through industrial development. Bangkok has become as a center for economic development accompanied with rapid population growth. The population has increased from 2.1 millions in 1960 to 3.1,4.7 and 6.3 millions in 1970,1980 and 2000 respectively. The growth rate was higher than 3 % per annum during 1960 – 1970, and declined rapidly during the late 20 years. The growth rate between 1970 1980 was approximately 2.27 % per annum and continue to decline to 0.66 % per annum during 1990 – 2000.
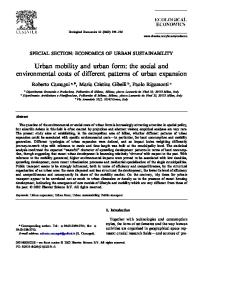
3 Figure 1 Bangkok in the reign of King Rama I (above left ), Reign of King Rama III (above right), Reign of King Rama V (bottom left) and Reign of King Rama VII (bottom right), respectively.
Source: Suthiranart, 2001.
4 Such population growth in Bangkok was mainly due to its natural growth coupled with, more importantly, a huge migrants from other provinces to Bangkok (Nanthamongkolchai, 1999 cited in Choiejit, 2002). Between 1975 and 1980, the net migration to Bangkok was 10.7 thousands comparing to only 7 thousands between 1965 and 1970 (Piampiti, 1985 cited in Choiejit, 2002). The number had increased to 30.4 thousands between 1985 and 1990. The great number of net in-migrants is an important factor contributing to a rapid growth of Bangkok population that reach 6.3 millions in the year 2000.Rapid population growth not only occurred in Bangkok but also take place in five provinces surrounding Bangkok, which are provinces of Nonthaburi, Pathumthani, Samutprakarn, Nakonpathom, and Samutsakorn, and the population growth rate of these surrounding provinces was higher than that for Bangkok. Table 1 Population, Annual Growth Rate in Bangkok and its vicinity in 1960, 1970, 1980,1990 and 2000 Number of population Annual growth rate (%) 1960
1970
1980
1990
2000
BMA
2.1
3.1
4.7
5.9
6.3
Vicinity
1.2
1.4
1.9
2.7
3.8
BMR*
3.3
4.8
6.6
8.6
10.1
1960-
1970-
1980-
1990-
1970
1980
1990
2000
3.89
4.16
2.27
0.66
3.48
3.05
3.51
3.42
3.75
3.18
2.65
1.61
Source: Population and Housing Census, 1960, 1970, 1980, 1990 and Preliminary Report of Population and Housing Census, 2000, National Statistical Office, NSO. Note * BMR = BMA + Vicinity BMA = Bangkok Metropolitan Administration BMR = Bangkok Metropolitan Region Vicinity including provinces of Nonthaburi, Pathumthani, Nakonpathom, and Samutsakorn.
Samutprakarn,
Economic Growth Thailand had experienced the high level of economic growth during 1987 – 1995 with an average economic growth of 10 % per annum. Since 1997 Thailand has been confronted with the economic recession due to economic crisis throughout Asia. During the period of rapid economic growth, prior to the economic crisis had shifted economic structure from agricultural base economy to industrial base economy with increasing complicated products diversification. Bangkok and its vicinity are become a very significant economic center of this country, because of nearly a half of the gross national product (GNP) belonged to them (Table 2). The proportion of GRP had tremendously increased between 1981 and 1990, even though, the proportion was somewhat decreased to 49.1 in 1999, because of the national policy to promote rural development programs and the Eastern Sea Board development projects (Nanthamongkolchai, 1999 cited in Choiejit, 2002). However, the majority of economic and social activities are still located in Bangkok and its vicinity. In addition, table 3 indicates that in 1981 Bangkok was ranked in the first of per capita income of 54,305 Baht which was 9 folds higher than that of the northeastern region with the lowest per capita of 6,142 Baht . But in 1999, the annual per capita income was also highest in Bangkok about 229,000 Baht which was 9 folds higher than that of the lowest of 25,367 Baht for the northeastern region. This means that the gap between the richest and the poorest regions in terms of per capita income was not change at last 20 years.
5 Table 2 Percentage Distribution of Gross Regional Products (GRP) at current market prices in 1981, 1990 and 1999 classified by regions
GRP (Percent) Regions
1981
1990
1999
BMA Vicinity BMR Rest of the country Whole Kingdom
35.8 9.8 45.6 54.4 100.0
39.4 12.8 52.2 47.8 100.0
37.2 12.0 49.1 50.8 100.0
Source : National Economics and Social Development Board, NESDB, 2001
Table 3 Per capita GRP classified by regions in 1981, 1990, 1999
Regions Whole Kingdom Northeastern Northern Southern Central BMA Vicinity BMR
1981 15,934 6,142 10,042 12,401 17,377 54,305 35,544 48,764
Per capita GRP.(Baht) 1990 38,908 13,152 20,401 24,803 42,172 139,642 99,574 127,099
1999 74,675 25,367 37,905 51,284 103,642 228,921 151,927 203,778
Source : NESDB, 2001 Employment structure in Bangkok Employment structure in Bangkok varies greatly across its areas. For inner Bangkok, commercial, financial and service sectors play important roles as major sources of employment. Because of inner Bangkok was occupied by commercial establishments and offices especially financing and banking business as well as government offices. On the other hands, production sector still play important role as a major source of employment in outer Bangkok and its vicinity as well. Employment in middle Bangkok were mixed among production, commercial and service sectors. Because of the extension of the commercial and financial, business and service sectors from the inner to the middle Bangkok. For the outer Bangkok, the major source of employment is production sector, but continue to decline as seen in the inner Bangkok. The proportion of employed workers in production sector dropped sharply during the past 10 years, from 67 % in 1990 to 49 % in 2000 (Table4). Whereas the employment in commercial, business, and other sectors continue to increase their roles in the outer Bangkok, according to the expansion of the city from the city center to the outskirts. For the vicinity of Bangkok, production sector is still be the major source of employment in 2000 accounted for production sector, although this proportion had somewhat decreased from 87 % in 1990 (Table 4). However, such a decrease was less comparing to those of the middle and outer Bangkok.
In terms of labor market, it is found that even the economic structure in terms of production and employment had changed into the industrial society with highly employment
6 in formal sector. Nonetheless, the vast majority of labors in this country still engage in informal sectors. The informal sector offers highly flexible employment of which salary varies by job specification and timing, and mostly belongs to the small scale of businesses and establishments. Table 4 Percentage distribution of employment in Bangkok and its vicinity classified by types of industries and areas Types of Industries Production Commerce Finance Services Others Total Number (Million)
Inner 1990 2000
Middle 1990 2000
Outer 1990 2000
BMA 1990 2000
Vicinity 1990 2000
17.7 34.4 20.3 7.8 19.8 100.0 0.56
39.9 22.3 10.1 9.5 18.3 100.0 0.53
66.7 12.0 3.6 6.7 11.1 100.0 0.50
40.5 23.3 11.6 8.0 16.6 100.0 1.60
86.5 4.1 0.8 2.0 6.7 100.0 0.65
15.9 35.9 23.5 7.0 17.7 100.0 0.82
30.2 28.5 13.1 8.6 19.5 100.0 1.05
48.7 17.9 8.2 6.6 18.5 100.0 1.26
33.9 26.2 13.9 7.4 18.7 100.0 3.13
80.3 6.6 2.4 2.3 8.4 100.0 1.71
Source : Department of Labor Protection and Welfare, 2000 About 59 % of employed workers in Bangkok engaged in the formal sector, while the other 41 % worked in the informal sector. Among the latter group, the majority were nonagricultural workers with only primary level of education. Male labors were more engage in informal sector than female, in production, construction and transportation. While female labors worked more in commercial, service and female base industrial sectors. Therefore, the distribution of workers in labor market of informal sector in Bangkok was likely follow the employment structure in the formal sector. For inner and middle Bangkok where most of employment were for commercial, service and business sectors, informal sector was likely to engage mostly female labors both of low and high qualifications. On the other hands, most of formal sectors in manufacturing sector located in outer Bangkok , then leading to higher demand in male labors, but the majority of female base industries, which is textile industries are located in the outer Bangkok as well. Therefore, the labor market of both of formal and informal sectors consisted of both male and female labors (National Statistical Office, NSO, 1994). Land use patterns and built up areas In Bangkok, the expansion of urban land use is characterized by unplanned, sprawl and ineffectively regulated by local and federal authorities. Such a rapid growth in terms of population and economic activities took place in horizontal manner to the provinces surrounding Bangkok, causing degradation of agricultural areas. Agricultural land was converted to urban uses as Bangkok expanded along three major transport corridors to the southwest, southeast and north of the city. High intensity of land utilization on the edge of both sides of land transport routes making “super-blocks”, or large areas with lower accessibility and the difficulty to be reached and developed for the land inside. This has made such expansion of Bangkok city cover larger area than expected. Besides, it is difficult to provide systematic and interconnected service network, thus the government need to carry much more burden in transportation and public works investment. Moreover, those who live in the outer of Bangkok or its vicinity have to take average longer distance to enter the city and using personal cars are encouraged to save traveling time and make them convenience, due to lack of public transport services. (Suthiranart, 2001; Surasawadi, 2000; Poboon, 1997) The consequences of economic activities, population growth coupled with the increasing use of motor vehicles has dramatically affected Bangkok, particularly in terms of transport crisis in Bangkok. During the last two decades, Bangkok extended rapidly without planning. Population growth and manufacturing establishments have located throughout Bangkok Metropolitan Region, which including 5 provinces surrounding Bangkok.
7 The physical extension of Bangkok expanded from roughly 302 square kilometers in 1987 to nearly 613 square kilometers in 1995 (Department of City Planning, BMA, 1999). This indicates that considerable suburbanization of business and employment has been taking place in the extended regions of Bangkok (Suthiranart, 2001).
Figure 2 Urban Growth in Bangkok Metropolitan Area (1900 – 1990)
Source: JICA (1996) Residences in congested areas Being the center of all developments, Bangkok has attracted those of low income to move in for better life and better job, making the urban growth rapidly. Because housing development for the poor did not meet the demand, many temporary or semi-temporary houses were built untidy on very small and narrow intruded land or hired land, making congested community areas or slums. This create a lot of physical problems such as living arrangement, water release, waste disposal, narrow roads and paths, degraded environment, and other social problems including crime, drugs, gambling, child labor abuse, uneducated, and health problems, all of which are harmful to life, property, health as well as quality of life of the people in these congested areas(Department of City Planning, BMA, 1999). The survey of slums in Bangkok conducted by the BMA in 1994 revealed that there were 1,224 slums in Bangkok consisting of 0.2 million households and approximately 0.3 million families accounting for 1.3 million population. Most of the slums located in the inner and middle area of Bangkok. Congested areas in the inner Bangkok comprises slums in Rattanakosin areas, the early settlement of Bangkok. Rest of slums in the inner Bangkok were mostly located in the CBD of Bangkok where head offices of business/banking/financing/services as well as government offices areas are located.
8 Moreover, there were many slums mostly located near industrial areas and transport nodes such as slums scattering near the Bangkok International Seaport, which called Klong Toei slum, the biggest slum in Bangkok (Department of City Planning,1999) . Slums mostly were located or settled on the vacancy spaces owned by public and private, and some of them lined along both sides of canals. These areas rather be inaccessible and having problems of physically, socially, and economically. Currently, there are various organizations responsible in development of congested area, and most of them focuses on improvement and for better housing environment than removal and rebuild the welfare buildings. Occupational development and promotion was implemented to enhance education opportunity for slum dwellers and expansion of health service for them. Most of slum dwellers have primary level of education, with low skill, then they are worker and street vendors or labor in the informal sector. They have to living near their employment location, to satisfied their traveling and save them in traveling cost (Department of City Planning, BMA, 1999).
Commuting Patterns of the Poor in Bangkok This chapter aims to describe the commuting patterns of the poor who are working age person (13 – 60 years old) and living in the household with income below 10,000 Baht per month. Commuting patterns take place within Bangkok Metropolitan Administration (BMA). Household Traveling Survey compiled by the Department of Traffic and Transportation in 1999 is employed to this study. The total number of commuters who commute to work between their place of residence and workplace location are 48,510. Commuting patterns are divided into three categories, which are direction of commuting, commuting mode and time. Descriptive statistics are employed to this study to investigate the commuting patterns. Direction of Commuting This study categorizes the direction of commuting into three categories, which are commuting within inner of Bangkok, within outer of Bangkok and commuting among zones of Bangkok or cross commuting. Table 5 shows that female commuter who living in the poor household are more likely to commute to work within the outer of Bangkok than male, but they have lower percentage to commute by cross commuting than men. Interestingly, as household income increase, female commuter are more likely to commute to work by cross commuting and commute within the inner of Bangkok than male. Younger commuter are more likely to commute within the outer of Bangkok than older commuter, and less likely to commute within the inner of Bangkok. However, commuter aged 25-44 years old are more likely to commute to work by cross commuting than those with younger and older commuters. As household income increase, the percentage of commuting within the inner of Bangkok decline in all age groups of commuters.On the other hands, as household income increase, the percentage of cross commuting also increase in all age groups of commuters. Only the poor household type, commuter who completed in primary education are more likely to commute within the outer and inner of Bangkok than those who completed in higher levels of education, but primary educated commuter are less likely to commute to work by cross commuting than commuter with higher levels of education. As household income increase, the percentage of cross commuting also rise in all levels of education, but the percentage of commuting within the inner of Bangkok decline in all levels of education as well. In addition, percentage of cross commuting increase as number of personal car in the household increase in all household types, but the percentage of commuting within the inner of Bangkok for the poor household decline as number of personal car in household increase.
9
Table 5 Percentage distribution of direction of commuting classified by household income types and selected variables Variables
Percent (number)
Direction of commuting
Sex
Within Inner
Within Outer
Cross- commuting
Male
25.0
38.1
36.9
100.0 (4111)
Female
24.8
39.9
35.4
100.0 (2032)
Total
24.9
38.7
36.4
100.0 (6143)
Male
20.4
38.2
41.4
100.0 (15584)
Female
22.0
37.4
40.6
100.0 (11411)
Total
21.1
37.8
41.1
100.0 (26995)
Male
15.3
38.0
46.7
100.0 (8059)
Female
16.4
35.8
47.8
100.0 (7313)
Total
15.8
37.0
47.2
100.0 (15372)
Within Inner
Within Outer
Cross- commuting
13 – 24
21.5
43.1
35.5
100.0 (1277)
25 – 44
25.5
37.3
37.2
100.0 (4227)
45 – 60
27.9
39.4
32.7
100.0 (639)
Total
24.9
38.7
36.4
100.0 (6143)
13 – 24
19.9
39.8
40.3
100.0 (4149)
25 – 44
20.5
37.8
41.7
100.0 (18487)
45 – 60
24.4
36.4
39.2
100.0 (4359)
Total
21.1
37.8
41.1
100.0 (26995)
13 – 24
18.1
37.6
44.3
100.0 (1613)
25 – 44
15.3
36.6
48.2
100.0 (9815)
45 – 60
16.3
37.7
46.0
100.0 (3944)
Total
15.8
37.0
47.2
100.0 (15372)
Household Income Types Poor
Middle
Rich
Age Groups Poor
Middle
Rich
Percent (number)
10 Table 5 continue.
Percent (number)
Household
Variables
Income Types
Education
Within Inner
Within Outer
Cross- commuting
Poor
Middle
Rich
Primary
29.4
42.7
28.0
100.0 (1643)
Secondary
25.0
39.2
35.8
100.0 (2754)
University
20.6
34.2
45.1
100.0 (1755)
Total
24.9
38.7
36.4
100.0 (6143)
Primary
28.4
39.6
32.0
100.0 (4011)
Secondary
22.4
38.7
38.9
100.0 (10366)
University
17.6
36.6
45.8
100.0 (12618)
Total
21.1
37.8
41.1
100.0 (26995)
Primary
17.3
44.0
38.6
100.0 (911)
Secondary
17.4
39.6
43.0
100.0 (3166)
University
15.2
35.7
49.1
100.0 (11295)
Total
15.8
37.0
47.2
100.0 (15372)
Within Inner
Within Outer
Cross- commuting
Non-car family
26.0
38.7
35.3
100.0 (5498)
One-car family
15.6
40.0
44.4
100.0 (570)
Multi-car family
17.3
30.7
52.0
100.0 (75)
Total
24.9
38.7
36.4
100.0 (6143)
Non-car family
22.4
37.9
39.7
100.0 (18914)
One-car family
18.4
37.7
44.0
100.0 (6950)
Multi-car family
14.6
38.4
47.0
100.0 (1131)
Total
21.1
37.8
41.1
100.0 (26995)
Non-car family
18.4
36.8
44.8
100.0 (4423)
One-car family
15.6
37.0
47.4
100.0 (6101)
Multi-car family
13.7
37.0
49.2
100.0 (4848)
Total
15.8
37.0
47.2
100.0 (15372)
Number of personal car Poor
Middle
Rich
Direction of commuting
Percent (number)
The different of employment structures in Bangkok effects the direction of commuting and also effects the demand for labor differently. The inner of Bangkok have very high concentration of head offices in the business, financial and service sectors and also high intensity of government activities. Therefore, most of job are require female, both high and low qualifications to serve the economics and social activities in both formal and informal sectors. While the outer of Bangkok have very high concentration of productions and female base industries that prefer to low qualifications and young worker of both male and female, but demand for low skill female workers slightly higher than male (Choiejit, 2002; Punpuing, 1996; National Statistical Office: NSO, 1994). In addition, young workers normally have a low skill and earn less, then they are more likely to commute shorter than older workers, because of they could not afford the transportation cost, therefore they tend to work near their residential areas. High levels of neighborhood satisfaction and family tie of older worker make them commute longer than younger worker (Artis et al.,2000; Punpuing, 1996).
11 Commuting Mode This sub-section is intended to describe how the commuters selected mode of transport to travel to their work trips within BMA. Private vehicle, public transport and nonmotorized mode are dependent variable employed to this sub-section. Private vehicles are personal car or motorcycle, taxi, hired motorcycle, motor tricycle-taxi (Tuk- Tuk) or other types of hired vehicles. Public transport are all kinds of buses operated by public and private. Non-motorized mode means all kinds of transport means without engine such as walking, or bicycling. Table 6 shows that female who living in the poor household are more likely to commute by public transport and non-motorized mode and less likely to commute by private vehicle than men. As household income increase, the percentage of men and women commute by public transport and non-motorized mode decrease. While percentage of private vehicle use increase rapidly for both sex of commuters.Older commuter who living in the poor household, are more likely to commute by non-motorized mode than younger commuter. In the poor household, adult commuter aged 25 – 44 years old are more likely to commute by private vehicle and less likely to commute by public transport and non-motorized mode than younger and older commuters. As household income increase, the percentage of commuting by non-motorized mode decline in all age groups.Only older commuters have a declining percentage of commuting by public transport as household income increase. Moreover, table 6 also shows that private vehicle use sill rise in all age groups of commuters as household income increase. Commuters who completed primary level of education and living in the poor household are more likely to commute by non-motorized mode and less likely to travel to their workplace by private vehicle than commuter with higher levels of education. As household income increase, the percentage of commuting by non-motorized mode decrease, on the other hands, percentage of commuting by private vehicle still rise rapidly as household income increase.Local commuter who commute within their district of residence or commute between their residential district and the neighboring areas, are more likely to travel by nonmotorized mode than non-local commuter who prefer to commute by private vehicle and public transport, respectively. Percentage of using non-motorized by local commuter are decline as household income increase, contrary to the percentage of commuting by private vehicle always rise as household income increase. However, both of local and non-local commuters who living in the rich household income type, have the lowest percentage of using public transport compared to those living in the poor and middle household income types, respectively. This imply that public transport is very significant mode of transport for the middle and poor income persons, but less attractive for the rich people. Commuters who living in family with more than one personal car, are more likely to commute by private vehicle and less likely to commute by public transport . On the other hands, commuter who living in family without personal car are heavily rely on public transport to serve their transport needs. As household income increase, the percentage of commuting by private vehicle and public transport also increase, exceptional for the rich commuters who less attractive to commute by public transport. Moreover, the percentage of commuting by non-motorized mode decline as household income increase. Several studies indicate that most of men have higher income than women and normally have a first priority to access to the advance transport. Furthermore, there is a negative relationship between age and use of public transport, the majority of the older people could afford private vehicle to support their family travel needs, then they less attractive to using public transport. (Punpuing, 1996; Polk, 1996; Astrop, 1996; Burns, 1996).
12 Table 6 Percentage distribution of commuting mode classified by household income types and selected variables Household
Variables
Income Types
Sex
Private
Public
Non-motorized
Poor
Male
61.1
24.3
14.7
100.0 (4111)
Female
18.8
58.2
23.1
100.0 (2032)
Total
47.1
35.5
17.5
100.0 (6143)
Male
66.3
24.5
9.2
100.0 (15584)
Middle
Female
31.4
55.1
13.5
100.0 (11411)
Total
51.6
37.4
11.0
100.0 (26995)
Male
78.0
17.0
5.0
100.0 (8059)
Rich
Female
53.4
39.9
6.7
100.0 (7313)
Total
66.3
27.9
5.8
100.0 (15372)
Private
Public
Non-motorized
13 – 24
34.8
46.0
19.3
100.0 (1277)
25 – 44
51.9
32.2
15.9
100.0 (4227)
45 - 60
39.6
36.2
24.3
100.0 (639)
Total
47.1
35.5
17.5
100.0 (6143)
13 – 24
40.9
46.3
12.9
100.0 (4149)
25 – 44
53.4
36.6
10.1
100.0 (18487)
45 - 60
54.2
32.6
13.2
100.0 (4359)
Total
51.6
37.4
11.0
100.0 (26995)
13 – 24
49.4
42.6
8.0
100.0 (1613)
25 – 44
66.5
28.5
5.0
100.0 (9815)
Age groups Poor
Middle
Rich
Middle
Rich
Percent (number)
45 - 60
72.6
20.4
7.0
100.0 (3944)
Total
66.3
27.9
5.8
100.0 (15372)
Private
Public
Non-motorized
Primary
39.5
32.3
28.3
100.0 (1643)
Secondary
55.4
29.2
15.4
100.0 (2754)
University
41.0
48.4
10.7
100.0 (1755)
Education Poor
Percent (number)
Commuting Mode
Percent (number)
Total
47.1
35.5
17.5
100.0 (6143)
Primary
42.5
34.4
23.1
100.0 (4011)
Secondary
53.3
34.1
12.6
100.0 (10366)
University
53.0
41.1
5.9
100.0 (12618)
Total
51.6
37.4
11.0
100.0 (26995)
Primary
57.6
26.6
15.8
100.0 (911)
Secondary
63.2
28.0
8.7
100.0 (3166)
University
67.8
28.0
4.2
100.0 (11295)
Total
66.3
27.9
5.8
100.0 (15372)
13 Table 6 continued. Household
Variables
Income Types
Distance
Private
Public
Non-motorized
Poor
Local
43.2
24.3
32.5
100.0 (3038)
Non-local
50.8
46.4
2.7
100.0 (3105)
Total
47.1
35.5
17.5
100.0 (6143)
Local
47.5
28.1
24.4
100.0 (10945)
Non-local
54.3
43.8
1.9
100.0 (16050)
Total
51.6
37.4
11.0
100.0 (26995)
Local
62.2
20.6
17.2
100.0 (4156)
Non-local
67.8
30.6
1.6
100.0 (11216)
Total
66.3
27.9
5.8
100.0 (15372)
Private
Public
Non-motorized
Non-car family
44.3
37.3
18.4
100.0 (5498)
One-car family
69.3
20.2
10.5
100.0 (570)
Multi-car family
77.3
18.7
4.0
100.0 (75)
Total
47.1
35.5
17.5
100.0 (6143)
Non-car family
43.4
43.6
13.0
100.0 (18914)
One-car family
68.9
24.3
6.7
100.0 (6950)
Multi-car family
81.0
14.9
4.1
100.0 (1131)
Total
51.6
37.4
11.0
100.0 (26995)
Non-car family
46.7
44.2
9.1
100.0 (4423)
One-car family
66.5
28.1
5.3
100.0 (6101)
Multi-car family
83.8
12.7
3.5
100.0 (4848)
Total
66.3
27.9
5.8
100.0 (15372)
Private
Public
Non-motorized
Within inner city
45.0
26.0
29.0
100.0 (1531)
Within outer city
45.0
31.9
23.1
100.0 (2378)
Cross commuting
50.6
45.8
3.5
100.0 (2234)
Total
47.1
35.5
17.5
100.0 (6143)
Within inner city
47.0
32.0
21.0
100.0 (5686)
Within outer city
52.3
32.8
14.9
100.0 (10215)
Cross commuting
53.2
44.5
2.3
100.0 (11094)
Total
51.6
37.4
11.0
100.0 (26995)
Within inner city
59.6
27.0
13.4
100.0 (2314)
Within outer city
68.1
23.8
8.0
100.0 (5682)
Cross commuting
67.0
31.4
1.6
100.0 (7259)
Total
66.3
27.9
5.8
100.0 (15372)
Middle
Rich
Number of personal car Poor
Middle
Rich
Direction of commuting Poor
Middle
Rich
Percent (number)
Commuting Mode
Percent (number)
Percent (number)
In addition, younger worker mostly could not afford the private vehicle, then they have to commute by public transport or use of non-motorized mode. Moreover, when people are become the elderly person, they have to stop driving due to their physical limitation, most of them travel less and commute frequently within their neighborhood and prefer to commute by non-motorized mode (Choiejit and Teungfung, 2004; Choiejit, 2002, Polk, 1996, Punpuing, 1996).
14 In terms of education, several studies also shows that there is a positive relationship between levels of education and income, and its effects to the mode of transport. People with a better paid job associated with high levels of education, they have a greater transport demand than those with lower paid job, who mostly completed in lower levels of education . High status commuter in terms of levels of education, occupation, household income, could afford the private vehicle, then create a higher rate of car ownership. Therefore, they are more likely to commute by private vehicle than use of public transport and non-motorized mode (Choiejit and Teungfung, 2004; Choiejit, 2002; Shefali, 2000; Peng 1997; Punpuing, 1996; Astrop, 1996). Commuting Time This sub-section aims to explore the time spend by commuter who traveling to work between place of residence and workplace location for round trips. Table 7 indicates, Female have longer commuting time than male in general and all kind of transport mode, exceptional for using of public transport, men have longer commuting time than women. As household income increase, time spend by both sex of commuter also rise in all mode of transports. Younger commuter aged 13- 24 years old have longer commuting time to traveling by nonmotorized mode than commuter who aged 25 – 60 years old. On the other hands, younger commuter have lower commuting time by use of private vehicle and public transport than commuter who aged 25 – 60 years old. As household income increase, commuting time in all mode of transport also increase. Commuter who completed primary education have lower commuting time than those with higher levels of education to commute by private vehicle and public transport, on the other hands, commuter with primary education have longer commuting time by use of non-motorized mode than those with higher levels of education. Only commuter who completed primary level of education and traveling by non-motorized mode spend their commuting time decrease as household income increase. Normally, local commuter have shorter commuting time than non-local commuter, as household income increase, commuting time also increase in all mode of transport uses, exceptional for using of non-motorized mode. The commuting time spend by local commuter decline as household income increase. Commuter who living in the household without personal car have shorter commuting time by use of private vehicle and public transport than those living in the household with high number of personal car. As household income increase, the commuting time also rise in all kinds of transport uses. In terms of commuting direction, cross-commuting normally have the longest commuting time following by commuting within the outer and inner of Bangkok, respectively. As household income increase, the commuting time still rise in all directions of traveling.The results of this study are corresponding with several previous studies. Rosenbloom (1996) and Sarmiento (1996) found that working married women with children have longer commuting time than working married men, because of these women are more likely than men to pick up their children to or from school and they have to more trips relate to household responsibility. In Thai society, there is not a strong and pervasive difference in the wage rate between men and women in the same job, then women have freedom to get their job in longer distance from their place of residence. However, Thai women traditionally devoted themselves to serve to their household responsibility (Punpuing, 1996). In addition, older commuter are more likely to commute longer than younger commuter, because they have a strong family tie and high levels of neighborhood satisfaction. On the other hands, the young commuters mostly have a low family tie and they prefer to change their place of residence to close their workplace rather than daily commuting, therefore they commute in short distance compared to the older person.
15 Table 7 Mean of commuting time classified by mode of transport, household income types and selected variables Household
Variables
Income Types
Sex
Private
Public
Non-motorized
Poor
Male
64.38
115.53
26.41
71.23
Female
66.38
112.28
30.87
84.88
Total
64.64
113.77
28.36
75.74
Male
79.07
120.98
28.81
84.71
Female
79.73
114.49
31.17
92.33
Total
79.24
116.94
30.03
87.93
Male
99.89
136.78
33.90
102.86
Female
103.62
134.02
39.99
111.48
Total
101.32
134.90
37.24
106.96
Private
Public
Non-motorized
13 – 24
58.98
111.97
29.75
77.71
25 – 44
65.27
113.64
27.89
74.92
Middle
Rich
Age groups Poor
Middle
Rich
Middle
Rich
Total
Total
45 - 60
69.15
119.09
28.19
77.27
Total
64.64
113.77
28.36
75.74
13 – 24
67.04
112.57
30.75
83.43
25 – 44
79.98
116.12
28.98
88.06
45 - 60
84.90
126.72
32.75
91.67
Total
79.24
116.94
30.03
87.93
13 – 24
88.02
133.40
38.70
103.40
25 – 44
102.20
136.71
38.16
108.85
45 - 60
103.02
129.90
34.96
103.70
Total
101.32
134.90
37.24
106.96
Private
Public
Non-motorized
Primary
57.42
107.57
29.82
65.79
Secondary
62.42
108.57
27.23
70.49
Education Poor
Mean of commuting time by mode (minutes)
Total
University
75.84
122.54
27.32
93.26
Total
64.64
113.77
28.36
75.74
Primary
68.86
111.02
30.13
74.41
Secondary
69.60
110.67
28.43
78.43
University
89.86
122.79
32.70
100.03
Total
79.24
116.94
30.03
87.93
Primary
78.69
124.93
28.81
83.09
Secondary
85.18
125.76
31.05
91.81
University
107.09
138.23
43.42
113.13
Total
101.32
134.90
37.24
106.96
16 Table 7 continued. Household
Variables
Income Types
Distance
Private
Public
Non-motorized
Poor
Local
39.42
71.50
26.59
43.05
Non-local
85.63
135.40
48.87
107.74
Total
64.64
113.77
28.36
75.74
Local
45.60
72.36
26.51
48.47
Non-local
99.31
136.47
60.71
114.84
Total
79.24
116.94
30.03
87.93
Local
55.86
80.46
25.85
55.78
Non-local
116.77
148.52
82.17
125.92
Total
101.32
134.90
37.24
106.96
Number of personal car
Private
Public
Non-motorized
59.90
113.05
28.74
Middle
Rich
Poor
Non-car family
Mean of commuting time by mode (minutes) Total
Total 74.00
One-car family
85.53
125.39
21.88
86.87
Multi-car family
122.05
123.93
30.00
118.72
Total
64.64
113.77
28.36
75.74
Non-car family
67.54
115.24
30.15
83.46
One-car family
94.84
123.11
28.29
97.26
Multi-car family
102.53
137.93
41.09
105.32
Total
79.24
116.94
30.03
87.93
Non-car family
80.69
130.43
34.81
98.54
One-car family
103.97
137.25
39.27
109.90
Multi-car family
109.15
142.591
39.09
110.93
Total
101.32
134.90
37.24
106.96
Direction of commuting
Private
Public
Non-motorized
Within inner city
47.66
94.48
27.92
54.11
Within outer city
56.99
97.96
26.41
62.99
Cross commuting
82.24
132.96
44.38
104.15
Total
64.64
113.77
28.36
75.74
Within inner city
59.88
97.48
27.63
65.16
Within outer city
68.87
106.85
28.47
75.29
Cross commuting
97.41
130.96
50.27
111.24
Total
79.24
116.94
30.03
87.93
Within inner city
83.03
118.36
30.47
85.54
Within outer city
90.64
125.13
30.72
94.05
Cross commuting
115.27
145.48
82.61
124.24
Total
101.32
134.90
37.24
106.96
Middle
Rich
Poor
Middle
Rich
Total
17 Moreover, there are the interrelationship among levels of education, occupation, income and commuting time. Higher educated commuter earn more than lower educated commuter, then they have better opportunities and many choices, how to serve their life styles perfectly. This let higher educated persons engage very high in economics and social activities and create transport demand highly. Because of higher educated persons could afford more materials to response their high levels of satisfaction. They traveled more in terms of trips making. Therefore, higher educated commuter have longer commuting time than lower educated commuter. Increasing number of personal car in household lead to the increasing of commuting time, because there is a strong positive relationship among household income, levels of car ownership and trip making. Higher income household could afford high number of personal and create a greater demand of trip making, which resulting in spending more time on commuting (Choiejit and Teungfung, 2004; Choiejit, 2002; Lu and Pas, 1999; Cervero, 1996; Punpuing, 1996).
Conclusion This paper aims to describe causes of urban growth in Bangkok, a capital city of Thailand and to explore the commuting patterns particularly the poor. The results of the first chapter indicate that policy to bring Thai economy to attach the global economy in the past centuries had changed dramatically in terms of human settlement and transportation systems in city of Bangkok and country as a whole. In this meantime, population growth, both in terms of natural increase and a large number of net in-migrants coupled with rapid economic growth prior the economic crisis in Thailand, have shift economic structure from agricultural to industrial economy with highly diversification of good and services. This lead Bangkok and its vicinity become a center of social and economic activities. Ineffective land use policy and regulations of federal and local authorities coupled with promoting of roadways transport and private vehicle use, expanded Bangkok urban area rapidly in the last of three decades. Negative effects of rapid growth of Bangkok are identified such as traffic congestion, degradation of agricultural lands, ineffective on public works utilization and etc. Comprehensive land use policy and practices are needed to investigate and implement to cope with many problems regarding an inappropriate growth of Bangkok. The results of the second chapter, the commuting patterns of the poor in Bangkok, reveals commuting patterns are different among commuter’s demographic and household characteristics. Majority of commuters commute to work within their residential districts, particularly commuting within outer of Bangkok. Poor and low status commuters in terms of levels of education and affordability mostly rely on public transport services and use of non-motorized mode rather than commuting by personal car. A large number of cross commuting, indicates that rapid urban growth push people out to living in the outskirt of Bangkok and commute longer distance and time and also encourage them to use private vehicle, particularly high status commuters. Mass rapid transport is needed to construct and create the effective transportation network throughout the city of Bangkok and extended to its vicinity. This lead to the reduction of private vehicle use and promotion the use of public transport and non-motorized mode.
18 References Aritome, Junko, (1997). Gender characteristics of commuting patterns: a case study of the Osaka Metropolitan Area. Jimbun – Chiri (Human Geography) 49 (1) : 47- 63. Artis, Manuel et al., (2000). Determinants of individual commuting in Catalonia 1986 – 1991: Theory and empirical evidence. Urban Studies 37 ( 8) : 1461 – 1450. Astrop, Angela, (1996). The urban travel behavior and constraints of low income household and females in Pune, India. Women’s travel issues. Proceedings from the second national conference. Department of transport federal highway administration. Burns, Elizabeth K.,(1996). Women’s travel to inner city employment. Women’s travel issues. Proceedings from the second national conference. Department of transport federal highway administration. Cervero, Robert and Griesnbeck. B., (1988). Factors influencing commuting choices in suburban labor market: a case analysis of Pleasanton, California. Transport Research Record.22a (3) : 151- 161. Cervero, Robert., (1996). Mixed land-uses and commuting : Evidence from the American Housing survey. Transport Research Record 30 (5): 361 – 377. Choiejit, Ratchapan. and Teungfung, Ratiporn., (2004). The effects of employment density on commuting mode in Bangkok. Transportmetrica: Advance methods for transportation studies. Proceedings in the 9 th Conference of Hong Kong Society for transportation studies. Hong Kong. Choiejit, Ratchapan., (2002). The relationships between population density and commuting patterns in Bangkok. Doctoral dissertation in Demography, Mahidol University, Nakhon Pathom. Thailand. Department of Labor Protection and Social Welfare, (2000). Labor statistical. The Ministry of Labor and Social Welfare, Bangkok. Thailand. Department of City Planning, Bangkok Metropolitan Administration, (1999). Bangkok’s city planning (fist revised). Bangkok. Thailand. Japan International Cooperative Agency (JICA).,(1990). The study on medium to long term improvement and management plan of road and road transport in Bangkok in the Kingdom of Thailand. Final report, Bangkok. Thailand. Japan International Cooperative Agency (JICA)., (1996). The study on Urban environment improvement program in Bangkok Metropolitan Area. Bangkok. Thailand. Lu, Xuedong and Pas. Eric I.,(1999). Socio-demographics, activity participation and travel behavior. Transport Research Records, Part A., 33 : 1 – 18. National Economic and Social Development Board, (2001) The 1999 gross regional and gross provincial products. Bangkok: Office of the Prime Minister, National Economic and Social Development Board. National Statistical Office, (1994). Formal and informal labor force market: 1994 labor force survey. Bangkok: Office of the Prime Minister, National Statistical Office. Peng, Zhong-Ren.,(1997). The job-housing balance and urban commuting. Urban studies.34 (8): 1215-1235.
19 Poboon, Chamlong.,(1997). Anatomy of a traffic disaster : Toward a sustainable solution to Bangkok’s transport problems. Doctoral dissertation, Murdoch University, Australia.
Polk, Merritt., (1996). Swedish men and women ‘s mobility patterns :Issues of social equity and ecological sustainability. Women’s travel Issues. Proceedings from the second national conference. Department of transport federal highway administration. Punpuing, Sureeporn.,(1996). Commuting behavior patterns in Bangkok. Doctoral dissertation in Resource and Environment Studies, Australian National University.Canberra. Rosenbloom, Sandra, (1996). Trends in women’s travel patterns. Women’s travel issues. Proceedings from the second national conference. Department of Transportation Federal Highway Administration. Ruengsilp, Chai, (1984). History of Thailand economy. Bangkok. Shefli, Mashuda Khatum, (2000). Study on gender dimension in Dhaka Urban Transport Project : http// www.worldbank.org/ gender/ transport/ Grants_Pilots/ BANGLADESH1_G_P/ urbantransport.pdf Sarmiento, Sharon, (1996). Household, gender, and travel. Women’s travel issues. Proceedings from the second national conference. Department of Transportation Federal Highway Administration. Suraswadee, Kamloprak, (2000). Traffic solution in Bangkok and vicinity. A study and research for city planning policy, Bangkok. Suthiranart, Yoaurai., (2001). The transport crisis in Bangkok: An exploratory evaluation. Doctoral dissertation in Philosophy, University of Washington. USA. Wachs, Martin et al., (1993). ‘The changing commute : a case-study of the jobs-housing relationship over time’. Urban studies, 30(10) : 1711-1729.