UNESCO
INSTITUTE for
STATISTICS
Estimating the Number of
Out-of-School Children Methodological Problems and Alternative Approaches
India case study
UNESCO Institute for Statistics (UIS) The UNESCO Institute for Statistics (UIS) is the statistical office of UNESCO and is the UN depository for global statistics in the fields of education, science and technology, culture and communication. The UIS was established in 1999. It was created to improve UNESCO's statistical programme and to develop and deliver timely, accurate and policy-relevant statistics needed in today’s increasingly complex and rapidly changing social, political and economic environments. UIS is based in Montreal, Canada. United Nations Children’s Fund (UNICEF) UNICEF promotes the rights and well-being of every child. Together with its partners UNICEF works in 190 countries and territories to translate that commitment into practical action, focusing specifically on reaching the most vulnerable and excluded children, to the benefit of all children, everywhere. UNICEF provides policy and programming expertise on the ground for the Out-of-School Children Initiative. It is involved in advancing education in countries around the world and is a global leader in advocating for equity in education and improvements in learning outcomes. Among its contributions is serving as the secretariat for the United Nations Girls’ Education Initiative (UNGEI). UNICEF is also on the forefront of promoting inclusion of Education for All goals in the post-2015 development agenda. Published in 2016 by: UNESCO Institute for Statistics P.O. Box 6128, Succursale Centre-Ville Montreal, Quebec H3C 3J7 Canada Tel: +1 514 343 6880 Email:
[email protected] http://www.uis.unesco.org ©UNESCO-UIS 2016 ISBN: 978-92-9189-195-5 Ref: UIS/2016/ED/TD/8 Cover design: Rekha Beri Design & printing: Colorcom Advertising Photo credits: M Faetanini; P Arora; M Mousatakaly; Steve Evans/Wikicommons; Al Jazeera English/ Wikicommons; Johan Bichel Lindegaard/Wikicommons; Kai Karthic/Wikicommons; Nithil Dennis. This publication is available in Open Access under the Attribution-ShareAlike 3.0 IGO (CC-BY-SA 3.0 IGO) license (http://creativecommons.org/ licenses/by-sa/3.0/igo/). By using the content of this publication, the users accept to be bound by the terms of use of the UNESCO Open Access Repository (http://www.unesco.org/open-access/terms-use-ccbysa-en). The designations employed and the presentation of material throughout this publication do not imply the expression of any opinion whatsoever on the part of UNESCO concerning the legal status of any country, territory, city or area or of its authorities or concerning the delimitation of its frontiers or boundaries. The ideas and opinions expressed in this publication are those of the authors; they are not necessarily those of UNESCO and do not commit the Organization
Estimating the Number of
Out-of-School Children Methodological Problems and Alternative Approaches India case study
UNESCO
INSTITUTE for
STATISTICS
Estimating the Number of Out-of-School Children
Acknowledgements This technical paper was commissioned by the UNESCO Institute for Statistics (UIS) and prepared by Ms Anuradha De and Mr Chander Shekhar Mehra of Collaborative Research and Dissemination (CORD), India. The authors wish to thank to Ms Swati Chakraborty (CORD) for her support and Mr Shailendra Sigdel and Mr Friedrich Huebler (UIS) for their valuable comments and guidance. Gratitude for their inputs is extended to Ms Leotes Helin, Mr Frank van Cappelle, Mr Ivan Coursac and Mr Ramachandra Rao Begur (UNICEF).
2
Indian case study
Executive Summary
T
his paper is a follow-up of the India Report on Out-of-School Children (United Nations Children’s Fund and the UNESCO Institute for Statistics, August 2014). The India Report was useful especially because it highlighted data quality and data contradictions among existing data sources on education. This paper used the same framework to examine several sources of education data from 2005, and the proportion of children in the 6 to 13-years age group who were out-of-school. It was seen that there were wide variations in the estimates. The 2011 Census survey data showed an out-of-school figure of nearly 20 per cent for children in this age group, while the Social and Rural Research Institute- India Market Research Bureau (SRI-IMRB) 2014 survey data arrived at a figure of around 3 per cent. Other data sources, including the National Sample Survey Organization (NSSO) 2014 survey and the Unified District Information System for Education (U-DISE) 2014 database, showed the rates for out-of-school children between 8 and 10 per cent. Such wide variations lead to differences in the profiles of the children who are identified as being outof-school; this has major policy implications. Hence, this study examined these differences in data in detail and discusses the ways in which data quality can be improved. To begin with, different data sources have underlying differences in the definitions of ‘attendance rates’ and ‘out-of-school children’, data collection processes and estimation methodologies. These differences are aggravated by inter-state differences in the schooling system in India – school structure, school management, school calendar and age-grade norms are determined independently for each state. These differences together explain many of the variations in the estimates. More recent datasets were used to estimate the number and proportion of out-of-school children and for studying variations which arise from differences in the definitions and methodologies used by the different data sources. In our study the number of out-of-school children was estimated using Census 2011 data. As the Census survey was conducted in early 2011, it is likely that a high proportion of 6- year-old children were 5 years old in several states where the school year begins in April, May or June.1 So the age of the children was reduced by one year to arrive at an alternate estimate of out-ofschool children. The number of out-of-school children estimated after adjusting for this age difference showed a sharp decline. The number and proportion of out-of-school children was also estimated from NSSO and U-DISE data for 2014. Alternate estimates were calculated on the basis of the United Nations Population Division (UNPD) and the Ministry of Human Development’s (MHRD’s) population projections. While the number of out-of-school children between 6 and 13 years calculated using the U-DISE 2014 data was lower than that calculated from the NSSO data by around 1.5 to 3 million, the difference was much higher among children aged 6 to 10 years. In contrast, the estimated number of out-of-school children aged 11 to 13 years was higher according to U-DISE data. 1
In India the school session is not common to all states (See Annex I for details).
3
Estimating the Number of Out-of-School Children
A similar estimation was done using NSSO 2007-08 data to examine the changes between 2007-08 and 2014 in the number and proportion of out-of-school children. It was seen that while the number of out-of-school children declined sharply in the 11 to 13 years age group, the decline was quite low in the 6 to 10 years age group. On disaggregating the number of out-of-school children by their exposure to schooling, it was seen that the proportion of children in pre-primary classes (who are considered to be out-of-school) had increased sharply. This paper finally debates on the most appropriate data source that can be used for estimating outof-school children and ways in which the quality of data and estimates can be improved. U-DISE has an obvious advantage as it is collected systematically every year and the data is maintained on its website within a short time period. NSSO collects detailed data on education once or twice in a decade, but it conducts large household surveys every year and collects information on socioeconomic and educational backgrounds of the population and an only education focused survey is conducted every 5-7 years. Since unit-level data is easily available at a nominal cost, it is best suited for providing an alternate estimate of out-of-school children and for developing their profiles. However, both datasets need to have improved tools with clear definitions and reduced respondent biases. In a large developing country like India estimates based on the assumption that the school structure and age of admission in schools are the same in all the states is unrealistic. The best way forward would be to revise the definition of out-of-school children to match state schooling rules and making estimates at state levels. There is also a need to consider whether the definition of out-of-school children should be revised and children in the primary school age who are attending pre-primary grades should be considered ‘in-school’ rather than ‘out-of-school’. Their admissions in primary schools are likely to be delayed, but they are already studying in formal schools. The definition of out-of-school children should be based on regularity of attendance. There are various reasons why a child does not attend school for an extended period including the fact that she has discontinued schooling, has taken admission in another school, has migrated, or is absent due to reasons like illness, family crisis, seasonal work or even festivals or family functions. The rules under the Right to Education Act (RTE Act) use a reference period of 45 working days at any time after the beginning of a school year to identify out-of-school children. If a child does not attend school even for a day in this reference period she is identified as an out-of-school child. A similar uniform definition can be adopted for all data sources. Teachers can find out the reasons for absenteeism, and remove the names of those who have discontinued studies or moved to another school from their registers.
4
Indian case study
Among the steps that can be taken to improve data quality are: Clear definitions of schools, relevant age-group and attendance. Data on children up to 18 years should be collected so that information on over-age and under-age students is included. The age data should be verified. Household surveys should have appropriate sampling and estimation methods. Administrative data sources should ensure collection of data from all schools. Care needs to be taken that no child is double counted in this process. Enumerators should be trained properly and made aware of possible reasons of over- and under-reporting of enrolments. A well-developed data verification system should be used. Enumerators should be provided training to identify children with special needs. Multiple strategies should be introduced to identify out-ofschool children among vulnerable population groups.
5
Estimating the Number of Out-of-School Children
6
Indian case study
Contents List of Abbreviations
8
1. Introduction
10
2.
A feast of data
13
2.1
14
2.2 Household Surveys
Administrative data sources
15
3. Confusing stories
19
3.1 Administrative data
20
3.2 Household survey data
23
4.
A look beneath the surface
27
4.1 Definitions Used
28
4.2 Data Collection process and methodology of estimation
34
5.
Estimating the Numbers and the Proportions of Children Out-of-School
41
6. Towards more accurate estimation methods
53
56
6.1
6.2
Identifying data sources for estimating out-of-school children
Need to revise definitions in the context of a large developing 57 country like India
7. Annexures
61
Annex 1: Education structure in different states in India
62
Annex 2: Minimum admission age at class 1 in different states in India 62
Annex 3: School session in different states in India
63
Bibliography 64
7
Estimating the Number of Out-of-School Children
List of Abbreviations ASER AER AAR AIE CMF CRC CTS DDA DISE DPEP EFA EGS EdCIL EVS GAR GER IHDS IIPS IMRB InSCED ISCED JRM MOHFW MHRD NAR NCAER NCERT NER NFHS NIEPA NUEPA NSSO OOSC RGI RMSA RTE SES SEMIS SSA SSE SRI U-DISE UIS UNICEF UNPD UNESCO VER
8
Annual Status of Education Report Age-specific Enrolment Rate Age-specific Attendance Rate Alternative and Innovative Education Conceptual and Methodological Framework Cluster Resource Centre Child Tracking Surveys Delhi Development Authority District Information System for Education District Primary Education Programme Education for All Education Guarantee Scheme Educational Consultants India limited Environmental Science Gross Attendance Ratio Gross Enrolment Ratio India Human Development Survey International Institute for Population Studies India Market Research Bureau Indian Standard Classification of Education International Standard Classification of Education Joint Review Mission Ministry of Health and Family Welfare Ministry of Human Resource Development Net Attendance Rate National Council of Applied Economic Research National Council of Education, Research and Training Net Enrolment Rate National Family Health Survey National Institute of Educational Planning and Administration National University of Educational Planning and Administration National Sample Survey Organisation Out-of-schoolchild(ren) Registrar General of India (Census Office) Rashtriya Madhyamik Shiksha Abhiyan (National Campaign on Secondary Education) Right of Children to Free and Compulsory Education Act Selected Educational Statistics Secondary Education Management Information System Sarva Shiksha Abhiyan (Education for All Campaign) Statistics of School Education Social and Rural Research Institute Unified District Information System for Education UNESCO Institute for Statistics United Nations Children’s Fund United Nations Population Division United Nations Educational, Scientific and Cultural Organization Village Education Registers
Indian case study
List of Tables & Figures List of Tables Table 1: GER of children in elementary education (2000-01 to 2011-12) Table 2: Enrolment data from SES and DISE (2005-06 and 2011-12) Table 3: Enrolment ratios of children in elementary education (2005-06 to 2014-15) Table 4: Age-specific attendance rates calculated from household surveys Table 5: Minimum age at admission in class 1 in different states Table 6: Beginning of the school year in different states Table 7: Primary and upper primary school structure in different states Table 8: Definitions of attendance in different household surveys Table 9: Estimates of out-of-school children from Census 2011 data (based on reported and adjusted age) Table 10: Attendance and enrolment ratios calculated from NSSO 2014 and U-DISE 2014 Table 11: Alternative estimates of projected population for 2014, calculated from UNPD and Registrar General of India RGI (Census office) projections Table12: Alternate estimates of the number and proportions of out-of-school children in the 6 to 13 years age group (NSSO 2014 and U-DISE 2014) Table 13: Estimated number and proportion of out-of-school children in 2007-08 and 2014 Table 14: Distribution of out-of-school children in dimension 2 (6 to 10 years) by their exposure to schooling (2007-08 and 2014) Table 15: Proportion of out-of-school children in the 6 to 10 years age group using alternate definitions (2007-08 and 2014)
List of Figures Figure 1: Definitions of enrolment ratios calculated from administrative data sources Figure 2: Attendance rates calculated from household surveys (2001-14) Figure 3: Proportion of out-of-school children in India, Census 2011 and NSSO 2014 Figure4: The five dimensions of exclusion Figure 5: Proportion of out-of-school children in India, NSSO data Figure 6: Alternate estimates of proportion of out-of-school children, 2007-08 and 2014 Figure 7: Reasons why out-of-school estimates differ
9
1. Introduction
T
he ‘Global Initiative on Out-of-School Children’ launched jointly by UNICEF and the UNESCO Institute for Statistics (UIS) in 2010 attempted to address several critical gaps in education policies. First, it pointed out that accurate statistical information was required to identify out-of-school children as also the reasons why they were not in schools. While accurate statistics do not solve the problem, they help estimate the size of the problem besides also helping in identifying vulnerable groups in order to formulate targeted policies and interventions. They are also useful for monitoring progress and in policy implementation. Second, the initiative highlighted the wide variations in the environment of children from the same age bracket in terms of availability and quality of schooling, household support and community norms. In the past, many countries treated the target age-group under Education for All (EFA) as one homogeneous group in their policy documents and statistical analyses. Third, the initiative emphasized the need to differentiate out-ofschool children in terms of their exposure to schooling (those who had never been to school but were likely to enter, those who had never enrolled and were not likely to enter and those who were enrolled but had dropped out) and in-school children in terms of their schooling experience (those who were at a high risk of dropping out before completing the present stage of schooling and those who were at a lower risk). The analysis following this approach related the profiles of out-ofschool children and those at risk to the barriers that they faced in attending schools and suggested that there should be more targeted policies. This paper is a follow-up of the India Report on Out-of-School Children (UNICEF & UIS, August 2014). India was one of the countries which took part in the first phase of the Out-of-School Children Initiative. One of the important reasons why the India Report was useful was because it highlighted the issues of data quality and data contradictions among existing education data sources. Since the publication of the report, several new education datasets have been released in India. In this paper, indicators of school participation are calculated by including these new datasets to highlight the similarities and differences in different data sources and the possible reasons for these.
2. A feast of data
Estimating the Number of Out-of-School Children
A
look at education statistics in India shows that there have been a number of administrative data and household surveys since the 19th century and newer data sources have also been developed in more recent years.2
2.1 Administrative data sources In 1949-50, the Ministry of Education took over the responsibility of bringing out annual publications with detailed education statistics in the series ‘Education in India’. Since 1990-91, Selected Educational Statistics (SES), which present provisional school statistics, has been brought out annually.3 For this, data on enrolment and teachers was collected by state education departments from all recognized schools, colleges and universities (government and private), from the pre-primary to PhD levels and compiled by the Ministry of Human Resource Development (MHRD). In 2006-07, the report was bifurcated and since then data from colleges and universities is being compiled separately. Data from schools was brought out in volumes of Statistics of School Education (SSE) till 2011-12, after which it was discontinued.4
The f irst All India Education Survey was launched in 1957 by the National Council of Education, Research and Training (NCERT), Delhi. This survey collected information on accessibility, availability and the quality of various types of recognized schools. Since 1957 seven such surveys have been conducted. However, they have been conducted at irregular intervals with gaps of 7 to 9 years. The last one was conducted in 2009. Increasing delays between data collection and its publication have lessened the value of this survey.
The usefulness of the annual SES data was also limited as there was a long time lag between the collection of data and its publication. The SES volumes were also dependent on timely reporting from all states and had to repeat the data for the previous year for those states which failed to submit current data. In the 1990s several education projects partly or fully funded through foreign aid (for example, the District Primary Education Project or DPEP and Lok Jumbish or the People’s Movement) were introduced. These brought about a shift in the data collection process as regular data was required to monitor the implementation of the projects.
The District Information System for Education (DISE) was set up in select project districts with support from UNICEF. So was the National Institute of Education Planning and Administration (NIEPA)5 to ‘Educational Development of India’ dates back to 1870 (Yash Aggarwal, date unknown). Annual data has been collected and presented since 1913-14. Regular Census data has been collected from 1881, and NSSO has been conducting sample household surveys from 1950-51. 3 ‘Education in India’ brought out more detailed information after the statistics was validated and finalized. 4 Since then the ministry has used a single data source for school education, the U-DISE data. 5 This was made a deemed university in 2006 and since then is known as the National University of Education Planning and Administration (NUEPA). 2
14
Indian case study
collect detailed data on infrastructure, teachers and enrolment from all schools which had classes 1 to 8. Over time more districts were brought under the DISE data system and it was universalized with the launch of the Sarva Shiksha Abhiyan better known as SSA (the Education for All campaign) launched by MHRD in 2001. In 2009-10, the Secondary Education Management Information System (SEMIS) was made functional in data collection in schools with classes 9 to 12. A more recent initiative is the development of the Unified District Information System in Education (U-DISE) in 2012. This is a database for all schools with classes 1 to 12. It replaced DISE and SEMIS. Data from all schools under government and private management is collected under U-DISE. Private schools include all schools which receive financial support from the government (aided schools) and schools which do not receive any financial support. U-DISE is the primary source of information for education planning and monitoring for the two centrally sponsored programmes in school education –Sarva Shiksha Abhiyan (SSA) and the Rashtriya Madhyamik Shiksha Abhiyan (RMSA) or the National Campaign on Secondary Education6From 2012-13, MHRD has used U-DISE data as the main source of statistics for school education, and SSE data has not been separately collected since then.
2.2 Household surveys Decadal Census rounds were conducted in India long before independence. The latest 2011 Census was the 15th uninterrupted one since 1872. The Census is based on a complete enumeration of all households and so the number and proportion of out-of-school children can be estimated and disaggregated by individual and household variables such as socio-religious background and work status. The Census provides information on whether a person is attending school or college or pursuing higher education and the level of education he/she has completed. However, it does not provide information on the class that he/she is attending. The National Sample Survey Organization (NSSO) under the Ministry of Statistics and Programme Implementation (MOSPI) has been conducting annual rounds of household surveys since 1950 primarily to provide data for planning and forming policies. Each round of the survey has a different subject of enquiry but information on education is collected in all the rounds. The rounds focus on educational participation and costs (at least once in 10 years, on average with 5- to 7-year intervals) and are a particularly rich source of education data. Based on rigorous sampling methods and estimation procedures, these datasets can be used to estimate school participation levels. Several other government and non-governmental organizations also conduct household surveys at regular intervals. Though their focus is not on estimating school participation levels they collect information on schooling. An important initiative is the National Family Health Survey (NFHS), also referred to as the Demographic and Health Survey (DHS), four rounds of which have been conducted by the International Institute of Population Science (IIPS). IIPS was designated by the Ministry of Health and Family Welfare (MOHFW) NFHS is also referred to as Demographic and Health Surveys http://dise.in/Downloads/FAQs 2015-16.pdf
6
15
Estimating the Number of Out-of-School Children
in 1992-93 to conduct these surveys. These surveys stand out for their organized and rapid data processing and the short time lag between a survey and the publication of its results. The surveys collect information on health and fertility issues to support MOHFW’s policies and programmes as also those of other relevant agencies. The analysis of unit-level data also provides estimates of school participation levels. However, the survey has been conducted at uneven intervals, and after the third round in 2006, there was a long gap with the fourth round being conducted in 2015-16; the state fact sheets for this are now out. The National Council of Applied Economic Research (NCAER) and the University of Maryland have conducted several rounds of surveys of nationally representative samples in India, called the India Human Development Surveys (IHDS). This survey is designed to complement existing Indian surveys and collects data on different dimensions of human development like education, gender, poverty and caste. The range of available data facilitates an analysis of correlations across a range of social and economic conditions and their impact on education outcomes.7 Here too unit-level data can be used to estimate school attendance rates. However, none of these datasets are annual. This has been considered a major lacuna since the 1990s as disaggregated data from annual household surveys can play an important role in monitoring progress and identifying gaps in achieving the goal of education for all. Annual household surveys were initiated in several states (those implementing DPEP). At the beginning of every school year, teachers visited the households in their catchment areas to collect education related information on children in the school-going age-group. This was compiled in Village Education Registers (VERs) and updated annually. This was found useful in maintaining detailed records of outof-school children (OOSC). This system was subsequently introduced in all states as an important part of the new education programme of universalization of education – Sarva Shiksha Abhiyan (SSA). The purpose of these surveys was identifying children who were out-of-school in each village and bringing them back to school. In all states forms were used to collect information on all children below 14 years in all habitations, but these were not uniform.8 The data was collected by different people including primarily government school teachers and members of the local government and/or school management committees. The timing of the survey also differed depending on the school calendar. So data from these surveys in different states are not strictly comparable. The biennial Joint Review Missions (JRMs) provided a forum for SSA to access achievements against targets, share the experiences of different states and suggest policy changes and interventions.9 In these forums evidence based on household surveys and administrative data was used. In the absence of alternative sources of regular data, the number of out-of-school children identified in the SSA household surveys in different states were aggregated and used. http://www.ncaer.org/data_details.php?dID=11 Habitation is a group of contagious houses – habitation and villages are synonymous in the case of smaller villages. Larger villages may be made of more than one habitation. 9 The members of the missions were nominees from the donors and the government. 7
8
16
Indian case study
Different JRMs have pointed out that while estimates of out-of-school children from the SSA household surveys were being used to monitor progress in SSA, estimates for several states were not reliable. These estimates were much below the estimates generated by the large sample surveys and the Census and more reliable data was required. Following this advice MHRD commissioned an independent research organization, the Social and Rural Research Institute - India Market Research Bureau (SRI-IMRB), to conduct a national level sample survey to estimate the number and proportion of out-of-school children in the age-group of 6 to 13 years at the national and state levels in 2005. SRI-IMRB worked under the guidance of Educational Consultants India Limited (EdCIL), a public sector enterprise incorporated by MHRD. The findings were presented in the subsequent JRM and following its suggestions the out-ofschool survey was repeated twice in 2009 and 2014. Several state governments also felt the need for alternate data.10 Odisha was the first state to initiate this process in 2005 when it conducted a state-wide household survey to develop a computerized database on the schooling status of all children between 0 and 14 years. Several states like Rajasthan, Tamil Nadu and Uttar Pradesh have also introduced similar surveys.11 These are popularly known as Child Tracking Surveys (CTS). The states have put in considerable efforts to computerize data from CTS and maintain it in an accessible and user friendly form. However, no state has conducted these surveys regularly and databases have not been maintained properly.
The Odisha government had pointed out a concern in a document that the Village Education Registers were being ‘updated manually on a piecemeal basis at the school by the teachers’. Not all villages conducted house-to-house surveys and in some districts the VER was not maintained regularly because of its voluminous structure (http://www.opepa.in/website/ download/child-tracking-system-cts.pdf) 11 http://dise.in/Downloads/Useper cent20ofper cent20Diseper cent20Data/Sampleper cent20Districtper cent20Elementary Tamil Nadu 2005 July, updated in May. Uttar Pradesh did in July and September. 10
17
3. Confusing stories
Estimating the Number of Out-of-School Children
M
ultiple data sources provide a confusing picture of the progress in school education. Indicators calculated from different data sources vary sharply – be it the proportion of out-of-school children, the proportion studying in age-appropriate classes, proportion studying in private schools or the proportion of dropouts. The focus of this paper is children attending schools and children who are out-of-school.
3.1 Administrative data Administrative data sources estimate the number of children enrolled in schools. Earlier, age-related data was not collected by administrative sources and it was not possible to directly calculate the proportion of children enrolled for any age-group. Hence, the Gross Enrolment Ratio (GER)12 was calculated using school enrolment data to estimate the proportion of children enrolled.13 In more recent years information on the age of enrolled children is being collected by DISE and U-DISE.14 So it is possible to calculate the Net Enrolment Rate (NER) and Age-Specific Enrolment Rate (AER) from the data (Figure 1).15 Figure 1: Definitions of enrolment ratios calculated from administrative data sources Gross Enrolment Ratio (GER)
Net Enrolment Rate (NER)
Age-specific Enrolment Rate (AER)
Primary level
Primary level
(No. of children enrolled in classes 1 to 5)/(child population in the 6 to 10 years age group)
(No. of children between 6 and 10 years enrolled in classes 1 to 5)/(child population in the 6 to 10 years age group)
(No. of children between 6 to 10 years enrolled in classes 1 and above)/(child population in the 6 to 10 years age group)
Upper primary level
Upper primary level
Upper primary level
(No. of children enrolled in classes 6 to 8)/ (child population in the 11 to 13 years age group)
(No. of children between 11 and 13 years enrolled in classes 6 to 8)/ (child population in the 11 to 13 years age group)
(No. of children between 11 and 13 years enrolled in classes 1 and above)/(child population in the 11 to 13 years age group)
Primary level
Number of students enrolled in a given level of education, regardless of age, expressed as a percentage of the official school-age population corresponding to the same level of education. 13 GER at any level is the ratio of enrolment in those classes, irrespective of age, to the child population in the corresponding age group. 14 The last round of the All India Education Survey is not considered in the analysis as the data is dated (the 8th round was conducted in 2009). 15 NER at any level of education is the ratio of children in the corresponding age group who are enrolled in those classes to the child population in the corresponding age group. AER is defined for age groups, and not for level of education. AER for any age group is the ratio of children enrolled in the age group to the child population in the age group. 12
20
Indian case study
The GER data in Table 1 is calculated from SES as this is the only source of data available from 2000. It shows that GER in the primary stage has been more than 100 per cent since 2005-06. This, however, does not mean that all children in the age group are enrolled, as age-grade norms in India vary between states and households, and there are considerable numbers of over-age and under-age students in each class. GER in the primary stage indicates a fluctuating trend. In the upper primary age-group GER is much lower though it has increased over the years. GER for girls lagged behind that for boys in 2000-01, but over time the differences reduced and in 201112 the GER for boys and girls was very similar. Table 1: GER of children in elementary education (2000-01 to 2011-12) (per cent) Year
Primary stage (classes 1 to 5)
Upper primary stage (classes 6 to 8)
Boys
Girls
Total
Boys
Girls
Total
2000-01
104.9
85.9
95.7
66.7
49.9
58.6
2005-06
112.8
105.8
109.4
75.2
66.4
71.0
2011-12
105.8
107.1
106.5
82.5
81.4
82.0
Source: Selected Educational Statistics, Statistics of School Education (relevant years).
GER calculated using different administrative sources may be different Table 2 compares enrolment data and GER from SES and DISE. It shows how GERs depend on the coverage of schools. SES data has been collected for decades and DISE data collection in all districts began much later. Initially, fewer districts were covered under DISE but the coverage improved over time. So in 2005-06, the enrolment figures from DISE were significantly smaller than those from SES. But more recently the enrolment figures have been quite similar. GER ratios have shown the same trend – they were lower in 2005-06 using DISE data but were very similar to SES in 2011-12. Table 2: Enrolment data from SES and DISE (2005-06 and 2011-12)
Enrolment in classes 1 to 5 (million)
Enrolment In classes 6 to 8 (million)
SES
SES
DISE
DISE
Projected population (million) Age 6-10 years
Age 11-13 years
6-10 years age group (per cent) GER SES
GER DISE
11-13 years age group (per cent) GER DISE
GER SES
2005-06
132.1
124.6
52.2
43.7
120.7
73.5
109
103
71
59
2011-12
139.9
137.1
63.0
61.9
131.4
76.9
106
104
82
80
Source: Selected Educational Statistics, Statistics of School Education and DISE, relevant years. Note: Population projections till 2010 are based on 2001 Census and projected by RGI, and for the years after that on the 2011 Census and projected by MHRD.
GER, NER and AER are based on DISE enrolment data and on population projections made by the Registrar General of India (RGI) on the basis of the latest Census population. Projected populations for relevant age-groups are available on the MHRD website (these are based on the Census 2001 data till 2010-11 and on Census 2011 after that).
21
Estimating the Number of Out-of-School Children
NER was lower than GER. NER in the primary stage increased till 2010-11, and then decreased. NER in the upper primary stage showed an increasing trend. As DISE data includes information on age of students it is possible to calculate both GER and NER from the data. Table 3 shows that NER for both primary and upper primary stages was lower than the corresponding GER. In the primary stage NER increased till 2010-11, when it was nearly 100 per cent, but decreased in later years.16 In the upper primary stage NER increased steadily over the years but it was significantly lower than that in the primary stage, though the difference decreased over the years. It is possible to calculate the Age-specific Enrolment Ratio (AER) from enrolment data if information on enrolment by age and class is available for all classes.17 From 2014-15 onwards, information on classes 1 to 12 in all formal schools is being compiled as UDISE data so it is possible to calculate AER for different age-groups from this dataset. For 2014-15 all three rates can be calculated from U-DISE data. AER for the 6 to 10 years age-group was much lower than the over 100 per cent GER. This indicates that nearly 8 per cent of the age-group was not in formal schools. AER in the 11 to 13 years age group was over 90 per cent. But a comparison with the corresponding NER shows that nearly 5 per cent children in the 6 to 10 years age group and 18 per cent in the 11 to 13 years age group were enrolled in school but they were either over-age or under-age for the classes that they were enrolled in. Table 3: Enrolment ratios of children in elementary education (2005-06 to 2014-15) (per cent) Year
Primary stage (theoretical age 6 to 10 years)
Upper primary stage (theoretical age 11 to 13 years)
Districts covered
59.2
604
Gross Enrolment Ratio 2005-06
103.8
2010-11
118.6
81.2
637
2012-13
106.0
85.2
662
2014-15
101.1
91.2
680
Net Enrolment Rate 2005-06
84.5
43.1
604
2010-11
99.9
61.8
637
2012-13
90.8
64.2
662
2014-15
87.4
72.5
680
92.2
90.1
680
Age-specific Enrolment Rate 2014-15
Source: dise.in/downloads/trends-Elementary-Education-2014-15/All India.pdf Note: Population projections till 2010 are based on 2001 Census and projected by RGI, and for the years after that on the 2011 Census and projected by MHRD.
The decline in NER at the primary stage is probably because the projected population was revised on the basis of Census 2011 (in place of Census 2001). The continuing decline in NER at the primary stage could also reflect improved enrolment and age data. 17 This was not possible earlier when DISE compiled data on children enrolled in classes 1 to 8, as no information was collected on children in the primary and upper primary age group who were enrolled in higher grades. 16
22
Indian case study
3.2 Household survey data The data collected through household surveys is different from the school-based data in that household surveys collect data on children’s attendance status rather than their enrolment status. So it is possible to estimate an Age-specific Attendance Rate (AAR) from household data (Figure 2). Table 4 presents age-specific attendance rates from three sources of education data in recent years -- Census population surveys, NSSO education rounds and SRI-IMRB out-of-school surveys. It is possible to estimate the proportion of out-of-school children from household survey data. In order to maintain comparability with enrolment ratios, in this section AARs are calculated and compared using administrative sources. Age-specific attendance ratios calculated from different household surveys are very different Table 4: Age-specific attendance rates calculated from household surveys (per cent) Source
6 – 10 years
11 – 13 years
Census (2001)
69.0
75.0
Census (2011)
78.2
87.7
SRI-IMRB (2005)
93.9
91.4
SRI-IMRB (2009)
96.3
94.8
SRI-IMRB (2014)
97.2
96.7
NSSO (2007-08)
88.0
86.0
NSSO (2014)
89.2
92.5
Figure 2: Attendance rates calculated from household surveys (2001-14) 100 95
Attendance Rate (per cent)
90 85 80 75 70 65 60 55 50 2001 - Census 11-13 years
2005 SRI-IMRB
2007 - ISSO
2009 - SRI-IMRB
2011 - Census
2014 - SRI-IMRB
2014 - NSSO
6-10 years
23
Estimating the Number of Out-of-School Children
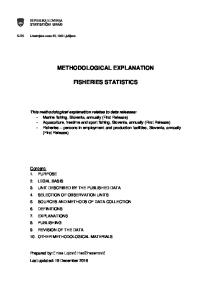
AARs calculated from the three sources vary widely, though within each data source there is an increasing trend over time. Census data shows low attendance rates (78.2 per cent and 87.7 per cent) for the 6 to 10 year and 11 to 13 year age groups even in 2011 as compared to other data sources. Attendance rates calculated from SRI-IMRB data on the other hand are very high; they increased from 93 per cent to 97 per cent in the 6 to 10 year age group and from 91 per cent to 97 per cent in the 11 to 13 year age group between 2005 and 2014. NSSO data comes somewhere in-between. Attendance rates for the 6 to 10 year olds increased marginally from 88.0 per cent to 89.2 per cent between 2007 and 2014, but those for the 11 to 13 year olds showed a sharper increase from 86 per cent to 92.5 per cent (Table 4). Figure 3 shows the proportion of out-of-school children for single-age population between 6 and 13 years from Census 2011 and NSSO 2014 data. Census data shows that just a little more than half of the 6-year-olds were not attending school but this proportion came down sharply with age, indicating that while the national norm for age of admission in class 1 is 6 years, in many households admissions are delayed. NSSO data shows a lower proportion of out-of-school children but otherwise it shows a similar trend – 23 per cent out-of-school children at 6 years of age dropped to 10 per cent at 7 years of age.
60
53.1 53.9
Figure 3: Comparison of Proportion of out-of-school children in India Census 2011 and NSSO 2014
10
11
12.3 14.9
11.9 14.1
10.2
8.1 8.6
5.1 4.8
9
6.9
6.4 6.5
9.7 11.2
11.4 13
11.1 5.2 6.7
10
9.8
6.6 8.3
10.4 13.1
20
12.6 14.3
20.1
30
21.5
40
23.4 23.6
Attendance Rate (per cent)
50
0 6
7
8
Age Years
Male
Female
Census 2011
24
Male NSSO 2014
Female
12
13
Indian case study
There is another major difference in the datasets. There is no consistency as to whether attendance rates in the 6 to 10 years age-group are higher or lower than those in the 11 to 13 years age group. SRI-IMRB data, NSSO 2007-08 and a few other sources show a higher AAR for 6 to 10 year olds as compared to 11 to 13 year olds.18 However, Census data in both 2001 and 2011 and NSSO 2014 show a lower attendance rate for 6 to 10 year - olds. This is in contrast to enrolment rates calculated from administrative data where the enrolment rates for 6 to 10 year olds are higher than those for 11 to 13 year olds. The UNICEF and UIS (2014) study points out that one of the main reasons why children in the younger age group (6 to 10 years) remain out-of-school is delayed entry in school (at 7 or 8 years). This may be due to access problems, lack of pre-primary education or socio-cultural norms. On the other hand, in the 11 to 13 years age group, while some children may never have been to school, a significant proportion may have been enrolled in school earlier, but they may have dropped out as they faced an increasing number of barriers with age. Children are likely to take on more adult roles as they grow older in terms of work inside and outside their homes and upper primary schools are often more difficult to access. The proportion of out-of-school children depends largely on area related barriers arising from differential access and different cultural norms and are very likely to change over time. Multiple sources of data show that enrolment/attendance ratios vary widely. Three different enrolment ratios were calculated from administrative data- GER, NER and AER. GER calculated from the two administrative sources – SES and DISE – was different, though the differences reduced over time. In the elementary stage DISE data was largely used and it is seen that over the last decade GER has remained very high but NER and AAR have remained significantly lower. And GER and NER in the primary stage showed fluctuating trends over time – in the upper primary stage they show a steady increase. Data from different household surveys show greater variations – attendance rates calculated from Census data were the lowest, those from NSSO data were much higher and those from SRI-IMRB were the highest. The differences were largely in the attendance rates of 6 to 10 year olds, particularly for 6 and 7 year olds. The rates calculated from the two different sources also varied considerably though in 2014 the AER calculated for both the age groups using U-DISE data was quite similar to the AAR calculated using NSSO data.
School attendance rates calculated from NFHS and IHDS data different rounds also show a higher rate for the younger age group.
18
25
26
4. A look beneath the surface
27
Estimating the Number of Out-of-School Children
D
ifferent data sources have underlying differences in the definitions of attendance rates and out-of-school children, the data collection process and the estimation methodology.19 These definitional issues are aggravated by inter-state differences in the schooling system –school structure, school management, school calendar and age-grade norms are determined independently for each state.20 These differences together explain many of the differences in estimates of out-ofschool children and in attendance rates.
4.1 Definitions used In India the objective of Universalization of Elementary Education (UEE) and the Right of Children to Free and Compulsory Education (RTE) Act is that all children complete 8 years of schooling by the age of 14 years.21 This requires that all children in India start class 1 by 6 years of age. Attendance rates are calculated on the assumption that children start school in class 1 on completion of 6 years of age, and complete primary schooling in 5 years (classes 1 to 5) and upper primary schooling in 3 years (classes 6 to 8). Age of admission: The official minimum age of admission to a school is not 6 years in all states. It varies and is also below 6 years in many states (see Table 5).22 This means that a significant number of children are admitted to school before the age of 5 years. But the ground situation is very different. As Figure 3 shows, for both Census and NSSO data the proportion of out-of-school children was higher at the age of 6 years and this decreased till the age of 9 years, indicating that a significant number of children entered school at the age of 7, 8 or 9 years. Table 5: Minimum age at admission in class 1 in different states Age (years) States /Union Territories 5
Andaman and Nicobar Islands, Andhra Pradesh, Arunachal Pradesh, Chhattisgarh, Dadra and Nagar Haveli, Daman and Diu, Delhi, Gujarat, Haryana, Jharkhand, Kerala, Puducherry, Rajasthan, Uttar Pradesh, Uttarakhand, West Bengal
5+
Assam, Chandigarh, Goa, Himachal Pradesh, Jammu and Kashmir, Karnataka, Madhya Pradesh, Manipur, Odisha, Tamil Nadu
6
Lakshadweep, Maharashtra, Meghalaya, Mizoram, Nagaland, Punjab, Sikkim
6+
Bihar, Tripura
Source: Selected Information on School Education 2011-12.23
Parents who have never been to school themselves are unlikely to be aware of admission norms or be guided by them. They are more likely to enrol their children in school at the age which they and the local school teacher consider appropriate, and are influenced by the distance to school and a child’s health. These differences have been discussed in details in the UNICEF– UIS 2014 publication: Global Initiative on Out-of-School Children: A Situational Study of India. We use the same framework and the details of the survey to understand these wide variations. 20 Education was a state subject till the mid-1970s. 21 The decision to universalize elementary education for children between 6 to 14 years had been a part of the national policy on education in India since the mid-1980s and it precedes EFA objectives; also see Colclough and De (2010). 22 RTE rules are the same for all states. As per the rules all children should be enrolled in class 1 by the age of 6 years. 23 This is the latest source of information available. 19
28
Indian case study
Beginning of a school year: An additional complication arises from the differences in the timing of the school year. As Table 6 shows, the school year begins in different months in different states. While in most of the north-eastern states the school year begins in January or February, the southern and western states begin their school year six months later.24 So even when two states have the same minimum age of admission, the age is calculated from the beginning of their respective school year. For example, a child who completes 6 years of age in May will be enrolled in class 1 in states where the school year begins in May, June or July, but not in states where the school year begins earlier in the year. Table 6: Beginning of the school year in different states School year begins from
States/ Union Territories
January
Assam, Mizoram, Nagaland, Tripura
February
Manipur, Meghalaya, Sikkim, West Bengal
April
Andaman and Nicobar Islands, Bihar, Chandigarh, Delhi, Jharkhand, Haryana, Himachal Pradesh, Lakshadweep, Punjab, Odisha, Uttarakhand
May
Karnataka
June
Andhra Pradesh, Chhattisgarh, Dadra and Nagar Haveli, Daman and Diu, Goa, Gujarat, Kerala, Maharashtra, Tamil Nadu, Puducherry
July
Arunachal Pradesh, Madhya Pradesh, Rajasthan, Uttar Pradesh
November
Jammu and Kashmir
Source: Selected Information on School Education 2011-12.
Different data sources use different reference dates for calculating age. They are uniform for all states and so do not match the state school calendar. Administrative data uses the beginning of the school year in the respective states as the reference date. The National Family Health Survey (NFHS) uses 1 April, SRI-IMRB uses 1 January, NSSO and Census note the age on the date of the survey (NSSO 2014 was conducted between January and June and Census 2011 in February and March). These factors indicate that the high number of out-of-school children at 6 years of age in both the Census and NSSO surveys could be because in many states the survey is conducted much after the beginning of the school year. A large proportion of the children who were of school-going age at the time of the survey, may not have been at the right age at the beginning of the school year and so would not have been admitted in school. These children are identified as out-of-school by the survey data. In out-of-school studies conducted around the world a crude age adjustment is made in several cases. If a majority of the household interviews take place say 9 months after the start of the school year, the age of all children is reduced by one year to better reflect their age at the start of the school year.25 A similar exercise with Census data has been attempted in Section 5 below of this paper which points to a need for an age adjustment. This crude age adjustment is however not accurate. Ideally Differences in school years arise because the schooling system has developed independently under different state governments and these have not been coordinated. The timing for the school leaving board examination is coordinated, but differences in school calendars persist. 25 Studies which are a part of the Global Initiative on Out-of-School Children. 24
29
Estimating the Number of Out-of-School Children
the age should be adjusted for every single child according to his or her date of birth, so that the age at the beginning of the school year can be calculated. In India any such adjustment needs to be done separately for each state, taking into account the time of the survey and the state’s academic year. The difference in minimum age of entry should also be considered in this computation. Such an exercise at the state level will be very insightful and useful for state governments. For estimating the number and proportion of children attending (or not attending) school, the types of schools, definition of school, the school structure (in terms of classes and levels) and the concept of attendance need to be clearly defined. It is seen that different data sources often use different definitions of these terms. Definition of school: Administrative data sources SES and DISE/U-DISE collect enrolment data from class 1 to class 12 (for calculating enrolment ratios at primary, upper primary and secondary stages) from all formal recognized schools –government, private aided and private unaided. However, in the absence of a comprehensive list of schools it is difficult to ensure that data from all private unaided schools is collected. The SES publication does not document data limitations but the proportion of private schools included in the data fluctuates over the years, indicating that the coverage is neither uniform nor complete. DISE publications note the difficulties faced in collecting data from private schools in its annual publications. Unit data in these publications shows that while the coverage of private schools has increased over time, there is a problem of inconsistency. Certain private schools may figure in the data in one year and not in the next year.26 In recent years, DISE (and U-DISE) has tried to collect data from private unrecognized schools as well. At the beginning of a new round of data collection for U-DISE the state education departments are requested to update existing school directories to include details of schools which have been upgraded, closed or merged with other schools. There is also a media campaign targeted at private unaided schools to provide information for the data collection exercise. Each school requires a U-DISE code to avail of various scholarships and other incentives. Schools not included in the school directory have no code. The DISE website (http:// www.dise.in) provides a ‘hotline’ so that if a student or any other data user does not find his/her school code this can be reported. This enables U-DISE to find out about schools not in the system so that the problem can be addressed. DISE and U-DISE data also does not include any non-formal schools, or schools imparting only religious education in enrolment data.27 It is possible to collect information on participation in all types of educational institutions, formal and non-formal, and within formal, recognized and unrecognized through household surveys. So there is a greater variation in the types of schools covered in household surveys. Survey manuals describe educational institutions that are considered when collecting data on school attendance. All the three household surveys28 include formal government schools, recognized and unrecognized formal private schools and madrasa centres which teach general school subjects in their definition of schools. A 26
This makes it difficult to calculate dropout rates and transition rates from enrolment data for successive years.
In the past SES collected data from non-formal education institutions and open schools, but they were presented separately. 28 Census 2011; NSSO 2014; U-DISE 2014. 27
30
Indian case study
comparison between NSSO and DISE or U-DISE data provides an estimate of the extent to which private school enrolments are under-estimated in enrolment data – while the proportion of enrolment in private schools was lower in the earlier years of DISE data, it was quite similar when NSSO data was compared with U-DISE 2014 data. The approaches of these data sources are different regarding non-formal educational facilities and education facilities for pre-primary education. NSSO codes children attending non-formal education facilities separately – while the numbers are estimated, they are not included in calculating the rate of children attending school. The Census does not state definitions clearly but it is likely that children attending non-formal education centres are not included when identifying children attending schools.29 The SRI-IMRB out-of-school surveys on the other hand clearly include non-formal education centres, centres conducting bridge courses (residential and non-residential), unrecognized madrasas providing general education in addition to religious education and Sanskrit pathshalas which primarily teach Sanskrit language (recognized by the state Sanskrit board and also teach environmental science or EVS and mathematics in addition to language) in their definition of a ‘school’. The Annual Status of Education Report (ASER) survey uses a somewhat similar definition while NFHS has no clearly stated definition.30 The India Human Development Survey (IHDS) includes open schools in its definition of a ‘School’.31 There is also a difference regarding the inclusion of pre-primary education. None of the administrative data includes enrolment in pre-primary classes in calculating enrolment rates which are based on enrolment in class 1 and above. NSSO does not include students attending pre-primary classes in its calculation of attendance rates either. However, Census data includes children enrolled in preprimary classes in formal schools in its estimate of the number of children attending educational institutions.32 SRI-IMRB and ASER also include children in pre-primary classes in formal schools (Table 8). The inclusion of pre-primary classes makes a marked difference as more than 3 per cent of the child population in the 6 to 10 years age group is attending pre-primary classes.33 School structure: The definitional issues are aggravated by existing state-level differences in education administration. School education in India developed under state governments. It was as late as 1976 that it became the joint responsibility of the central and state governments.34 Since then there have been attempts to have a common school structure in all states where the school levels are matched The Census definition includes kindergarten/nursery/Montessori schools or primary schools or lower/middle/secondary or matriculation/junior school certificate/secondary school or higher secondary/intermediate/pre-university/senior secondary school. Correspondence courses or open schools which provide school education are also included in the definition. 30 Annual Status of Education Report (ASER) surveys were conducted in rural areas of all states in India under the supervision of ASER Centre, a non-governmental organization from 2005 to 2015. The main purpose of the surveys was to assess levels of learning of children of primary school-going age using easy-to-administer learning achievement tests of numeracy and literacy. This was done in randomly selected households; the surveys also collected information on school participation. 31 The National Open School (NOS) was established in 1989 by the Ministry of Human Resource Development (MHRD), Government of India. It offers elementary level courses through its Open Basic Education Programmes (OBEs) through open and distance learning in addition to general and academic courses at the secondary and senior secondary levels. It was renamed the National Institute of Open Schooling (NIOS). 32 The definition is not clear in the Census manual. 33 Given that the Census data includes pre-primary education it is not clear why the attendance rates are lower than they are in other sources. 34 42nd Amendment to the Constitution of India. 29
31
Estimating the Number of Out-of-School Children
with the International Standard Classification of Education (ISCED) levels, but not all states have adopted this method. The common school structure consists of primary, upper primary, secondary and senior secondary levels, which in 2014 were classified as levels B, C, D and E in the Indian Standard Classification of Education (InSCED).35 These levels correspond to classes 1 to 5, 6 to 8, 9 and 10, and 11 and 12. But school structures differ in different states and the primary level can be up to class 4 or class 5. The upper primary level will then start from class 5 or class 6 and will be up to class 7 or class 8. While earlier DISE and NSSO rounds used state-specific school structures to calculate gross and net enrolment/attendance rates, they have been using the uniform InSCED school structure in recent years. The school structure in different states differs in other ways too and adds to the difficulties in collecting administrative data. While many private unaided schools are integrated and have primary, upper primary and secondary or higher secondary classes, very rarely are government and private aided schools integrated in this way (Table 7). Some states have separate schools with only primary classes or upper primary classes; others have schools with the two stages together. Similarly, a few states have upper primary and secondary classes together.36 This makes data collection for DISE quite a complex affair in some states as data has to be collected from primary, upper primary and secondary schools.37 On occasion, data from class 8 was missed out as this was a part of a secondary school. Table 7: Primary and upper primary school structure in different states School structure
State/union territory
Primary
Classes 1-5
Upper Primary
Classes 6-8
Primary
Classes 1-5
Upper Primary
Classes 6-7
Primary
Classes 1-4
Upper Primary
Classes 5-8
Primary
Classes 1-4
Upper Primary
Classes 5-7
Andaman and Nicobar Island, Andhra Pradesh, Arunachal Pradesh, Bihar, Chandigarh, Chhattisgarh, Daman and Diu, Delhi, Haryana, Himachal Pradesh, Jammu and Kashmir, Jharkhand, Madhya Pradesh, Manipur, Meghalaya, Nagaland, Puducherry, Punjab, Rajasthan, Sikkim, Tamil Nadu, Tripura, Uttar Pradesh, Uttarakhand Karnataka, Odisha Dadra and Nagar Haveli, Lakshadweep, Mizoram, West Bengal Assam, Goa, Gujarat, Kerala, Maharashtra
Source: Selected Information on School Education 2011-12.
Definition of attendance: In a developed country where school-going is a norm, children are absent for an extended period under special circumstances such as long-term illness or a family crisis. In a developing country the situation is different. Different school surveys have pointed out that in This is a statistical framework for the collection, compilation, dissemination and analysis of education statistics in India. It allows documentation of all types of education programmes in India and it also helps align it to the International Standard Classification of Education (ISCED). 36 Some states like Maharashtra and Gujarat had class 8 in secondary schools. 37 With a unified data collection system for classes 1 to 12, this problem has now been sorted out. 35
32
Indian case study
many states a high proportion of students are absent on an average school day. The reasons for this include work responsibilities at home and outside, migration, social events such as weddings or family functions and truancy. Students who are very irregular or are absent for an extended period are at a high risk of dropping out. They find it difficult to cope with the studies, fall behind and eventually may stop attending school.38 Similarly, those who are absent for seasonal work, may decide not to return to school. So it is important to have a clear definition of a child who is attending school and a child who is not attending school (not enrolled or dropped-out). The definition of attendance should include a pre-decided reference period so that if a student has attended school even once in that reference period, he/she is considered attending school and those who have not attended even a single day in the reference period are considered to be out-of-school. In all administrative records, student enrolments in classes 1 to 8 on 30 September are used for measuring school participation on that date. This, however, does not provide an estimate of the numbers currently attending schools. In states where schools follow a policy of deleting names if students are absent continuously for an extended period without informing, the school enrolment data will also be an estimate of school attendance. On paper some states have such a reference period which varies from 15 days in Kerala to 6 months in Bihar, but it is not clear whether this is implemented at the school level. In some of the household surveys, attendance norms are defined in greater detail. The SRI-IMRB report has a very clear definition: a child is categorized as ‘out-of-school’ if he/she is either not enrolled in a pre-primary class or above or is enrolled but has been absent continuously for more than 2 months preceding the date of the survey, or has discontinued studies. NSSO considers children never enrolled in class 1 or above and dropout children as out-of-school but no definition of dropouts is provided. So it depends on how the parents perceive the schooling status of their child and there is no uniform definition. NSSO has an additional clarification that if a child has not been attending school for an extended period because of illness, vacation or in the interval after exams when the results are to be announced, the child should be considered ‘attending’ and not out-of-school. The Census has a similar definition. ASER, NFHS and IHDS use enrolment as a proxy for attendance (Table 8).
Under RTE there is an option of considering children who have been absent for an extended period (45 working days) as out-of- school and providing special education to students to enable them to catch up with the class if they come to school after more than a three month absence. But it is not sure whether this system is applicable to other irregular students.
38
33
Estimating the Number of Out-of-School Children
Table 8: Definitions of attendance in different surveys Survey source
Schools and classes included
Schools and classes not included
Definition of attendance
NSSO
Formal schools and EGS, classes ≥class 1
Pre-primary non-formal including AIE
classes, schools
No reference time period given. If currently not attending because of illness, vacation or awaiting results – not out-of-school
Census
All formal schools from kindergarten/nursery/Montessori schools to senior secondary. Correspondence courses or open schools providing school education
Not clear if non-formal schools are excluded
No reference time period given. If currently not attending because of illness, vacation or awaiting results – not out-of-school
IMRB
Formal school ≥class 1, pre-primary classes, EGS and AIE, recognized madrasas, Sanskrit Pathshalas, bridge courses
Schools with only religious education, anganwadis or balwadis, correspondence courses
Attended at least one day in the previous 2 months
NFHS
Formal school ≥class 1, no details
Pre-primary. No other details
Attended any time in the reference year
ASER
Formal school ≥class 1. madrasas, EGS, AIE
Anganwadis or balwadis
Currently enrolled
IHDS
Formal school ≥class 1, madrasas and open schools
Pre-primary (not stated clearly)
Currently enrolled
EGS,
Note: 1. EGS centres are centres under the Education Guarantee Scheme and were set up for children from small and remote habitations who faced difficulties in accessing schools which were within walking distance. These were to work as transitory facilities till they were upgraded to formal government primary schools. 2. The AIE (Alternative and Innovative Educational) scheme was aimed at providing education for very specific difficultto-reach groups of out-of-school children. It included bridge courses, drop-in centres and other alternative education centres. 3. Anganwadis and balwadis- These are pre-primary education facilities run under the Ministry of Women and Child Development. 4. Bridge courses are short-term education courses, residential or non-residential, which are provided to out-of-school children for mainstreaming them.
4.2 Data collection process and methodology of estimation It is important to admit at the outset that the information collected by any agency may have inherent biases. The data collection process is an interaction between two or more individuals and the data reflects the perceptions of these individuals. Some of the errors that creep in during the data collection process are unanticipated and can arise out of ignorance or not understanding the questions. Some errors may creep in because of the nature of the tools or biases of the data collector or the respondent. There is a need to be aware of these issues when interpreting data. Data collection process: Data for school education compiled in SES is collected by the education administration in the states. State education departments collect data from all recognized schools and colleges and send it to MHRD. While this process is not clearly explained, the explanations provided in SES make it clear that when any data is not provided by a concerned state, it is either substituted
34
Indian case study
by DISE and SEMIS data or the previous year’s data is repeated. So there is no data validation process. Collection of DISE data is the responsibility of the block and cluster level education officers.39 At the school level, information is collected by the head teacher with support from other teachers and the school development management committee. This information is sent to SSA’s block education office via the cluster resource centre (CRC)/nodal school. It is then sent to the district education office. The responsibility for data collection from private unaided schools also lies with the CRC and with the teachers. However, as they have no authority over the management of private unaided schools, they are not able to ensure that private schools provide the required data within the given time period. Hence, it is difficult to ensure that data from all private schools is included in DISE reports. The U-DISE data collection system has an in-built process of data checking and data validation. A 100 per cent checking of filled forms is done at the CRC, 20 per cent at the block level and 10 per cent at the district level. Till 2011-12, SES and DISE information systems provided parallel sources of data collection, particularly for primary and upper primary classes. This was an additional burden on school teachers and head teachers, and may have led to reduced resources or motivation to provide accurate and detailed information. Due to parallel but not uniform data collection processes enrolment figures from different sources did not match adding to data confusion. With the development of a U-DISE system, SES publications were stopped. U-DISE is now the single administrative source of school statistics for classes 1 to 12. There may be an upward bias in enrolment data, as there is a tendency to inflate enrolments when crucial decisions like teacher postings and disbursement of incentives are based on enrolments.40 As Mehta (2003) points out, with the introduction of the mid-day meal (MDM) scheme, a huge jump in student enrolments and attendance was found. Enrolment data may also be over-estimated if many children are enrolled in more than one school at the same time. With stress on universalization of education, schools do not refuse admission to any child below 14 years. So children who have changed schools without informing the schools in which they were enrolled earlier and not taken transfer certificates figure in enrolment registers in both the schools. There are also cases where children enrol in a government school to take advantage of incentives and in a private school for additional teaching, and they may also figure in the enrolment data for both schools. There are many differences in collection processes followed by different household surveys as well. Census data which requires complete enumeration is not collected by regular trained staff, but by a large number of enumerators (school teachers and other government employees).41 They are given Each block is divided into several clusters, and a school in that cluster is developed as a resource centre or a nodal school. CRCs are located in the secondary or higher secondary school in the gram panchayat which has the highest enrolment. These are resource centres which on-site academic support to teachers at the elementary level. They also maintain education data which is used for planning, implementing and monitoring SSA activities. 40 Mehta (2003), available at: http://www.educationforallinindia.com/ 41 For DISE and U-DISE data a bias arises because school teachers are data collectors in their own schools. For the Census they collect data through household surveys and are not likely to suffer from similar biases. 39
35
Estimating the Number of Out-of-School Children
a few days of training and are expected to complete the data collection in a short time. Data quality may vary between areas depending on the rigour of the training provided and the level of monitoring. SSA household surveys are conducted annually, usually by government school teachers assisted by members of local bodies or school management committees. As school teachers survey households in the catchment area of a school, there is a tendency to inflate enrolments. Teachers are also under pressure to demonstrate that very few children are out-of-school and that the education for all (EFA) targets are being met, and so there is a tendency towards under-reporting children who are out-ofschool. Other surveys such as the SRI-IMRB survey, the IHDS survey and NFHS are usually conducted by the staff of the survey organization and so their quality and ability cannot be assessed. While they are likely to have experience in conducting surveys, they are usually provided short training on using survey tools. In contrast, NSSO regularly trains staff for this purpose and conducts annual household surveys. Biases in household surveys can crop up because of a respondent’s reluctance in providing certain information. There are several legislations and policies that relate to children under 14 years which require them to be in school, for instance, the RTE Act and the Child Labour Act. So households are likely to either misreport an out-of-school child as attending school, or to report a higher age for a child under 14 years if he/she is out-of-school. This bias may be the reason why surveys which focus on schooling have higher rates of school attendance as compared to multi-purpose surveys. For example, the tools used by out-of-school surveys (SRI-IMRB and SSA household surveys) focus on the education of children up to 14 years. Households which are reluctant to admit that their children below 14 years are out-of-school may misreport the ages of these children. The tools used by NSSO, Census and NFHS are more general and focus on all household members and not solely on children’s education.42 The other reason why data on the age of children may be incorrect is that respondents in a household may not have the knowledge or awareness to provide accurate information regarding the age of a child or schooling details of each child in the household. The respondent may not recall the child’s date of birth, especially in rural areas where not all births are registered. And there may be errors in the process of calculating the age (in years) from the date of birth because of which approximations may take place. Age heaping, for example, is a common finding in most household surveys, which results from rounding of ages to the nearest 5 or 10; as a result, the number of children aged 5, 10, 15 gets inflated. Similar errors are likely in calculating the age and grade matrix from school data. The date of birth in school registers is not recorded on the basis of birth registration, but on vague memories of parents and teachers.43 Sampling design and estimation: Other than U-DISE and the Census household surveys, other surveys are based on samples. Differences may arise from the differences in sampling strategies and the scope of the surveys.
Similarly, education surveys like ASER (different rounds) and PROBE (1996 and 2006) show high attendance rates, while the rates are much lower in NFHS rounds. 43 Mehta (2003). 42
36
Indian case study
NSSO uses a stratified multi-stage design. Educational details of all members of a household are collected. The sample design of the SRI-IMRB survey is also stratified and multi-stage and uses the sampling frame of NSSO 2007-08. This sampling frame collects educational data for 5 to 13 year olds and details till up to class 8. Other national-level surveys also use a stratified multi-stage design, but the sampling design and stratifying variables depend on the purpose of the survey. For example, at the level of household selection the surveys used different approaches – the NSSO 2007-08 survey used two strata for selection of households, one from households who had any member aged 5-29 years enrolled in the primary and above levels and the remaining households from the other stratum.44 The 2014 survey used three strata for selecting households, the first stratum was households with at least one student receiving technical/ professional education, the second stratum was households with at least one student receiving general education and the remaining households formed the third stratum.45 The SRI-IMRB survey selected households who had at least one child between 5 and 13 years of age, and within it there were two strata – one with at least one child who was differently abled and the other with no child who was differently abled.46 For the NFHS survey the households were randomly selected from sample villages. There were differences at the level of selecting villages and urban blocks. There may be other reasons why these estimates vary depending on sample characteristics. The proportion of out-of-school children is high among vulnerable population groups such as street children, children in unauthorized camps and differently abled children hidden in homes. Sample surveys are likely to include these categories of the population to varying extents, depending on their sampling design.47 As Census surveys cover all population groups, this could be one of the reasons why their data shows the lowest attendance rates for all age groups. Finally, estimates also depend on the projected population for the relevant year and may differ when the population projections are different. Estimation methods also differ. One of the primary aims of the Global Initiative on Out-of-School Children undertaken by UNICEF and UIS is ‘to improve statistical information and analysis on out-of-school children’ (OOSC). Its Operational Manual outlines an estimation method where estimates of out-of-school boys and girls are made for a single-age population between 6 and 13 years which is then aggregated to arrive at the number of children who are out-of-school in the different age groups. For this UNDP’s projected population is used and in the absence of state-level population projections this is estimated at the national level. The SRI-IMRB out-of-school survey differs in two aspects. First the calculation for the age group is done together (and not based on a single-age population) and second, estimates are made at the state level using ‘state level projected population supplied by NEUPA’.48 On the basis of state-level population projections the number out-of-school children in urban and rural areas in each state is estimated and consolidated to arrive at national estimates.
http://mospi.nic.in/Mospi_New/upload/nsso/design_est_64.pdf http://mospi.nic.in/Mospi_New/upload/nss_71st_ki_education_30june15.pdf 46 http://ssa.nic.in/pabminutes-documents/NS.pdf 47 UNICEF and UIS (2016). Monitoring Education Participation: Framework for Monitoring Children and Adolescents who are Out-of-school or At Risk of Dropping Out. Geneva: UNICEF. 48 These are population projections made by the Registrar General of India for 6 to 10 and 11 to 13 years age groups. http:// www.educationforallinindia.com/aii_india_survey_of_out_of-school_cghildren_2010.pdf 44 45
37
Estimating the Number of Out-of-School Children
School participation of children varies throughout the year and is different in different regions. The school calendar, agricultural calendar and climatic conditions are some important factors which lead to variations in enrolment and attendance rates. Pupil absenteeism is often very high at the time of harvesting. The school calendar is usually uniform in rural and urban areas and often this conflicts with the agricultural calendar. Climatic conditions vary in different locations in each state, and attendance may be a problem in the rainy season in areas prone to flooding. So the timing of the survey plays a critical role in estimation, and may partially explain the variations. The data for the 71st NSSO round was collected between January and June 2014.For the SRI-IMRB outof-school survey, data was collected between February and May 2014. Census 2011 data was collected in February 2011. ASER data was usually collected in November every year. An important difference may lie in the extent to which differences in the state education structure are incorporated in state-level estimates and in the way the data is aggregated to arrive at the national picture. The 64th NSSO round used the state education structure to arrive at state level estimates. So the attendance rates for states which had classes 1 to 4 at the primary level was estimated differently from states which had classes 1 to 5 at the primary level. Similarly, DISE data used the state education structure for calculating attendance rates. But in more recent years both these data sources have shifted towards using a uniform schooling structure. When state school structures are different, estimates based on the assumption of a uniform school structure may be incorrect.
38
5. Estimating the number and proportion of out-of-school children
Estimating the Number of Out-of-School Children
I
n this section we first examine the number of out-of-school children from Census 2011 data. This is followed by a comparison of estimates based on two recent sources of data: the NSSO education round data and the U-DISE data for 2014. A similar estimation is made from NSSO 2007-08 data to examine the changes in the number and proportion of out-of-school children. For estimating the number of out-of-school children we broadly followed the methodology developed by UIS and UNICEF for the Global Out-of-School Children Initiative.49 The analysis shows that even with reliable data and a similar methodology, estimates of the proportion and number of out-of-school children may differ. It provides suggestions for improving data quality in both administrative datasets and household surveys. It also identifies some methodological aspects which may require rethinking in the context of developing countries. Dimensions of exclusion: Dimensions of exclusion from school participation is a model adopted in the present Global Out-of-School Children Initiative and is elaborated upon in its Operational Manual, where 5 groups of children spanning three levels of education -- pre-primary, primary and lower secondary -- are identified for data and policy analysis. Each group represents a distinct ‘Dimension of Exclusion’. It explains children who are of an appropriate age for pre-primary, primary and lower secondary classes but who are out-of-school as being in dimensions 1, 2 and 3 respectively (Figure 4). Children in dimension 1 are those who are one year younger than the official primary entrance age but who do not attend pre-primary or primary school (ISCED 0 and 1), while children in dimensions 2 and 3 are those in the age groups corresponding to the primary and lower secondary stages respectively but who are not attending primary or secondary school (ISCED 1, 2 and 3). Children in dimensions 4 and 5 are in primary and lower secondary school respectively, but they are at risk of dropping out. Figure 4: The five dimensions of exclusion Dimension 1 Not in preprimary school
Dimension 3
Dimension 2 Attended but dropped out
Pre-primary age children
Will never enter
Will enter late
PRIMARY AGE CHILDREN
Attended but dropped out
Will never enter
Out of school
LOWER SECONDARY AGE CHILDREN
Dimension 4
Dimension 5
At risk of dropping out of primary school
At risk of dropping out of lower secondary school
PRIMARY SCHOOL STUDENTS
Will enter late
In school
LOWER SEDONDARY SCHOOL STUDENTS
Source: UNICEF and UIS (2016).
The methodology requires unit-level data and single age population figures. This was not available for Census based population projections and in the U-DISE data.
49
42
Indian case study
Dimensions 2 and 3 include all children who are not attending any institution which provides education equivalent to the primary level or higher. So children in the 6 to 13 years age group who attend preprimary education facilities are included in dimensions 2 and 3, and thus considered out-of-school as the education levels in these classes are below the primary level.50 Again children who attend non-formal education centres which are not officially recognized and are not equivalent to primary or secondary classes in the formal education system are also included in dimensions 2 and 3 and considered out-of-school. The framework of this global initiative acknowledges that children in these groups are different from those who do not attend any educational facility and suggests an additional analysis of these groups in countries where their numbers are significant. This section focuses on estimations of dimensions 2 and 3, that is, children in the 6 to 10 years age group and in the 11 to 13 years age group, who are not attending primary or secondary school (ISCED levels 1, 2 and 3). The calculations are based on the assumption that the age of entry to class 1 is 6 years51 and the duration of the primary (ISCED level 1) and upper primary stages (ISCED levels 2) are 5 years and 3 years respectively. The calculations are made for the two age groups separately and then aggregated to estimate the number of out-of-school children.52 Estimation of out-of-school children from Census 2011: We used Census 2011 to estimate the number of out-of-school children in 2011. This shows that attendance rates of children in the primary and upper primary age groups were much lower than the rates from other data sources. According to the data, 18.3 per cent (38.1 million) children were out-of-school in 2011. The numbers are particularly high in dimension 2 at 28.6 million. As the Census survey was conducted in the early months of 2011, it is likely that a high proportion of 6 year old children were 5 years old at the beginning of the school year 2010-11, especially as most states start their school years between April and July. So an alternate estimate of out-of-school children was generated by reducing the age of the children by one year.53 Table 9 compares the two estimates and shows that the proportion of out-of-school children showed a sharp drop in the 6 to 10 years age group from 21.8 per cent to 13.4 per cent, though in the 11 to 13 years age group it showed an increase from 12.4 per cent to 14.9 per cent. According to this alternate estimate, 29 million children were out-ofschool. It is a very crude adjustment, and the actual figures will be somewhere in between.
‘Educational properties of pre-primary education and the pedagogical qualifications of teaching staff may not meet the criteria that are applied to primary education’, Conceptual and Methodological Framework (UNICEF and UNESCO Institute for Statistics). 51 As pointed out in Table 5 this may not be true for all the states. 52 The methodology in the Operational Manual requires estimates for single age population and then aggregating the figures. However, single age population estimates from RGI were not accessible, and U-DISE data does not provide AER for single age. So for comparability the exercise was done for the two age groups and not for single age. 53 If the birth dates were known more exact estimates could have been attempted. 50
43
Estimating the Number of Out-of-School Children
Table 9: Estimates of out-of-school children from Census 2011 data (based on reported and adjusted age) Age group
6 to 10 years 11 to 13 years 6 to 13 years
Age as given in Census 2011 Number of out-ofProportion of out-ofschool children school children (million) (per cent) 21.8 28.6 12.4 9.5 18.3 38.1
Age data from Census 2011 adjusted by 1 year Number out-ofProportion out-ofschool children school children (million) (per cent) 13.4 17.5 14.9 11.5 13.9 29.0
Source: Calculations based on Census 2011.
The numbers for Census 2011 are quite high as compared to other surveys. This is the only survey which is able to collect data on vulnerable population groups where a higher proportion of children are likely to be out-of-school. But a more detailed study is required to find out whether the numbers are higher than they are in sample surveys because it is a complete enumeration, or whether the differences in the tools and data collection processes are responsible for this result. Census data contains information on the level of schooling that a child is enrolled in but there is no information on the classes that the children are enrolled in. So we could not attempt a more detailed analysis. Estimation of the number and proportion of out-of-school children from NSSO 2014 and U-DISE 2014 data: We used the NSSO 2014 education round as it is one of the most reliable and recent household surveys.54 The U-DISE data is a comprehensive dataset as it provides information on the age group and classes enrolled in for all children enrolled in classes 1 to 12 in nearly all recognized schools and sometimes also in some unrecognized schools.55 Table 10 compares the attendance and enrolment ratios calculated from the two data sources and highlights their differences. Table 10: Attendance and enrolment ratios calculated from NSSO 2014 and U-DISE 2014 (per cent) Primary education, classes 1 to 5 (theoretical age 6-10 years)
Upper primary education, classes 6 to 8 (theoretical age 11-13 years)
NSSO 20143 Age-specific attendance rate Gross attendance ratio Net attendance rate
89.2 101.0 83.0
92.5 90.0 63.0
U-DISE 2014-15 Age-specific enrolment rate Gross enrolment ratio Net enrolment rate
92.2 101.1 87.4
90.1 91.2 72.5
Attendance or enrolment rate or ratio
Source: NSSO 71st round and U-DISE 2014. Note: The population projections are based on the 2011 Census data. NSSO used the population projections made by the Ministry of Statistics and Programme Implementation (MOSPI) and U-DISE used the projections made by the Ministry of Human Resource Development (MHRD). SRI-IMRB data is not used as it collected information on children in the 6 to 13 years age group. Information on older children studying in elementary classes and educational details of children who were studying in secondary grades were not collected. 55 See section on ‘Definition of school and school structure’. 54
44
Indian case study
It is interesting to note that while age-specific enrolment and attendance rates are quite different for the two age groups, the differences between gross enrolment and attendance rates are quite small. These rates are calculated on the basis of the number of children enrolled/attendance in classes 1 to 8. This implies that the number of children enrolled in classes 1 to 8 according to the U-DISE data is quite similar to the total number of children attending classes 1 to 8 according to NSSO data. The net enrolment rate in U-DISE data is higher than the net attendance rate calculated from NSSO 2014 in both the age groups. So while 87.4 per cent children aged 6 to 10 years in U-DISE data were enrolled, only 83.0 per cent children in the NSSO data were attending school in that age group. Also, 72.5 per cent of the children in the 11 to 13 years age group were enrolled in classes 6 to 8 according to U-DISE data while this figure was only 63.0 per cent according to NSSO data. This implies that there were lower over-age and under-age enrolments according to U-DISE as compared to NSSO. This is in accordance with the results of a study conducted by UIS where the enrolment figures generated by the government were compared with household data from demographic and health surveys in 29 countries. The net attendance rates calculated from the household surveys covering children in the official primary school age were found to be lower than the net enrolment ratios based on administrative data – administrative data were likely to have lower over-age/under-age reporting compared to data from household surveys.56 The study also found that the main factor was not the over-estimation of enrolments, but the misreporting of age. Projected population data for the age group was used to estimate the proportion of children enrolled in school, and the proportion and number of children who were out-of-school. The Operational Manual proposed that the out-of-school population in the 6 to 10 years and the 11 to 13 years age groups be estimated from the United Nations Population Division’s (UNPD) population projections.57 We used the population figures for 2014 from the updated population projections made in 2015. For estimating the number of out-of-school children, the proportion of out-of-school children for the two age groups were computed from age-specific attendance rates from NSSO data and were used with the population figures to estimate the number of out-of-school children in each age group. A similar exercise was done with the population projections made by the Ministry of Human Resource Development (MHRD) on the basis of Census 2011.58 In the U-DISE database’s information on the number of children enrolled in formal schools in class 1 to class 12 in different age groups was collected. So it is possible to calculate the number of enrolled children in different age groups. The Age-specific Enrolment Rates (AERs) were calculated by dividing the numbers enrolled in different age groups by the population projections made by MHRD. The number of children in each age group who were not enrolled in formal schools (that is out-of-school according to the data source) was calculated by subtracting the numbers enrolled from the projected population in the different age groups. It was then quite simple to calculate the proportion of children who were not enrolled in the age group. UNESCO (2010), EFA Global Monitoring Report -Reaching the Marginalized. Paris: UNESCO. UNPD has been undertaking regular studies of population size and characteristics and of all three components of population change (fertility, mortality and migration) since 1950. Based on these studies it provides constantly updated demographic estimates and projections for all countries, including data essential for monitoring progress in achieving the Millennium Development Goals and the new Sustainable Development Goals. 58 http://mhrd.gov.in/population-projection-6-23-years-age-group56 57
45
Estimating the Number of Out-of-School Children
An alternate estimate of the number of out-of-school children can be arrived at by subtracting the number of children enrolled in different age groups from UNPD population projections. Dividing the numbers not enrolled by the population in the relevant age groups provided by UNPD projections provided the proportion of out-of-school children in different age groups. Table 11 presents population projections from the two sources. It shows that according to UNPD projections, in 2014 there were 203.5 million children between 6 and 13 years, while MHRD’s projections indicate there were 205.0 million children in the same year for the same age group. The number of children estimated by MHRD’s population projections was higher by 3 million in the 6 to 10 years age group and lower by 1.5 million in the 11 to 13 years age group. Table 11: Alternative estimates of projected population for 2014, calculated from UNPD and Registrar General of India RGI (Census office) projections (million) 6 to 10 years
11 to 13 years
6 to 13 years
UNPD projections (2015 revision)
127.5
75.9
203.5
MHRD projections (based on Census 2011)
130.6
74.4
205.0
Source: Population projections from MHRD, 2014 and UNPD 2015.
These differences in population figures lead to different estimates of the number of out-of-school children. While the differences are marginal for estimates based on NSSO data, the estimates based on U-DISE data show larger differences. The alternate estimates of out-of-school children from NSSO 2014 and U-DISE 2014 data based on the two sets of population figures are presented in Table 12. Table12: Alternate estimates of the number and proportions of out-of-school children in the 6 to 13 years age group (NSSO 2014 and U-DISE 2014) Age
Based on population projection RGI4
Based on population projection UNPD
Proportion of outof-school children (per cent)
Number of out-ofschool children (million)
Proportion of outof-school children (per cent)
Number of out-ofschool children (million)
6 to 10 years
10.7
13.97
10.7
13.65
11 to 13 years
7.1
5.28
7.1
5.39
6 to 13 years
9.4
19.25
9.4
19.04
6 to 10 years
7.84
10.24
5.60
7.14
11 to 13 years
9.95
7.40
11.70
8.90
6 to 13 years
8.61
17.64
7.88
16.04
NSSO 2014
U-DISE 2014
Source: Calculated from NSSO unit-level data (2014) and U-DISE (2014) data; population projections from MHRD 2014 and UNPD (2015 revision).
46
Indian case study
NSSO figures show that more than 19 million children were in dimensions 2 and 3 in 2014. There was a difference of only 0.2 million children between the out-of-school numbers based on MHRD and UNPD population estimates. The estimated number of out-of-school children calculated from U-DISE data was lower at 17.6 million children when MHRD population projections were used, and even smaller at 16 million when UNPD population projections were used. The differences were more marked if the children in the two dimensions were considered separately. Estimates based on NSSO data and MHRD population projections showed 13.7 million children in dimension 2 and 5.4 million in dimension 3. Estimates based on U-DISE data and MHRD population projections on the other hand indicated 10 million children in dimension 2 and 7.6 million children in dimension 3. Use of U-DISE data with UNPD population projections showed an even greater difference with only 7.14 million children in dimension 2 and 8.9 million children in dimension 3. Two important points that emerge are: 1. A substantial number of children were still out-of-school. These figures were considerably higher than those estimated from SSA household surveys (3 million children in 2014) and the SRI-IMRB 2014 survey (6 million children). 2. While estimates from the two different sources show a difference of around 10 per cent in the total numbers, the difference was higher when dimensions 2 and 3 were considered separately. NSSO data showed around 3.5 million and 6.5 million additional children in dimension 2 compared to U-DISE data and alternative population projections. On the other hand it showed around 2 million and 3.5 million less children in dimension 3 when compared with U-DISE data and with alternative population projections. We have discussed problems that are inherent in the two types of data sources in the earlier sections. These factors do explain the differences in the estimates to a large extent. While major initiatives have been taken to improve the coverage of schools, all schools are not yet covered by the U-DISE data set. Private unrecognized schools which are usually up to class 5 or class 8 are less likely to be included. This may to lead to an under-estimation of enrolments.59 There are other problems which may lead to over-estimation of enrolments. As discussed in an earlier section some schools may have inflated their enrolment rates as the number of sanctioned teachers and funds for incentives depend on school enrolments. There may also be significant double counting of children who are included in the registers in two schools. Students who have been absent from school for an extended period may have dropped out, but there is no system in place to separate the dropouts from those who were absent for a valid reason. So there is a strong likelihood that some of the dropouts are not counted as out-of-school but as enrolled. NSSO surveys face a different set of problems. As data is collected from households, attendance in government and private schools and in recognized and unrecognized schools is considered. But problems A comparison of enrolments in private schools from NSSO 2014 unit-level data and U-DISE unit-level data indicates that the proportions are quite similar – around 37per cent.
59
47
Estimating the Number of Out-of-School Children
arise from respondent bias and sampling issues. The lower number of children in dimension 3 may be due to the respondents’ misreporting age (reporting higher than 13 years for out-of-school children) or schooling status. Here too one of the most important problems is that no clear definition of out-of-school children is used. The responses depend on the perceptions of the respondents.60 While this is a problem in both U-DISE and NSSO data, its impact on the estimates may be very different: in U-DISE data dropout status is decided by the teachers, while in household surveys it is decided by the parents. A major limitation of the NSSO 2014 data is that when educational details of children are collected, the level of education that they are attending (primary, upper primary, secondary, etc.) is noted, but no information is recorded regarding the classes the children are enrolled in.61 This does not allow a calculation of the age and grade matrix of attendance and may be a problem in calculating net attendance rates.62 An important reason for NSSO showing higher numbers in dimension 2 could be related to the age adjustment issue. The NSSO survey was conducted early in the year, and the age of the children at the time of the survey was used. As a large majority of the states begin their academic session between April and July, a significant number in dimension 2 may have been less than 6 years at the beginning of the academic year. If age adjustment was possible there could be a large decline in numbers in dimension 2. U-DISE data on the other hand uses 30 September as the reference date for enrolment and age data and does not have similar problems. Changes in the number of out-of-school children over time: The NSSO 2007-08 round focused on education, and it is useful to compare it with the 2014 round to estimate changes in the number of out-of-school children.63 Estimates based on the two NSSO rounds are presented in Table 13. The same definition of out-of-school children is used here - children 6 to 10 years and 11 to 13 years old who are not attending formal schools in class 1 or above. Table 13: Estimated number and proportion of out-of-school children in 2007-08 and 2014 Age
NSSO 2007-08
NSSO 2014
Proportion (per cent)
Number (in million)
Proportion (per cent)
Number (in million)
6 to 10 years
11.8
14.86
10.7
13.65
11 to 13 years
13.4
9.84
7.1
5.39
6 to 13 years
12.4
24.70
9.4
19.04
Source: NSSO unit-level data 2007-08 (64th round) and 2014 (71st round), population projections from UNPD, 2015. Note: For 2007-08 estimations the average of projected population for 2007 and 2008 is used. In particular this is a problem in government and private aided schools. In a fee-paying private school, if a child’s fee is not paid, his/her name is struck off from the register. 61 In the earlier rounds, for all in-school children information on the class they were enrolled in was collected. 62 In the earlier rounds NSSO used the school structures that prevailed in different states. In the 71st round (2014) uniform definitions of classes 1 to 5 in primary, 6 to 8 in upper primary, 9 and 10 in secondary and 11 and 12 in higher secondary was used. 63 The data for the 64thround was collected over 12 months starting from July 2007. The data for the 71st round was collected between January and June 2014. 60
48
Indian case study
Table 13 shows that the number of out-of-school children declined from 24.7 million in 2007-08 to 19.0 million in 2014. The decline was largely in dimension 3 – from 9.8 million to 5.5 million. The numbers in dimension 2 saw a small decline. The proportion of out-of-school children decreased by 1 per cent (from 11.8 per cent to 10.7 per cent) in the 6 to 10 years age group. But as the child population aged 6 to 10 years increased from 125.9 million in 2007-08 to 127.5 million in 2014, the number of children in dimension 2 declined marginally. In the 11 to 13 years age group the proportion of out-of-school children declined nearly by half from 13.4 per cent to 7.1 per cent. So though the population in the age group increased from 73.4 million in 2007-08 to 75.9 million in 2014, the number out-of-school show a sharp decline. Figure 5: Proportion of out-of-school children in India, NSSO data 40 35 30
Per cent
25 20 15 10 5 0
6
7
8
9
10
11
12
13
Age 2007-08
2014
With the implementation of the RTE Act in 2009, an equally sharp decline in the proportion of outof-school children in the 6 to 10 years age group was expected. Figure 5 presents the proportion of out-of-school children by single age for both rounds of data and shows that there has actually been an increase in out-of-school children in ages 6 and 7 years. As discussed earlier, the timing of the Census survey could be the reason why the proportion of out-of-school children was high for 6-year-olds; here too the low decline in dimension 2 can partly be explained by the difference in the timing of the two rounds of the survey. In 2007-08 the data was collected over 12 months and so the mismatch with the timing of the school year would have cancelled out. But the 2014 NSSO survey was conducted over 6 months (January to June 2014) which is much after the beginning of the school year in several large states. But the main reason could be increased enrolment in pre-primary classes. Table 14 provides a clearer picture of the changes in schooling status of children over these years. It shows that in 2007-08 only 11 per cent of the children in dimension 2 were studying in pre-primary classes, 13 per cent were dropouts and the remaining 75 per cent had never been enrolled in any school. In 2014, the proportion of dropouts had declined to around 10 per cent, never enrolled to 60 per cent and more than 30 per
49
Estimating the Number of Out-of-School Children
cent were attending pre-primary classes. So while the proportion of out-of-school children declined by 1 per cent over the seven years, the proportion attending formal schools in pre-primary grades increased significantly. Table 14: Distribution of out-of-school children in dimension 2 (6 to 10 years) by their exposure to schooling (2007-08 and 2014) Data source
Distribution of out-of-school children
Out-of-school rate (per cent)
per cent never enrolled
per cent in preprimary classes
per cent dropped out
NSSO 2014
59.7
30.7
9.6
10.8
NSSO 2007-8
75.3
11.4
13.2
11.9
Source: NSSO 64th round and 71st rounds. Note: Children who are attending non-formal education centres are included in never enrolled.
As per the Operational Manual of the Global Initiative the definition of out-of-school children is, those children in the primary and lower secondary age groups who are attending pre-primary classes. However, for parents in India these children are attending school. The age-grade norms are not fixed in India, and parents decide when to admit their children and in which grade. With increased privatization, where pre-primary education is often for 2 to 3 years, many children may join class 1 at 7 or 8 years of age. In Table 15 and Figure 6, an alternate definition of out-of-school children is considered to estimate the numbers in dimension 2 from the two NSSO rounds. It is seen that if out-of-school children do not include children who are studying in pre-primary classes in formal schools, the number and proportion of out-of-school children in the 6 to 10 years age group is much smaller in 2014. This definition may capture school participation levels better in developing countries like India where there is no fixed norm for age of admission. If this definition is used then the number of children in dimension 2 shows a sharp decline from 13.35 million in 2007-08 to 9.56 million in 2014. And less than 15 million children in the 6 to 13 years age group were out-of-school, rather than the present number of over 19 million children. This alternate definition also captures the positive impact of RTE and SSA on school enrolments. Table 15: Proportion of out-of-school children in the 6 to 10 years age group using alternate definitions (2007-08 and 2014) (per cent) Definition of OOSC
NSSO 2007-08
NSSO 2014
Proportion (per cent)
Number) (in million)
Proportion (per cent)
Number) (in million)
School age children in pre-primary considered as out-of-school
11.8
14.86
10.7
13.65
School age children in pre-primary considered as in-school
10.6
13.35
7.5
9.56
Source: NSSO 64th round and 71st rounds.
50
Indian case study
FIGURE 6: ALTERNATE ESTIMATES OF PROPORTION OF OUT-OF-SCHOOL CHILDREN, 2007-08 AND 2014
Proportion out-of-school (per cent)
12
11.8 10.7
10
10.6
8 7.5
6
NSSO 2007-08
NSSO 2014
School age children in pre-primary considered as in school School age children in pre-primary considered as out of school
51
52
6. Towards more accurate estimation methods
53
Estimating the Number of Out-of-School Children
I
n this paper enrolment data for 2005 from several data sources was examined, and the proportion of children in the 6 to 13 years age group who were out-of-school was compared. We found that the estimates varied widely – the 2011 Census data shows an out-of-school figure of nearly 20 per cent for children in this age group, while the SRI-IMRB 2014 data arrived at a figure of around 3 per cent. Other data sources, including NSSO 2014 and U-DISE 2014, showed out-of-school rates between 8 and 10 per cent. Such wide variations lead to differences in the profiles of children who are identified as being out-ofschool and this could have major policy implications. It is important to understand the reasons for these differences, the ways in which data quality can be improved and which data sources should be used. The differences arise because of three reasons – the different definitions used by different data sources, inter-state variations in schooling systems and differences in data collection and estimation processes (Figure 7). Out-of-school children are defined in the Operational Manual of the Global Initiative on Out-of-School Children as those children in the age-groups corresponding to the primary and lower secondary (upper primary) stages who are not attending primary or secondary school (ISCED 1, 2 and 3). Figure 7: Reasons why out-of-school estimates differ Definitions used by different sources
State level differences
• • • •
• Minimum age of admission • Beginning of school year • Years in primary and upper primary education • Rules of maintaining enrolment register
Relevant age group Grades included Type of schools Definition of attendance
Date collection and estimation process • Timing of the survey • Purpose of the survey • Respondent bias • Capability of data collectors • Sample design • Population projections Data sources differ in the definitions that they use – they may or may not include non-formal schools, open schools or schools providing religious education, even when the education levels do not correspond to ISCED 1, 2 and 3. Several data sources also include pre-primary classes, that is, ISCED 0 level. Data sources use different definitions of attendance. Administrative data (DISE/U-DISE) considers children whose names are included in enrolment registers as being ‘in-school’. The SRI-IMRB out-of-
54
Indian case study
school surveys commissioned by MHRD,64 consider all children who were enrolled and had attended school even once in the previous 45 days as ‘in-school ‘. Other surveys do not have any clear definition of ‘attending school’. The respondents in multi-purpose household surveys like the Census or NSSO surveys were asked whether the child was going to school, and if yes, in which level or class he or she was enrolled. These methods have qualifications that if a child was not going to school because the exams were just over, during holidays or due to prolonged illness, he or she has to be counted among those ‘in-school’. But they have no specific questions to find out whether a child was attending school regularly. In India, the schooling system is not uniform and there are inter-state variations in the classes included in primary and upper primary stages and in the school type and management. The age groups corresponding to these schooling stages are also different, as seen from the different norms of minimum age of entry. States have their own rules for removing names from enrolment registers when a student is absent for an extended period, but this period varies from state to state. These two sets of differences explain many of the differences in estimates. For example, a student studying in an unrecognized madrasa may be counted as an out-of-school student in the NSSO survey and as being ‘in-school’ in the SRI-IMRB survey. So the two surveys will estimate very different numbers of out-of-school children in states which have a large number of unrecognized madrasas. The different purposes of the surveys determine their sampling designs. Respondents’ bias will be very different for surveys on education and those on multi-purpose surveys. The ability and training of data collectors also vary. Surveys conducted by school teachers may introduce an upward bias in enrolment figures, when teacher postings and incentives depend on enrolments. The SSA household surveys and CTS are usually accompanied with an enrolment drive. So when the teachers or local education committees are involved in these surveys, the respondents (the households) may tend to over-report their children’s school participation. An important difference is the timing of the surveys, as school attendance depends on the agricultural calendar, the school calendar and festivals. The out-of-school definition is based on the relevant age group. So estimates are dependent on the way age data is collected as also the date of reference used by the surveys for calculating age data. Age data in household surveys is not verified. The respondents may not be able to provide accurate age data, or may be unwilling to do so. The reference date for calculating age is the same for all states in India, but as school calendars are different, age adjustments are required for some states for all surveys.
64
Household surveys conducted as a part of SSA also have a definition of ‘attending school’.
55
Estimating the Number of Out-of-School Children
6.1 Identifying data sources for estimating out-of-school children None of the available datasets are free from bias. So it is useful to have more than one data source for estimations. These data sources need to have harmonized definitions so that the estimates do not contradict but complement each other. U-DISE data and NSSO data are both quite suited for this purpose. U-DISE has an obvious advantage as it is collected systematically every year and the tables based on it are maintained on its website. Unit-level data is also freely available on request. An elaborate system of data collection, data verification and data analysis is already in place. If the proportion of out-ofschool children can be reliably estimated from it, it would be a very cost effective process. However, the U-DISE data does not include information on the children’s background except their caste/religion, and so it is not possible to develop detailed profiles of out-of-school children from it. It is very important to identify the key characteristics of out-of-school children so as to provide policy directions and for facilitating targeted interventions. So even though household surveys can be relatively expensive in terms of time and money and hence cannot be conducted every year, they are important for validating administrative data and identifying educationally vulnerable groups. NSSO is best suited for providing an alternate estimate of out-of-school children and for developing their profiles. NSSO conducts large household surveys every year and uses trained staff for data collection. While the education rounds are done once in each decade, some questions on education are included in all the rounds. Adding questions on school attendance in more rounds will ensure regular estimates from household surveys. NSSO surveys are conducted by the Ministry of Statistics and Programme Implementation while U-DISE data is collected and maintained by the Ministry of Human Resource Development. To have reliable and comparable data on out-of-school children, it is important for the two ministries to coordinate and harmonize the definitions used. SSA household surveys are conducted every year as part of enrolment drives. As the primary purpose of the SSA survey is to ensure that all children are brought back to school, it leads to an upward bias in enrolment figures. So these surveys are better suited for identifying individual out-of-school children, and not for estimating the number of out-of-school children. Census surveys are conducted once in 10 years. But they are the only data source based on complete enumeration which provide information on vulnerable population groups who are likely to be excluded in sample surveys. Questions on education, however, need to be more detailed and the definitions need to be harmonized with those used by MHRD. If definitions in the Census enumeration are harmonized and data collectors are trained on education issues in greater detail, it will provide an estimate of outof-school children in vulnerable population groups, and so can be used to adjust estimates based on NSSO data.
56
Indian case study
6.2 Need to revise definitions in the context of a large developing country like India A more reliable method would be to revise the definitions of out-of-school children to match state schooling rules and estimates at state levels: The present estimates from different data sources are based on the assumption that the school structure and the age of admission are the same in all the states and they have more or less uniform age-grade norms. The situation, however, is very different in India. In spite of concerted efforts on the part of the central government, several states retain different school structures. Age at admission has similar problems. Estimates made at the state-level will be more accurate if the relevant age groups and the classes included in the primary and the upper primary stages are revised to match state rules. The data sources should adjust the reference date of age data with the school calendar in a state. There are wide inter-state differences in population trends as well and the estimates should be based on population projections at the state level. Children of primary school age attending pre-primary classes should be defined as in-school: Many developing countries face a surge in the pre-primary enrolment situation which is not reflected in out-of-school estimates if the current definitions are used. The definition should be revised to accommodate these changes. The definition of out-of-school children should also be based on regularity in attendance: Numbers enrolled in a school may change over the year. When a child does not attend school for an extended period it may be because he/she has discontinued schooling, taken admission in another school, migrated, or is absent due to reasons like illness, family crisis, seasonal work or even festivals or family functions. As children who have been absent for an extended period are more likely to drop out, it is important to identify them. Very few data sources use a specified definition to identify children who are enrolled but have not attended school for an extended period. The rules under the RTE Act use a reference period of 45 working days, and a child who has not attended school even for a day in the previous 45 days is identified as out-of-school for monitoring purpose and providing alternative education purpose. This could be used for all data sources. In household surveys these children should be marked as ‘not attending’ school. Teachers should find out the reasons for absenteeism and remove the names of the children who have discontinued studies or have changed schools from attendance registers.
6.3 Recommendations for improving the quality of data Clear definitions: The definition of a school, relevant age group and attendance requirements should be clearly specified. Administrative sources collect enrolment data from formal schools for educational levels which correspond to ISCED 1, 2 and 3. Ideally the household surveys should adopt a similar definition. If they use a different definition, that is, include educational facilities like non-formal schools, open schools or schools providing only religious education, or include education levels which do not correspond to ISCED levels, this should be clearly specified.
57
Estimating the Number of Out-of-School Children
Since the school structure and the age of admission are not the same in all the states, relevant age groups too need to be specified. The best way forward would be to revise the definition of out-ofschool children to match state schooling rules and make estimates at state levels and while producing education indicators including out-of-school at central level state structure should be considered. The definition of out-of-school children should not only be clearly specified in household surveys but it should also be added to the questionnaire on data collection and in the training manual. In addition to questions about school and class enrolled in, respondents should be asked whether the children have been absent continuously for an extended period, and when they went to school the last time. Data on children up to 18 years should be collected: The age-grade norms are not uniform. When education data for children between 6 and 13 years of age is collected, the information on children who are younger or older but enrolled in primary or upper primary classes is missed. This is one of the reasons why the SSA household surveys or the SRI-IMRB surveys are not equipped to identify children who have dropped-out after completing 14 years of education.65 During household surveys, educationrelated data on children up to 18 years should to be collected. Some additional effort is necessary to collect age data, and when possible the reported age should be verified using the immunization card or the school report card (for example, the marks sheet). Household surveys should have appropriate sampling and estimation methods: This will be useful for understanding the differences between different data sources. In multi-purpose surveys often the sampling strategy is determined by the need to collect data on other aspects such as morbidity or mortality. The sampling methods for the survey may not be suited to estimate attendance rates and one should be cautious before using any data source for estimation. Administrative data sources should ensure collection of data from all schools: Enrolment data from all schools – government and private, recognized and unrecognized – should be collected. Collecting information from private unaided schools has been difficult in the past, particularly if they are not recognized by state education authorities. The efforts made under U-DISE are a step in the right direction. All schools are required to satisfy certain quality norms and be recognized under RTE rules. This should make data collection from schools easier. Care needs to be taken that no child is double counted through this process. It is found that some children are enrolled in more than one school simultaneously, either by choice or because they do not inform school authorities before leaving one school and taking admission in another.66 Training of enumerators: Enumerators of household surveys may not have detailed knowledge about issues related to schooling and school attendance, and may add to errors in the data. So training is very important, especially for enumerators who are not experienced to conduct education surveys.
NSSO and other household survey data show a sharp increase in the proportion of out-of-school on completion of 14 years of age. States like Rajasthan have assigned an identity number to each child when he or she enrols in class 1. Any child who seeks admission to
65
66
any school in a higher grade has to refer to this identity number. This process has helped the state identify cases of double enrolments. Other states have also made efforts to reduce double enrolments.
58
Indian case study
A data verification system should be in place: Since the data collection process requires interaction between different sets of people, there are potential biases of over- and under-estimation. Survey tools should incorporate checks and balances to minimize these biases. A reliable data verification system will go a long way in improving data quality. Where teachers have to collect data (U-DISE) a re-survey of a small percentage of schools is important to ensure data quality. Though U-DISE has a provision of conducting a 5 per cent check but it is not standardized and not verified with the school register and school data recording registers in schools. Training to identify children with special needs: Special efforts are required to collect information on children with special needs in both school and household surveys. While many schemes are in a position to ensure inclusive education, not all children with special needs have been identified. Anganwadi workers (AWWs), (women who work under the Ministry of Women and Child Development and who are responsible for providing health and educational support to children under 6 years) are already trained to do so. So during community mapping such as SSA household surveys to identify outof-school children, AWWs could be asked to train those responsible for the survey or to accompany them during house visits. Multiple strategies for identifying out-of-school children among vulnerable population groups: Neither the administrative datasets nor the household surveys are able to collect information on out-of-school children from vulnerable population groups. Estimating out-of-school children among migrant populations is also difficult. At the time of a survey, the children may be in the village and enrolled in school, but they may be out-of-school at a later period. Or at the time of the survey, they may have migrated with their families, their houses may be locked and no information about them can be collected. Close monitoring of children from these families may be necessary. Similar strategies may be necessary for identifying out-of-school working children, particularly those involved in seasonal or part time work. Census data is based on complete enumeration and is most likely to have data on these vulnerable groups. This could be used to estimate the proportion of out-of-school children in these population groups. Survey data also needs to be supplemented by in-depth surveys focused on these population groups.
59
6. Annexures
Estimating the Number of Out-of-School Children
Annex 1: Education structure in different states in India School structure
State/union territory
Primary
Classes 1-5
Andaman and Nicobar Island, Andhra Pradesh, Arunachal Pradesh,
Upper Primary
Classes 6-8
Bihar, Chandigarh, Chhattisgarh, Daman and Diu, Delhi, Haryana, Himachal Pradesh, Jammu and Kashmir, Jharkhand, Madhya Pradesh, Manipur, Meghalaya, Nagaland, Puducherry, Punjab, Rajasthan, Sikkim, Tamil Nadu, Tripura, Uttar Pradesh, Uttarakhand
Primary
Classes 1-5
Upper Primary
Classes 6-7
Primary
Classes 1-4
Upper Primary
Classes 5-8
Primary
Classes 1-4
Upper Primary
Classes 5-7
Karnataka, Odisha Dadra and Nagar Haveli, Lakshadweep, Mizoram, West Bengal Assam, Goa, Gujarat, Kerala, Maharashtra
Annex 2: Minimum admission age at class 1 in different states in India Age (years)
State/union territory
5
Andaman and Nicobar Islands, Andhra Pradesh, Arunachal Pradesh, Chhattisgarh, Dadra and Nagar Haveli, Daman and Diu, Delhi, Gujarat, Haryana, Jharkhand, Kerala, Puducherry, Rajasthan, Uttar Pradesh, Uttarakhand, West Bengal
5+
Assam, Chandigarh, Goa, Himachal Pradesh, Jammu and Kashmir, Karnataka, Madhya Pradesh, Manipur, Odisha, Tamil Nadu
6
Lakshadweep, Maharashtra, Meghalaya, Mizoram, Nagaland, Punjab, Sikkim
6+
Bihar, Tripura
62
Indian case study
Andaman & Nicobar April to March Islands
October
September
August
July
June
May
April
March
February
January
December
November
October
September*
August
July
June
May
April
March
February
January
School session Months
States
Annex 3: School session in different states in India67
Andhra Pradesh
June to April
Arunachal Pradesh
July to April
Assam
January to December
Bihar
April to March
Chandigarh
April to March
Chhattisgarh
June to April
Dadra & Nagar Haveli June to April
Daman &Diu
June to May
Delhi
April to March
Goa
June to April
Gujarat
June to May
Haryana
April to March
Himachal Pradesh
April to March
Jammu & Kashmir68
November to October
Jharkhand
April to June
Karnataka
May to April
Kerala
June to March
Lakshadweep
April to March
Madhya Pradesh
July to April
Maharashtra
June to May
Manipur
February to January
Meghalaya
February to January
Mizoram
January to December
Nagaland
January to December
Odisha
April to March
Puducherry
June to April
Punjab
April to March
Rajasthan
July to June
Sikkim
February to December
Tamil Nadu
June to April
Tripura
January to December
Uttar Pradesh
July to June
Uttarakhand
April to March
West Bengal
February to December
Note: *September is the reference period of data collection for U-DISE.
If the summer holiday starts at the end or beginning of the school session it is not counted. September data for Jammu and Kashmir pertains to last year school session
67
68
63
Estimating the Number of Out-of-School Children
Bibliography ASER (relevant years), Annual Status of Education Report (Rural), available at: http://img.asercentre. org/docs/Publications All India Education Survey (various years), NCERT, available at: http://aises.nic.in/ nspublicreportshome Aggarwal, Yash (2003), Revitalisation of Educational statistics in India- Issues and Strategies, available at: www.dise.in/reports&studies.htm Colclough, Christopher and Anuradha De (2010), ‘The impact of aid on Education Policy of India’, International Journal of Education Development 30 (5). Mehta, Arun (2003), available at: http://www.educationforallinindia.com/ Newper cent20Modules/ Enrolmentper cent20Ratioper cent20toper cent20Attendanceper cent20Rate.pdf National Family Health Survey (various rounds), available at: http://rchiips.org/nfhs NSSO, National Sample Survey Organization, ‘India - Employment, Unemployment and Migration Survey’, (July 2007 - June 2008), NSS 64th Round; “India - Social Consumption: Education”, NSS 71st Round: January - June 2014. Selected Information on School Education (2011-12), Ministry of Human Resource Development, available at: http://mhrd.gov.in/sites/upload_files/mhrd/files/statist. Selected Educational Statistics (various years), Ministry of Human Resource Development, available at: http://www.educationforallinindia.com/ SRI-IMRB (various years), ‘National Sample Survey of Estimation of Out-of-School Children in the Age 6-13 in India’ (2014); ‘National Sample Survey of Estimation of Out-of-School Children in the Age 6-13 in India’ (2009); ‘National Sample Survey of Estimation of Out-of-School Children in the Age 6-13 in India’ (2005) UNICEF and UIS (2014), Global Initiative on Out-of-School Children: A Situational Study of India. Unified District Information System for Education (2014), available at: http://dise.in/ TrendsElementaryEducation.htm United Nations Population Division (2015), World Population Prospect 2015, available at: http://esa. un.org/unpd/wpp/ UNESCO. (2010). EFA Global Monitoring Report -Reaching the Marginalized. Paris: UNESCO.
64
Indian case study
UNICEF and UIS (2014). Global Initiative on Out-of-School Children: A Situational Study of India. UNICEF and UIS (2016). Monitoring Education Participation: Framework for Monitoring Children and Adolescents who are Out-of-school or At Risk of Dropping Out. Geneva: UNICEF. http://www.ncaer.org/data_details.php?dID=11 http://www.opepa.in/website/download/child-tracking-system-cts.pdf http://dise.in/Downloads/Useper cent20ofper cent20Diseper cent20Data/Sampleper cent20Districtper cent20Elementary Tamil Nadu 2005 July http://dise.in/Downloads/FAQs 2015-16.pdf http://dise.in/downloads/trends-Elementary-Education-2014-15/All India.pdf http://mospi.nic.in/Mospi_New/upload/nsso/design_est_64.pdf http://mospi.nic.in/Mospi_New/upload/nss_71st_ki_education_30june15.pdf http://ssa.nic.in/pabminutes-documents/NS.pdf http://www.educationforallinindia.com/aii_india_survey_of_out_of-school_cghildren_2010.pdf http://mospi.nic.in/Mospi_New/upload/nss_71st_ki_education_30june15.pdf http://mhrd.gov.in/population-projection-6-23-years-age-group-
65
UNESCO
INSTITUTE for
STATISTICS