Understanding Church Size Based on Empirical Data Bill M. Sullivan
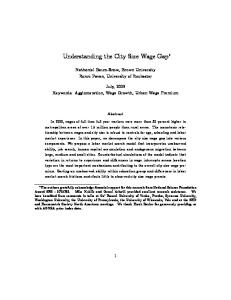
One of the most remarkable graphs I have ever seen was developed by ANSR’s own Rich Houseal. While he was serving as president of ASARB he was able to acquire, from five other denominational statisticians, the church attendance data for their respective churches. Attendance data has only been collected in recent years and has not been readily available. Of course, actual report data is more desirable than survey data. It may not be 100% accurate but it is generally consistent and reliable. Most denominations have standard reporting procedures which over time have produced an acceptable level of reliability. Houseal’s Church Attendance Graph (The CAG, see p. 2) plots the percentage of churches, in a particular attendance size range, in increments of 25. There is a full set of graphs which also plot membership and other data, but it is the church attendance graph (The CAG) that is most significant for our present consideration. Two realities are immediately obvious; first the graphs are very similar for all six denominations and second, most churches are small in all six denominations. We will return later to the observation that most churches are small but, for the moment, let us ask what accounts for the remarkable similarity of graphs showing the distribution of churches according to attendance size. Such similarity is not what we would expect. There is just too much theological and sociological variation in the six denominations to think that variety would not have a significant impact on organizational factors such as church size. Think of the variation in the six reporting denominations. Theologically they run the gamut from Reformed to Arminian; from Liberal to Conservative, from Evangelical to Charismatic; and from Holiness to Libertarian. Sociologically, the denominations vary significantly in economic and education levels; there are great differences in organizational age and there are vast differences in the public visibility of the several denominations. Yet, the graph appears to indicate that none of this theological or sociological dissimilarity impacts church size.
2 Is Church Size a Factor of the General Population? The CAG leads us to wonder if group size is in the nature of general population characteristics. Group size may not be determined by the uniqueness of particular groups but by the characteristics, values and preferences The Church Attendance Graph (CAG)1 Comparison of Church Worship Attn. Sizes by Denomination: USA 2000 30.0%
25.0%
% of Churches
20.0%
AoG ELCA LCMS Naz. PC(USA) SBC
15.0%
10.0%
5.0%
951 to 975
901 to 925
851 to 875
801 to 825
751 to 775
701 to 725
More than 1,000
Worship Attn. Size
651 to 675
601 to 625
551 to 575
501 to 525
451 to 475
401 to 425
351 to 375
301 to 325
251 to 275
201 to 225
151 to 175
101 to 125
51 to 75
1 to 25
0.0%
of the general population. It would seem the factors that determine church size are actually factors in the general population rather than in group uniqueness. If this is true it raises several questions. First of all, why is this true? The answer is obvious, church organizations are much more like secular organizations than has been imagined. Because of the vast differences between the sacred and the secular it has been generally assumed they represent different realms with unique characteristics and operational ideologies. This may be an inaccurate assumption. There is no question that the purpose and objectives of the secular and sacred realms differ significantly, but the people who seek those ends are typical human beings who relate to each other in very similar ways, whether the organizations are sacred or secular.
3 Human beings appear to prefer face-to-face relationships, and it seems logical to assume this is true for both religious and non-religious persons. This preference develops out of the associations in which people engage in the process of living their lives in particular settings. Charles Horton Cooley discusses this in connection with Primary Groups.2 Even a cursory consideration of group theory is beyond the scope of this paper so we will need to depend on a few popularily held conclusions. In The Tipping Point, Malcolm Gladwell refers to “a concept in cognitive psychology called channel capacity, which refers to the amount of space in our brain for certain kinds of information.”3 It turns out there are six or seven channels in the human brain. This is the reason telephone numbers have seven digits. Gladwell notes that this is intellectual capacity but he believes it applies to feelings as well. Appealing to studies regarding sympathy groups, meaning people whose death would leave you truly devastated, he concludes “at somewhere between 10 and 15 people, we begin to overload.”4 Interestingly, this turns out to resemble the size of Primary Groups. While a numerical size is not typically set for Primary Groups they are generally acknowledged to be small; as someone has observed, “not all small groups are primary but all primary groups are small.” When a Primary Group is at the heart of a small church, the additional persons related to those in the Primary Group, such as children and occasional attendees, the group may reach 25 to 50 in total attendance. If this conjecture has any validity then Primary Groups could account for the preponderance of small churches in this size category in the denominations listed in The CAG. A similar phenomenon is described by Charles Crow in a 1997 ANSR paper. In stead of comparing small churches to Primary Groups he compares them to Family Owned Businesses.5 In either case the numerical size turns out to be comparable. The Family Owned Business may actually be a better analogy since its organizational dynamics are more easily understood in American culture than Primary Group theory. Whenever people create new groups they tend to adopt an informal structure similar to what they have already experienced. When new churches are formed, church members tend to adopt a relational approach to their association. They do not develop an organizational structure based on theological commitments but they tend to drift into structures determined by sociological realities. This tendency to
4 form organizational structure from characteristics of the general population rather than from a group’s uniqueness and ideological distinctives may by why the attendance size distributions in the various denominations are so similar. While the two church size categories under 50 comprise approximately 40% of the churches, they contain only about 11% of the attendees. This may indicate that the general population (and human nature) actually prefers larger groups/churches. But the existence of a preference for larger groups does not necessarily diminish the tendency toward smallness of the Primary Group/ Family Owned Business. While the people in a group might prefer for the group to be larger in size they may not have the organizational insight or the leadership capability to escape from the Primary Group/Family Owned Business relationships. As groups are able to increase in numerical size they still face relational obstacles to continued expansion. Again, Malcolm Gladwell, drawing on the research of British Anthropologist Robin Dunbar, makes a case for the “Rule of 150.”6 The channel capacity of human beings, and its extension to social channel capacity, limits the number of social relationship that are a practical possibility to 147.8—or roughly 150.7 The Rule of 150 has been recognized as useful to a variety of groups including religious sects, businesses, and the military. 150 appears to be the practical size limit of relational based groups/churches. Beyond this point, people simply are unable to maintain expected and satisfying relational connection. This will be significant later when we look at the 200 Barrier. It will help explain why this barrier exists even though there is no indication of its reality in The CAG. Are Denominations a Cross Section of the General Population? If general population characteristics, values and preferences determine the size of churches, and the size distribution graphs are essentially the same for all of the denominations in the study, then does it not follow that denominations are cross sections of the general population? That seems to be a logical conclusion, except we know the various denominations vary significantly in economic and education levels; and there are probably other sociological differences as well. It may be the real determinant of group size is certain characteristics, values, and preferences in human nature rather than in the general population. This perspective would put the focus more on particular factors within the general population rather than on the general population itself.
5 For example, categorizing the general population according to certain economic or educational brackets would obviously exclude some people, but probably no one would be excluded from the category of a preference for face-to-face relationships, or other similar characteristics of human nature. So, it is probably true that church size is determined more by human nature characteristics than by distinctives of the denomination. Again, denominational structures and theological commitments are not the determinants of church size. Church Size and Complexity In order for organizations, including churches, to grow larger certain realities must be faced. Sociologist Georg Simmel’s discussion of the impact of size, in terms of absolute numbers, on groups, is based on the fundamental problem of complexity. He states, “A very large number of people can constitute a unit only if there is a complex division of labor.”8 This is a key insight into the determination of church size, especially growth to a larger size. It basically states that in order for a small group to increase its size, the people must change the nature of their affiliation from small, informal group relationships to a complex division of labor type of organizational connectedness. Gary McIntosh has written the definitive work on church size in his book, One Size Doesn’t Fit All, and he traces the increasing complexity of a church as it grows through small, medium, and large size categories. In the book, McIntosh’s typology of Church Sizes reveals how eleven (11) separate factors are managed in the three basic size categories.9 His approach, and others like Kevin Martin in The Myth Of The 200 Barrier,10 is based on a comprehensive overview of church size. McIntosh draws from his extensive experience as a Church Growth consultant, as well as his academic studies and years of teaching. The complexity that churches encounter as they grow larger is seldom, if ever, related to their theology or denominational policy. It is simply the complexity that any organization faces as it increase in size. Churches that grow large do so because they adhere to the rules of large organizations. The Church: A Spiritual Community and a Human Organization One of the values of The CAG is it forces the church to face its human nature. Christians are prone to think of themselves as different from non-Christians. While Christians may hold different values and have experienced a spiritual
6 transformation, they are still human beings possessed of the characteristics of human nature. Members of the Church of the Nazarene have thought of themselves as significantly different from “the world.” And those who grew up in the church prior to 1960 would probably insist that Nazarenes were indeed different from the dominant culture. Even then, and certainly now, Nazarenes were a lot more like their secular counter-parts than they thought. The denial of the human by the church fosters an unfortunate misunderstanding of the nature of the church. Just as some in New Testament times wanted Christ to be divine but not human, so there is the inclination today to describe the church in terms of a spiritual community but not a human organization. The early church finally declared that Christ was both fully divine and fully human. Today it is just as important to face the fact that the church is both a spiritual community and a human organization. A Corollary: Leadership A corollary concept about the impact of characteristics of the general population on group size could be proposed. Since it is generally agreed that group size is determined by the leadership capability of a particular group’s leader, then group size may simply be a reflection of the level of leadership capability available in the general population. Predicting who will be a leader is an imperfect science. Even though innumerable studies about leaders have been conducted and extensive courses and seminars on leadership are readily available, predicting who will actually turn out to be an effective and successful leader is very difficult. This unpredictability is one of the conundrums regarding leaders. Leaders tend to emerge out of situations. They are just “out there” in the general population; once identified they can be fast tracked in a variety of training programs which enables them to improve their natural abilities. Unfortunately, while this happens in business and industry it seldom occurs in religious organizations. There are, of course, reasons for this. Ministry leadership is more than a career. It is a calling from God and who is to say who God has chosen or should choose. Most church members believe leadership is the key to numerical church growth but they have to look for potential leaders within the context of their denomination rather than the general population. Yet, very effective lay leaders often emerge into
7 the church from the general population and display exceptional leadership capability. Recent discussion of the impact of Choice Points on church size questions placing responsibility for numerical growth solely on leadership capability. Kenneth Crow has suggested that congregations make decisions at certain points in their history that have a controlling effect on the growth of the church.11 This view does not question the importance of leadership but provides an additional perspective on factors that determine the size of a congregation. Making human nature and leadership capability responsible for church size may be pressing the point too far but there seems to be considerable logic for such a position. Sociological Determinism So, is church size the inescapable result of a kind of sociological determinism? Will approximately 10% of all churches average fewer than 25 in attendance, approximately 20% between 25 and 50, approximately 15% between 50 and 75, and approximately 10% between 75 and 100, etc? Will factors in human nature always trump education, training, planning, strategizing, mentoring, coaching and individual initiative? The CAG suggests an affirmative response because it includes so many local churches from several dissimilar denominations. However, what the graph does not show is the specific human nature factors involved and the complex array in which they may be combined. So, while the result of any particular combination may appear to follow a deterministic pattern, the way those factors are brought together may be individualistic and intentional. What this suggests is that while the percentage of churches of a particular size may typically follow human nature factors in the general population, any individual group may have some control over the size their church becomes based on the human nature factors they bring together. The Small Church The CAG makes it clear that not only are there a large number of small churches but no one denomination has a significantly larger percentage of small churches than the others. Many have spoken of the church of the Nazarene as a
8 denomination of small churches but that is not true in comparison to the other five denominations and probably not with any other denomination as well. Again this simply highlights the fact that church size is determined by human nature factors rather than denominational characteristics. 50—The Common Barrier In addition to accepting the fact that there are large numbers of small churches in all of the denominations, it is difficult to over look the sharp peak in The CAG in the 25-50 church size range. Approximately 40% of the churches are under 50 in attendance. This strongly suggests there is a 50 numerical barrier. Interestingly, this is the only point on the graph where a numerical barrier can be hypothesized. Generally, there isn’t much interest in a 50 Barrier. Churches under 50 just don’t have much appeal or economic clout. Some people believe churches that small shouldn’t be allowed to exist. But they are 40% of the churches, and while they only account for 11% of the attendees they help distribute the church over wide geographical areas. This study is about size and is not focused on the problems and challenges churches of a particular size face. Even so, appropriate agencies need to give greater attention to the under 50 segment of the church constituency. House churches, emerging churches and the plethora of small groups may, in the future, become a significant force in the entire church size phenomenon. 200—The Change Barrier It is not possible to find any numerical indication of a 200 Barrier in The CAG. Actually, this does no damage to the idea of a 200 Barrier. Very few of the people who have seriously studied the 200 Barrier have thought of it primarily in numerical terms. Even as early as 1988 when Ten Steps To Breaking The 200 Barrier was published, the barrier was marked out as a numerical range beginning as low as 100 and reaching as high 300.12 But the definition of the barrier described the conditions that existed in the church while it was in that size frame. The 200 Barrier is a moniker for the numerical range where it becomes necessary for the basic nature of the organization to change in order for it to increase to a larger size. This change is the primary feature of the 200 Barrier. While the numerical range is more than just incidental, the numbers are secondary to the relational and organizational changes that must be made.
9 The 200 Barrier remains the most difficult growth barrier to overcome. Less than 10% of all churches average more than 350 in attendance. Any growth range that stymies more than 90% of all churches should be treated as a formidable barrier to numerical growth. Various Size Ranges—The Complexity Barrier Pastors of large churches are insistent that there are barriers all along the growth scale. Yet, there is no indication in The CAG of numerical barriers along the way. A few barriers have been put forward but have not gained much serious consideration. It has not been possible to pin down the characteristics of any of these other barriers which pastors describe. In keeping with Simmel’s observation regarding organizational complexity it is probably best to view the Complexity Barrier as occurring at any point along the growth path that a church encounters difficulty in dealing with complexity. Sometimes the complexity may involve staffing, at other times facilities may be the challenge. Community demographics may be the hurdle for certain congregations, and the age of the church and many of its leaders may constitute the complexity in another situation. These are just a few of the many possible challenges of complexity that a church may face as it grows larger. Complexity can occur at any numerical point along the growth corridor. It all depends on the circumstances of the particular church. That does not make it any less of a growth barrier; but, the Complexity Barrier is not as numerically specific as the 50 and 200 Barriers. Conclusion Trying to understand church size, even when based on empirical data, is not an easy task. There is so much variety in human personality that lessens efforts to understand why churches settle into a particular size category. Many assumptions circulate among people generally that are misleading about church size. Unfortunately, attitudes toward size, especially the size of small churches, are often negative and unfavorable toward starting new churches which are so essential to overall growth of the kingdom of God on earth. We are entering an era when understanding the significance of small churches may be essential to our future effectiveness as a mission entity of the Kingdom of God.
10 While there is still much to be learned about church size, The CAG enables us to make a few observations with some sense of certitude. 1. Church size appears to be determined by human nature rather than by denominational characteristics. 2. Church size may be a reflection of the level of leadership capability available in the general population. 3. It seems difficult to deny that there is a 50 Barrier. These factors surely have implications for further study. They also need to be seriously considered by denominational leaders in the development of evangelistic strategy. Hopefully, these observations will provide some insight that will contribute to the ongoing growth of God’s Kingdom. Endnotes: 1
Houseal, Rich. The Church Attendance Graph. Kansas City: Nazarene Research Center. 2002. Cooley, Charles Horton. Social Organization: A Study of the Larger Mind. New York: Charles Scribner's Sons. 1909, pp. 25-31. 3 Gladwell, Malcolm. The Tipping Point. Boston: Little, Brown and Company. 2000, p. 175. 4 Ibid, p. 177. 5 Crow, Charles. Enduring Cultures of Laity. 1997 ANSR paper. 6 Gladwell, op. cit., p. 175. 7 Ibid, p. 179. 8 Wolff, Kurt H. The Sociology of Georg Simmel. New York: The Free Press. 1950, p. 88 9 McIntosh, Gary L. One Size Doesn’t Fit All. Grand Rapids: Fleming H. Revell. 1999, pp. 143-144. 10 Martin, Kevin E. The Myth Of The 200 Barrier. Nashville: Abingdon Press. 2005. 11 Crow, Kenneth E. What Are Choice Points? Unpublished paper, 2004, p. 1. 12 Sullivan, Bill M. Ten Steps To Breaking The 200 Barrier. Kansas City: Beacon Hill Press. 1988, p. 14. 2