World Bank & Government of The Netherlands funded
Training module # WQ - 15
Understanding biochemical oxygen demand test
New Delhi, May 1999 CSMRS Building, 4th Floor, Olof Palme Marg, Hauz Khas, New Delhi – 11 00 16 India Tel: 68 61 681 / 84 Fax: (+ 91 11) 68 61 685 E-Mail:
[email protected]
DHV Consultants BV & DELFT HYDRAULICS with HALCROW, TAHAL, CES, ORG & JPS
Table of contents Page
Hydrology Project Training Module
1
Module context
2
2
Module profile
3
3
Session plan
4
4
Overhead/flipchart master
5
5
Evaluation sheets
21
6
Handout
23
7
Additional handout
28
8
Main text
30
File: “ 15 Understanding BOD test.doc”
Version 05/11/02 Page 1
1. Module context This module deals with significance and understanding of biochemical oxygen demand measurement. Modules in which prior training is required to complete this module successfully and other available, related modules in this category are listed in the table below. While designing a training course, the relationship between this module and the others, would be maintained by keeping them close together in the syllabus and place them in a logical sequence. The actual selection of the topics and the depth of training would, of course, depend on the training needs of the participants, i.e. their knowledge level and skills performance upon the start of the course. No. 1
Module title Basic water quality concepts
Code WQ - 01
• •
2
Basic chemistry concepts
WQ - 02
• • •
3
How to prepare standard WQ - 04 solutions a
• • •
4
5 6
7
Understanding the chemistry WQ - 11 of dissolved oxygen measurementa
•
How to measure dissolved WQ - 12 oxygen (DO)a Understanding dilution and WQ - 16 seeding procedures in BOD test
•
Understanding chemical WQ - 18 oxygen demand test
•
•
•
•
Objectives Become familiar with common water quality parameters. Appreciate important water quality issues. Convert units from one to another Understand the basic concepts of quantitative chemistry Report analytical results with the correct number of significant digits Recognise different types of glassware Use an analytical balance and maintain it. Prepare standard solutions Appreciate significance of DO measurement Understand the chemistry of DO measurement by Winkler method Measure dissolved oxygen in water samples Understand the need and procedure for dilution and seeding in BOD measurement Appreciate significance of COD measurement Understand the chemistry of COD measurement
a – prerequisite
Hydrology Project Training Module
File: “ 15 Understanding BOD test.doc”
Version 05/11/02 Page 2
2. Module profile Title
:
Understanding biochemical oxygen demand test
Target group
:
HIS function(s): Q1, Q2, Q3, Q5
Duration
:
1 session of 75 min
Objectives
:
After the training the participants will be able to: Understand the significance and theory of BOD measurement
•
Key concepts
:
• • •
Training methods
:
Lecture, exercises and open discussion
Training tools required
:
OHS
Handouts
:
As provided in this module
Further reading : and references
• •
Hydrology Project Training Module
Significance BIS procedure BOD progression
Analytical Chemistry: An introduction, D.A. Skoog and D. M. West/1986. Saunders College Publishing Chemistry for Environmental Engineering, C.N. Sawyer, P.L. McCarty and C.F. Parkin. McGraw-Hill, 1994
File: “ 15 Understanding BOD test.doc”
Version 05/11/02 Page 3
3. Session plan No 1 2
3
4
5
6 7
8
Activities
Time
Preparations Introduction: Ask participants to name some biochemical reactions • Emphasise the role of the living agency • Describe the content of the lecture • Discuss significance of BOD test •
Tools
15 min OHS
15 min
BOD progression Describe BOD progression curve • Explain how it can be measured •
OHS OHS
5 min BIS procedure Explain the difference between the standard and BIS • procedures
OHS
5 min Relation to other parameters Explain the difference and relation between BOD and • other parameters
OHS
Errors and interferences Discuss the need for standardisation of the procedure •
10 min
BOD progression formulae Explain first order reaction • Explain calculation procedure • approach and exponential function
20 min OHS using
simplified
Conclusion Recapitulate significance of the test •
Hydrology Project Training Module
OHS
File: “ 15 Understanding BOD test.doc”
5 min
Version 05/11/02 Page 4
4. Overhead/flipchart master OHS format guidelines
Type of text
Style
Setting
Headings:
OHS-Title
Arial 30-36, with bottom border line (not: underline)
Text:
OHS-lev1 OHS-lev2
Arial 24-26, maximum two levels
Case:
Sentence case. Avoid full text in UPPERCASE.
Italics:
Use occasionally and in a consistent way
Listings:
OHS-lev1 OHS-lev1-Numbered
Colours: Formulas/Equat ions
Big bullets. Numbers for definite series of steps. Avoid roman numbers and letters. None, as these get lost in photocopying and some colours do not reproduce at all.
OHS-Equation
Hydrology Project Training Module
Use of a table will ease horizontal alignment over more lines (columns) Use equation editor for advanced formatting only
File: “ 15 Understanding BOD test.doc”
Version 05/11/02 Page 5
Biochemical Oxygen Demand 1. 2. 3. 4. 5.
Significance BIS procedure Relation to other parameters Errors & interferences BOD equation
Hydrology Project Training Module
File: “ 15 Understanding BOD test.doc”
Version 05/11/02 Page 6
Significance • Biochemical reaction • Measures oxygen equivalence of aggregate organic matter micro-organisms Organic matter + O2 ⇒ H2O + CO2 • Measures water pollution potential • Depletion of DO adversely affects aquatic ecology
Hydrology Project Training Module
File: “ 15 Understanding BOD test.doc”
Version 05/11/02 Page 7
9
Ultimate BOD 8
Sample 1 7
BOD (mgO2/L)
6
5
Sample 2 4
3
2
1
0 0
5
10
Time (days)
Oxygen uptake curves
Hydrology Project Training Module
File: “ 15 Understanding BOD test.doc”
Version 05/11/02 Page 8
15
BOD progression • reaction requires time • nearly 20 days to exert ultimate BOD • rate depends on: − organic matter, − micro-organisms − temperature
• faster at the beginning, then slows down • only bio-degradable organic matter is oxidised
Hydrology Project Training Module
File: “ 15 Understanding BOD test.doc”
Version 05/11/02 Page 9
BOD progression: example Day 20oC
27oC
DO,mg/L Consumed DO,mg/L Consumed 0
8.0
0
8.0
0
1
6.4
1.6
5.6
2.4
2
5.1
2.9
3.9
4.1
3
4.1
3.9
2.7
5.3
4
3.3
4.7
1.9
6.1
5
2.6
5.4
1.3
6.7
Hydrology Project Training Module
File: “ 15 Understanding BOD test.doc”
Version 05/11/02Page 10
BIS procedure • Standard methods: 5 day, 20oC • BIS: 3 day, 27oC • Incubation temperature of 27oC is easier to maintain • Result available earlier
Hydrology Project Training Module
File: “ 15 Understanding BOD test.doc”
Version 05/11/02Page 11
Other parameters for organic matter (1) • Chemical oxygen demand, COD − organic matter is oxidised chemically
• Total organic carbon, TOC − organic matter is combusted
• Measure both biodegradable & non-biodegradable organic matter • Reaction is completed in a few hours
Hydrology Project Training Module
File: “ 15 Understanding BOD test.doc”
Version 05/11/02Page 12
Other parameters for organic matter (2) • BOD measures pollution potential of decomposable organic matter • COD is always greater than BOD • TOC does not measure oxygen equivalence • Both COD & TOC can be related to BOD
Hydrology Project Training Module
File: “ 15 Understanding BOD test.doc”
Version 05/11/02Page 13
Errors & interferences (1) • Organic matter is continually oxidised − Preserve by cooling
• Extreme pH values − adjust between pH 6.5 & 7.5
• Toxic substances − remove by chemical reaction if possible − provide acclimated seed
Hydrology Project Training Module
File: “ 15 Understanding BOD test.doc”
Version 05/11/02Page 14
Errors & interferences (2) • Presence of algae − remove excess oxygen − incubate in dark
• Nitrifying bacteria − NH4+ + 2O2 ⇒ NO3- + H2O + 2H+ − if measuring only carbonaceous demand add inhibitory chemical
Hydrology Project Training Module
File: “ 15 Understanding BOD test.doc”
Version 05/11/02Page 15
BOD progression formula (1) • First order reaction • Oxygen demand exerted each day is a constant fraction of the demand remaining • Example: − Calculate BOD exerted in 1,2, & 3 days, − if 25% of remaining BOD is oxidised each day. − The ultimate BOD is 256 mg/L
Hydrology Project Training Module
File: “ 15 Understanding BOD test.doc”
Version 05/11/02Page 16
Example (contd) Time, BOD exerted day each day
Cumulative BOD exerted
BOD remaining
0
0
0
256
1
0.25x256 = 64 0+64 = 64
256-64 = 192
2
0.25x192 = 48 64+48 = 112
256-112 = 144
3
0.25x112 = 36 112+36 = 148 256-148 = 108
Hydrology Project Training Module
File: “ 15 Understanding BOD test.doc”
Version 05/11/02Page 17
BOD Equation yt = Lo (1- e -kt) yt = cumulative oxygen demand exerted in time t days, mg/l Lo= ultimate BOD, mg/L k = BOD rate constant, per day
Hydrology Project Training Module
File: “ 15 Understanding BOD test.doc”
Version 05/11/02Page 18
BOD rate constant • characteristics of waste • microbial population • temperature k1 = k2 1.047(T1-T2) − k1 & k2 are rate constants at temperatures T1 & T2, respectively
Hydrology Project Training Module
File: “ 15 Understanding BOD test.doc”
Version 05/11/02Page 19
BOD progression
Oxygen consumed, mg/L
10 9 8 7 6 5 4 3 2 1 0
o
k,27 C = 0.3/d o
k,20 C 0.22/d
0
Hydrology Project Training Module
1
File: “ 15 Understanding BOD test.doc”
2
3 Time, days
Version 05/11/02Page 20
4
5
6
5. Evaluation sheets
Hydrology Project Training Module
File: “ 15 Understanding BOD test.doc”
Version 05/11/02Page 21
Hydrology Project Training Module
File: “ 15 Understanding BOD test.doc”
Version 05/11/02Page 22
6. Handout
Hydrology Project Training Module
File: “ 15 Understanding BOD test.doc”
Version 05/11/02Page 23
Biochemical Oxygen Demand 1. 2. 3. 4. 5.
Significance BIS procedure Relation to other parameters Errors & interferences BOD equation
Significance • •
Biochemical reaction Measures oxygen equivalence of aggregate organic matter micro-organisms Organic matter + O2 ⇒ H2O + CO2
• •
Measures water pollution potential Depletion of DO adversely affects aquatic ecology
BOD progression • • •
• •
reaction requires time nearly 20 days to exert ultimate BOD rate depends on: − organic matter, − micro-organisms − temperature faster at the beginning, then slows down only bio-degradable organic matter is oxidised
BOD progression: example Day
20oC DO,mg/L
27oC Consumed
DO,mg/L
Consumed
0
8.0
0
8.0
0
1
6.4
1.6
5.6
2.4
2
5.1
2.9
3.9
4.1
3
4.1
3.9
2.7
5.3
4
3.3
4.7
1.9
6.1
5
2.6
5.4
1.3
6.7
Hydrology Project Training Module
File: “ 15 Understanding BOD test.doc”
Version 05/11/02Page 24
BIS procedure • • • •
Standard methods: 5 day, 20oC BIS: 3 day, 27oC Incubation temperature of 27oC is easier to maintain Result available earlier
Other parameters for organic matter (1) • • • •
Chemical oxygen demand, COD − organic matter is oxidised chemically Total organic carbon, TOC − organic matter is combusted Measure both biodegradable & non-biodegradable organic matter Reaction is completed in a few hours
Other parameters for organic matter (2) • • • •
BOD measures pollution potential of decomposable organic matter COD is always greater than BOD TOC does not measure oxygen equivalence Both COD & TOC can be related to BOD
Errors & interferences (1) • • •
Organic matter is continually oxidised − Preserve by cooling Extreme pH values − adjust between pH 6.5 & 7.5 Toxic substances − remove by chemical reaction if possible − provide acclimated seed
Errors & interferences (2) •
•
Presence of algae − remove excess oxygen − incubate in dark Nitrifying bacteria − NH4+ + 2O2 ⇒ NO3- + H2O + 2H+ − if measuring only carbonaceous demand add inhibitory chemical
Hydrology Project Training Module
File: “ 15 Understanding BOD test.doc”
Version 05/11/02Page 25
BOD progression formula (1) First order reaction Oxygen demand exerted each day is a constant fraction of the demand remaining
• • •
Example:
− − −
Calculate BOD exerted in 1,2, & 3 days, if 25% of remaining BOD is oxidised each day. The ultimate BOD is 256 mg/L
Example (contd) Time, day BOD exerted each day
Cumulative BOD exerted BOD remaining
0 1 2
0 0.25x256 = 64 0.25x192 = 48
0 0+64 = 64 64+48 = 112
256 256-64 = 192 256-112 = 144
3
0.25x112 = 36
112+36 = 148
256-148 = 108
BOD Equation yt = Lo (1- e -kt) yt = cumulative oxygen demand exerted in time t days, mg/l Lo= ultimate BOD, mg/L k = BOD rate constant, per day
BOD rate constant • • •
characteristics of waste microbial population temperature
k1 = k2 1.047(T1-T2) k1 & k2 are rate constants at temperatures T1 & T2, respectively
Hydrology Project Training Module
File: “ 15 Understanding BOD test.doc”
Version 05/11/02Page 26
Add copy of Main text in chapter 8, for all participants. .
Hydrology Project Training Module
File: “ 15 Understanding BOD test.doc”
Version 05/11/02Page 27
7. Additional handout These handouts are distributed during delivery and contain test questions, answers to questions, special worksheets, optional information, and other matters you would not like to be seen in the regular handouts. It is a good practice to pre-punch these additional handouts, so the participants can easily insert them in the main handout folder.
Hydrology Project Training Module
File: “ 15 Understanding BOD test.doc”
Version 05/11/02Page 28
Hydrology Project Training Module
File: “ 15 Understanding BOD test.doc”
Version 05/11/02Page 29
8. Main text Contents
Hydrology Project Training Module
1.
Introduction
1
2.
The BOD Test
1
3.
Factors Affecting the Oxygen Demand Rate 3
4.
Relationship of BOD to Other Water Quality Parameters
4
5.
Sample Handling
4
6.
Interferences
4
7.
BOD Progression Equation
5
8.
Problems
7
File: “ 15 Understanding BOD test.doc”
Version 05/11/02Page 30
Understanding biochemical oxygen demand test 1. Introduction The biochemical oxygen demand (BOD) test is an experimentally derived analytical method designed to give an indication of the polluting nature of organic matter in a sample of water. It measures aggregate organic matter. How this is achieved is described below. When organic polluting matter is discharged to the aquatic environment it will normally degrade through the action of micro-organisms in the watercourse. In degrading the organic matter, micro-organisms take up atmospheric oxygen which is dissolved in the water. Such an uptake of dissolved oxygen (called an ‘oxygen demand’) can, if sufficient oxygen is lost, lead to the degradation of water quality as aquatic plants and animals (including fish) need to breathe this dissolved gas and will die or migrate if it is unavailable. If the dissolved oxygen is totally depleted, foul odours and unsightly conditions are created. The BOD test was designed to provide a measure of this uptake of oxygen by attempting to recreate in the laboratory environment some of the conditions that prevail in nature. Not all such conditions can be recreated, however, and so the BOD test merely gives an indication of likely pollution. It does not attempt to describe it exactly.
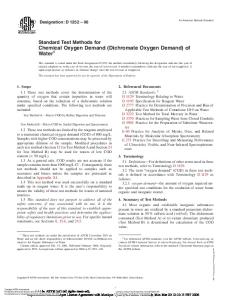
2. The BOD Test Once material, which has a biochemical oxygen demand, is discharged to a watercourse it begins to take up dissolved oxygen at a rate which depends on the temperature and the type of material discharged. Generally, simple, non-toxic organic chemicals are degraded more quickly than complex molecules and thus can exert their oxygen demand more quickly. This can be seen in Figure 1 below which shows two samples that have been tested for oxygen demand over a number of days. Sample 1 represents an effluent, which exerts its oxygen demand quickly, whereas Sample 2 consumes oxygen more slowly as seen by the flatter shape of the curve. Sample 1 could represent a discharge containing sugar, milk, blood, untreated sewage effluent or some other easily oxidised material. Sample 2, on the other hand, might represent a typical oxygen demand curve for an effluent containing more complex organic materials which are more difficult to oxidise such as industrial chemicals, solvents, fats or a treated sewage effluent. Typically, oxygen demand curves are of the shape shown in Figure 1 because some material within the sample will be oxidised quickly, giving rise to the initially steep slope of the curve, and some material will be oxidised more slowly leading to the subsequent flatter appearance. The point at the end of each curve, where it approaches the horizontal, is sometimes known as the ‘ultimate BOD (UBOD or BOD-U) of a sample; depending upon the organic material being tested it can take many days or even weeks to reach this point. For convenience, a twenty-day BOD (BOD20) is often considered to be equal to the ultimate BOD. In Figure 1 you may note that both the samples probably have the same BOD-U value.
Hydrology Project Training Module
File: “ 15 Understanding BOD test.doc”
Version 05/11/02 Page 1
Figure 1. Oxygen uptake curves : Sample 1 – easily degradable organics, Sample2 – difficult to degrade organics. 9
Ultimate BOD 8
Sample 1 7
BOD (mgO2/L)
6
5
Sample 2 4
3
2
1
0 0
5
10
15
Time (days)
For the sake of convenience and reproducibility, the standard BOD test carried out in the laboratory is run at a constant temperature and is time limited. Often the test is carried out over five days at 20oC and is designated as ‘BOD5’. However, three day (BOD3), seven day (BOD7) and other period tests are also used. In India a three day BOD test at 27oC has been standardised (Bureau of Indian Standards) and hence this training will relate to this time period and temperature. As can be seen from Figure 1, the three day test will normally result in lower BOD values than a five day test. When the temperature is increased from 20oC to 27oC the reaction proceeds at a faster rate and hence the difference between the 3 day and 5 day tests is minimal. When performed in the laboratory, the Indian Standard BOD test involves assessing the loss of dissolved oxygen in a sample incubated for three days at 27oC. This is done by comparing the dissolved oxygen concentration of a water sample which has been incubated for three days with the dissolved oxygen concentration of the sample before incubation. The loss of dissolved oxygen over the three day period is then reported as the BOD (or more correctly BOD3) of the sample.
Hydrology Project Training Module
File: “ 15 Understanding BOD test.doc”
Version 05/11/02 Page 2
Example 1 The following table gives DO values in BOD bottles, containing identical samples when incubated at 20 and 27 oC over a period of 5 days. It also gives the cumulative oxygen uptake values. Note that the BOD3 27 oC and BOD5 20 oC values are nearly the same. Day
DO, mg/L 20 oC
Total DO consumed, mg/L, 20 oC
DO, mg/L 27 oC
Total DO consumed, mg/L, 27 oC
0 1 2 3 4 5
8.0 6.4 5.1 4.1 3.3 2.6
0 1.6 2.9 3.9 4.7 5.4
8.0 5.6 3.9 2.7 1.9 1.3
0 2.4 4.1 5.3 6.1 6.3
3. Factors Affecting the Oxygen Demand Rate The rate at which organic matter is oxidised in the aquatic environment depends upon a number of factors including the following: • • •
the composition of the material the temperature the concentration of micro-organisms present
With regard to temperature, generally the rate of the BOD reaction increases with increasing temperature. In the laboratory, therefore, the BOD test is carried out at a standard temperature of 27°C in order that results are comparable with each other. It is important to remember, however, that in the environment the oxygen demand reaction may proceed at a greater or lesser rate depending upon the ambient temperature. The concentration of micro-organisms present in the watercourse or water sample bottle also has an effect on the rate of the BOD reaction. Under normal circumstances there are usually sufficient numbers of suitable micro-organisms present to allow the BOD reaction to proceed. Occasionally, however, particularly if the water contains chemicals which are toxic to bacteria, no, or few, micro-organisms are present to carry out the oxygen demand reaction. If the BOD of such a sample were to be determined, it would produce a result much lower than the concentration of organic matter in the sample would suggest. To prevent this false low result in the laboratory, the sample must be ‘seeded’ with suitable bacteria. Usually a small amount of settled raw sewage is used as a source of seed. In case the waste is toxic in nature an acclimated seed must be developed. In order that a BOD test is successful, some residual DO must remain in the bottle after the incubation. Since DO saturation values are in the range of 8 to 9 mg/L, a sample whose BOD is higher has to be diluted. Procedures for seeding and dilution are described in the analytical procedure for BOD determination.
Hydrology Project Training Module
File: “ 15 Understanding BOD test.doc”
Version 05/11/02 Page 3
4. Relationship of BOD to Other Water Quality Parameters There are a number of other ways of measuring the amount of organic pollution in water. Two methods in particular are worthy of discussion in this respect as they are related in different ways to the BOD. Chemical Oxygen Demand (COD) is also a measure of the organic pollution present in the water. Like BOD, it is a measure of the oxygen demand exerted by organic matter when it is discharged to the water environment. It differs from BOD, however, in the method of determination of the oxygen demand as this is ascertained by means of a chemical test. A strong chemical oxidising agent is used under extreme laboratory conditions to ensure that virtually all organic matter within the sample is oxidised during the analysis some of which may not be susceptible to bacterial decomposition. The amount of oxygen used during the test is then calculated. Some naturally occurring organic compounds such as celluloses, fulvic acids, lignins or many synthetic petrochemicals, are either nondecomposable or are degraded at a very slow rate by bacteria. For a given water sample, therefore, COD is always greater than BOD. It is also possible to measure the Total Organic Carbon (TOC) content of a water sample. The analysis can be carried out in a number of ways and, as its name implies, measures all the carbon, which is bound up in the organic matter within the water sample. TOC is therefore related to BOD and COD as most of the oxygen demand measured during these analyses is due to organic carbon. Due to the fact that the BOD of a sample can be related to both the COD and the TOC, it is sometimes possible to estimate the BOD from either the COD or the TOC. However, before this can be attempted, it is necessary to establish a relationship between these two parameters for a particular sampling point. This is done by carrying out many BOD and COD or TOC analyses on the sampling point under various conditions so that a reliable ratio can be established.
5. Sample Handling Provided conditions are right, organic matter discharged to the aquatic environment will be continually oxidised and thus exert an oxygen demand. Once a sample of water containing organic material is taken from a water body there is nothing to stop the oxidation reactions within the sample bottle, thereby altering the BOD of the sample. To limit this change in the BOD, it is preferable if samples are analysed as soon as possible after collection. If they cannot be analysed immediately, samples should be stored at 4 to 5OC. This greatly reduces the rate of oxidation reactions so that the BOD does not change significantly.
6. Interferences The BOD test relies on micro-organisms degrading the organic matter present in the sample during the analysis. For this reason, the conditions of the analysis must allow the microorganisms to grow, as far as possible, without undue environmental stress. If the pH of the sample is too low (below 6.5) or too high (above 7.5), the BOD analysis may be affected by the bacteria’s ability to grow in such conditions. Therefore, samples with a pH below 6.5 and above 7.5 on reaching the laboratory, should be adjusted by the addition of acid or alkali, to a pH within the range 6.5 to 7.5. As discussed above, the presence of toxic material in the BOD sample will also inhibit the analysis and will mean that the sample must be ‘seeded’ with bacteria in order for the test to proceed normally. If the toxicity of the sample is due to the presence of chlorine this should be neutralised by adding sodium thiosulphate or sodium bisulphite prior to ‘seeding’.
Hydrology Project Training Module
File: “ 15 Understanding BOD test.doc”
Version 05/11/02 Page 4
Sometimes waters, particularly those containing high concentrations of algae, may be ‘supersaturated’ with dissolved oxygen (that is, due to pure oxygen production by algae during photosynthesis, the water has a higher concentration of oxygen than normal saturation value). If this is the case, the sample should be shaken in a partially filled bottle so that all excess oxygen is lost before the BOD analysis takes place. If such a procedure is not carried out , the excess oxygen may be lost during the BOD test leading to an incorrect result. Organic compounds are not the only materials which, when discharged to the aquatic environment, have an oxygen demand. Most notably ammonia, either free or when released from nitrogen containing organic compounds, is also oxidised in watercourses resulting in depletion of dissolved oxygen. The oxidation of nitrogen compounds, carried out by nitrifying bacteria, (a process known as nitrification) in the BOD sample can be suppressed, by the addition of an inhibitory chemical, so that only the BOD resulting from the oxidation of carbon compounds is determined. If such a chemical is not added the resulting BOD may be a combination of the oxygen demand caused by both carbonaceous matter and ammonia based material in the sample. This is particularly the case for biologically treated secondary effluents. Oxygen consumption due to ammonia oxidation may be important in case of study of dissolved oxygen resources of receiving waters. In many wastes where the concentration of nitrifying bacteria is relatively low (e.g., raw sewage, industrial effluents) the bulk of the oxygen demand will be due to carbonaceous material. The nitrification reaction starts only after most of the organic matter is oxidised which may take from 10 to 15 days. The presence of algae in the BOD sample may also lead to false results if the bottles are not stored in the dark. This is because algae have the ability to produce oxygen during photosynthesis making it impossible to decide how much oxygen the organic matter consumed.
7. BOD Progression Equation The BOD progression can be approximated by a first order reaction. In simple terms the oxygen demand exerted in a day is a constant fraction of the demand remaining. Example 2 Calculate the oxygen demand exerted by a sample of industrial waste whose ultimate BOD is 256 mg/L, in 1, 2, and 3 days. Assume that 25% of remaining demand is exerted each day.
Hydrology Project Training Module
File: “ 15 Understanding BOD test.doc”
Version 05/11/02 Page 5
Time day (1) 0 1 2 3
BOD exerted each day mg/L (2) 0 64 48 36
Cumulative BOD exerted mg/L (3) 0 64 112 148
BOD remaining mg/L (4) 256 192 144 108
(2) at t = 25% of (4) at (t-1), (3) at t = (2) at t + (3) at (t-1), (4) = 256 – (3) The above relation can also be expressed in the form of an exponential equation: Yt = Lo (1 - e -kt) where, Yt
= BOD exerted in time t, d
Lo k
= BOD-U, mg/L = BOD rate constant, d –1
The rate constants for a waste, k1 and k2, at two temperatures T1 and T2, respectively can be related to each other by the equation: k1 = k2 1.047(T1 – T2). Example 3 Calculate the BOD progressions for 5 days at one day intervals for a water sample at 20 and 27 oC. Th BOD-U is 12 mg/L and the rate constant for 20 oC is 0.22 d-1. Plot the results on a graph and compare BOD3 at 27oC with BOD5 at 20oC. (1) Calculate the BOD rate constant at 27 oC: k27 = k20 1.047(T1-T2) = 0.22 x 1.047(27-20) = 0.3 d –1 (2) Set up calculation table: t, d 1 2 3 4 5
T = 20 oC, k20 = 0.22 d -1 1-e-0.22t 0.1975 0.356 0.483 0.588 0.667
Hydrology Project Training Module
Yt=12(1-e-0.22t) 2.4 4.3 5.8 7.0 8.0
T = 27 oC, k27 = 0.3 d -1 1-e-0.3t 0.259 0.451 0.593 0.699 0.777
File: “ 15 Understanding BOD test.doc”
Yt=12(1-e-0.3t) 3.1 5.4 7.1 8.4 9.3
Version 05/11/02 Page 6
(3) Plot the Y, Oxygen consumed values against t, time. Note that BOD3, 27oC is nearly same as BOD5 20oC
BOD Progression 10
o
27 C
Oxygen Consumed (mg/l)
8
o
20 C
6
4
2
0 0
1
2
3
4
5
6
Time (days)
8. Problems 1. What use is made of BOD test in water pollution control? 2. Name three precautions which should be taken while conducting a BOD test. 3. Is the BOD test a measure of microorganisms, organic matter or dissolved oxygen? 4. The BOD value is always less than the COD value. Give two possible reasons. 5. Two samples have identical BOD3, 27oC values of 4.5 mg/L but different reaction rate constants equal to 0.15 and 0.25 per day. a. Estimate their ultimate BOD values. b. Sketch the BOD progression curves. c. Which sample has greater potential for causing environmental damage? 6. A sample of wastewater has BOD3, 27oC equal to 200 mg/L and a rate constant equal to 0.4 per day. a. Calculate its ultimate BOD. b. What percent of remaining BOD is exerted each day?
Hydrology Project Training Module
File: “ 15 Understanding BOD test.doc”
Version 05/11/02 Page 7