Anal. Chem. 2010, 82, 7929–7934
Ultrasonic Detector for High Precision Measurements of Carbon Dioxide† Peter C. Andersen,‡ Craig J. Williford,‡ Donald E. David,§ and John W. Birks*,‡ 2B Technologies, Inc., 2100 Central Ave., Suite 105, Boulder, Colorado 80301 and Department of Chemistry and Biochemistry and Cooperative Institute for Research in Environmental Sciences (CIRES), University of Colorado, Boulder, Colorado 80309-0215 A new instrument for monitoring atmospheric CO2 has been developed based on the measurement of the speed of sound in air. The instrument uses a selective scrubber to yield highly precise and accurate measurements of CO2 mixing ratios at ambient concentrations. The instrument has a precision of 0.3 ppmv (1σ) with a signal that is independent of pressure and requires a flow rate of only 30 mL/min. Laboratory measurements of atmospheric CO2 showed excellent agreement with values obtained by nondispersive infrared absorption. The instrument has the advantage of collecting continuous, high-precision data every 25 s and can be modified for vertical profiling studies using kites, balloons, or light aircraft for the purpose of measuring landscape-scale fluxes. The release of carbon dioxide from fossil fuel burning results in an increase of ≈3 ppmv to the global atmosphere every year and is driving global climate change.1 In order to model the global carbon cycle and make predictions of future climate change, measurements of landscape-scale fluxes are required that characterize areas on the scale of 100 km2 or larger.2 These measurements are needed to bridge the gap in scales between localized studies carried out near the surface and atmospheric modeling studies that attempt to assign sources and sinks on a global scale. The most viable approach to measuring of fluxes on such a large scale is vertical profiling of CO2 with highaccuracy and high-precision instruments. Because CO2 has a long residence in the atmosphere, on the order of a few years, the spatial variability of its mixing ratio is very small. Variations of only a few ppmv need to be measured above an average background CO2 concentration of 370 ppmv in order to derive information about CO2 fluxes to and from the Earth’s surface. It is generally considered that the minimal required precision for vertical profiling of CO2 is about 0.3 ppmv.3,4 A precision of 0.2 ppmv would be more than † Part of the special issue “Atmospheric Analysis as Related to Climate Change”. * To whom corresponding should be addressed. Fax: (303) 277-1812. E-mail:
[email protected]. ‡ 2B Technologies, Inc. § University of Colorado. (1) Scheffer, M.; Brovkin, V.; Cox, P. M. Geophys. Res. Lett. 2006, 33, L10702. (2) Massman, W. J.; Lee, X. Agric. For. Meteorol. 2002, 113, 121–144. (3) Graven, H.; Stephens, B.; Guilderson, T.; Campos, T.; Schimel, D.; Campbell, J.; Keeling, R. Tellus 2009, 61B, 536–546.
10.1021/ac101365p 2010 American Chemical Society Published on Web 09/07/2010
adequate for most atmospheric applications and would be comparable to the precision and accuracy that can be obtained using presently available instrumentation and calibration techniques. Many methods have been developed for the measurement of gaseous CO2; however, only a few techniques are used to measure vertical profiles of atmospheric levels near 370 ppmv with a precision of e0.3 ppmv. Nondispersive infrared (NDIR) absorption is almost exclusively used for continuous monitoring, taking advantage of the fast response (10-20 Hz) and the high precision (0.1-0.2 ppmv) for field measurements. These detectors have been used for atmospheric CO2 measurements on unmanned aerial vehicles in the troposphere and large balloons in the stratosphere.5,6 However, NDIR instruments such as the Li-Cor Model 6252 are relatively large (33.5 × 24 × 13 cm), heavy (3.5 kg) and require 10-16 W of power. More importantly, these instruments are sensitive to pressure as a result of pressure broadening of the absorption lines and require bulky reference gases to continuously monitor drift, making them unsuitable for portable atmospheric monitoring using kites and small balloons. Recently, compact infrared absorption detectors, such as the Vaisala Carbocap, have become available that are lightweight and draw very little power, but these instruments are also pressure dependent and are designed for fixed site monitoring.7 A number of infrared laser techniques have been applied to atmospheric CO2 measurements, including tunable diode laser absorption spectroscopy (TDLAS) and cavity ring-down spectroscopy (CRDS).8-12 Laser based instruments perform well in atmospheric monitoring from fixed sites or aircraft, but are excessively large and heavy and consume too much power to use (4) Schulz, K.; Jensen, M. L.; Balsley, B. B.; Davis, K.; Birks, J. W. Environ. Sci. Technol. 2004, 38, 3683–3688. (5) Daube, B. C.; Boering, K. A.; Andrews, A. E.; Wofsy, S. C. J. Atmos. Ocean. Technol. 2002, 19, 1532–1543. (6) Watai, T.; Machida, T.; Ishizaki, N.; Inoue, G. J. Atmos. Oceanic Technol. 2006, 23, 700–710. (7) Kulmala, L.; Gronholm, T.; Laakso, L.; Keronen, P.; Pumpanen, J.; Vesala, T.; Hari, P. Boreal Environ. Res. 2009, 14, 754–760. (8) Griffis, T. J.; Baker, J. M.; Sargent, S. D.; Tanner, B. D.; Zhang, J. J. Agric. For. Meteorol. 2004, 124, 15–29. (9) Schaeffer, S. M.; Miller, J. B.; Vaughn, B. H.; White, J. W. C.; Bowling, D. R. Atmos. Chem. Phys. 2008, 8, 5263–5277. (10) Gibert, F.; Joly, L.; Xue´ref-Re´my, I.; Schmidt, M.; Royer, A.; Flamant, P. H.; Ramonet, M.; Parvitte, B.; Durry, G.; Ze´ninari, V. Spectrochim. Acta A 2009, 71, 1914–1921. (11) Crosson, E. R. Appl. Phys. B: Lasers Opt. 2008, 92, 403–408. (12) Chen, H.; Winderlich, J.; Gerbig, C.; Hoefer, A.; Rella, C. W.; Crosson, E. R.; Van Pelt, A. D.; Steinbach, J.; Kolle, O.; Beck, V.; Daube, B. C.; Gottlieb, E. W.; Chow, V. Y.; Santoni, G. W.; Wofsy, S. C. Atmos. Meas. Tech. 2010, 3, 375–386.
Analytical Chemistry, Vol. 82, No. 19, October 1, 2010
7929
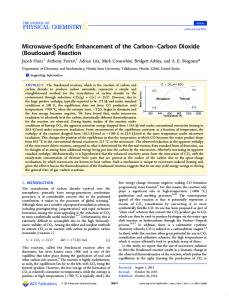
Figure 1. Schematic diagram of the ultrasonic CO2 detector.
with kites and balloons. For example, a commercially available CRD spectrometer, the Picarro G1301, has sufficiently high precision (0.2 ppmv) for vertical profiling and requires infrequent calibration, but is large (59 × 43 × 25 cm), heavy (26 kg), and has a high power consumption (300 W). Other methods have been developed for CO2 field measurements based on conductometric detection and pH-sensitive dyes. Several conductometric sensors have been developed based on the hydrolysis of CO2 in water,13-15 but only one has been reported with a precision as low as 0.36 ppmv.16 The principal limitation of this conductometric method is that it is not easily miniaturized. Also, it is necessary to use a bicarbonate scrubber to remove potential interferences from strongly acidic gases. Several methods use optical monitoring of pH-sensitive dyes that change in response to the formation of carbonic acid from gaseous CO2.17-22 These methods are limited by the consumption of reagents and long response times have been reported for methods using dyes immobilized on a solid support. We have developed a new method based on ultrasonic detection for measuring carbon dioxide with high precision and accuracy. Ultrasonic detection has been used successfully for many years in a variety of applications, including highly accurate flask sample measurements of CO2 using gas chromatography.23 Rather than chromatographic separation, our instrument avoids interference from other atmospheric constituents using a scrubber to selectively remove CO2. This approach allows measurements to be made in real time, at a fast rate, and without the large size, weight and power requirements of a GC. In addition, it is based on a purely physical property rather than a chemical reaction and has a response that is virtually independent of ambient pressure, unlike NDIR instruments. EXPERIMENTAL SECTION Instrument. A schematic diagram of the ultrasonic CO2 detector is shown in Figure 1. A diaphragm air pump (13) Van Kempen, L. H.; Kreuzer, F. Respir. Physiol. 1975, 24, 89–106. (14) Himpler, H. A.; Brand, S. F.; Brand, M. J. D. Anal. Chem. 1978, 50, 1623– 1627. (15) Bruckenstein, S.; Symanski, J. S. Anal. Chem. 1986, 58, 1766–1770. (16) Kuck, L. R.; Godec, R. D.; Kosenka, P. P.; Birks, J. W. Anal. Chem. 1998, 70, 4678–4682. (17) Zhujun, Z.; Seitz, W. R. Anal. Chim. Acta 1984, 160, 305–309. (18) Wolfbeis, O. S.; Weis, L. J.; Leiner, M. J. P.; Ziegler, W. E. Anal. Chem. 1988, 60, 2028–2030. (19) DeGrandpre, M. D. Anal. Chem. 1993, 65, 331–337. (20) Mills, A.; Chang, Q. Analyst 1993, 118, 839–843. (21) Mills, A.; Monaf, L. Analyst 1996, 121, 535–540. (22) Dasgupta, P. K.; Genfa, Z.; Poruthoor, S. K.; Caldwell, S.; Dong, S.; Liu, S.-Y. Anal. Chem. 1998, 70, 4661–4669. (23) Wofsy, S. C.; Harris, R. C.; Kaplan, W. A. J. Geophys. Res. 1988, 93, 1377– 1387.
7930
Analytical Chemistry, Vol. 82, No. 19, October 1, 2010
(Sensidyne, model 60) is used to pressurize the sample. Next, Drierite (anhydrous calcium sulfate, Fisher Scientific) is used to remove the bulk of the moisture in the gas. The sample flow is then split, and half of it is scrubbed by Ascarite II (sodium hydroxide coated on non fibrous silica, Fisher Scientific) to remove CO2 from the sample. Both gas flows are then scrubbed with Drierite followed by phosphorus pentoxide (Fisher Scientific, ACS grade) to reduce moisture to trace levels. The gas flows are directed to either cell A or cell B of the detector using two solenoid valves (Pneutronics, 25-10-5-NV) that are configured in a 4-way, crossover configuration. The detector is a Tremetrics Ultrasonic Detector (USD) that was originally designed to be used for gas chromatography applications with a small dead volume (180 µL), inherently fast electronic response time, and very low required flow rates (10-60 mL/min).24,25 A phase meter (Tracor, 704) was used to measure the response of the Tremetrics USD. After the detector, back pressure regulators (Porter Instruments, 9000AMBF100) are used to maintain constant pressure in the detection cell, and miniature mass flow controllers (Pneucleus, 21B-00050N-01) are used to maintain constant flow. RESULTS AND DISCUSSION Theory. The ultrasonic detector measures the phase difference between two signals, such as the waveform driving an ultrasound transmitter (source) and the waveform detected by an ultrasound receiver (detector). Changes in the gas composition between the transmitter and receiver will produce a phase shift between the two signals. Phase shifts can also be measured between a receiver in a reference cell and a receiver in a sample cell. The measured phase difference is proportional to the velocity of the sonic wave, which in this case is proportional to the concentration of CO2 in air. The velocity of sound in an ideal gas is given by
v)
1/2
( γRT M )
(1)
where M is the molecular weight of the gas, γ is the ratio of molar heat capacities (Cp/Cv), R is the gas constant and T is the absolute temperature.26 The time for a sound wave to travel a distance s from its source is s/v, and the phase delay in degrees is given by
360fs φ) ) v
360fs
( Mγ )
1/2
(RT)1/2
(2)
where f is the frequency of the wave.26 This equation shows that a change in phase delay, which can be measured as a phase shift, is a function only of the molecular weight, heat capacity and temperature of the gas. With the temperature held constant, the phase shift will change in a predictable way with the molecular weight of the (24) Grice, H. W.; David, D. J. J. Chromatogr. Sci. 1969, 7, 239–247. (25) David, D. J. Gas Chromatographic Detectors; Wiley: New York, 1974. (26) Noble, F. W.; Abel, K.; Cook, P. W. Anal. Chem. 1964, 36, 1421–1427.
gas. If an analyte of molecular weight M2 is added to matrix gas of molecular weight M1, the change in phase is given by
[ ] {(
∆φ ) 180sfn
M1 RTγ1
1/2
)
(
)}
M2 - M1 Cp2 γ1 -1 + M1 Cp1 γ2
(3)
where n is the mole fraction of the analyte, and the subscripts 1 and 2 refer to the matrix gas and analyte, respectively.26 Equation 3 shows that the phase shift is directly proportional to the mole fraction of the analyte. Considering the composition of air, there are four constituents that could potentially interfere at the 0.05 ppmv level or higher. In order of ambient mixing ratio these are oxygen, water (up to a few % mole ratio), methane (up to a few ppmv), and hydrogen (typically 0.5 ppmv). Nitrogen and argon have extremely long lifetimes and are very well mixed in the atmosphere. Water is present at large mixing ratios in the atmosphere and has a high tendency to adsorb to surfaces. As a result, complete cancellation of the water signal is impossible when switching between H2Oscrubbed and H2O-unscrubbed air. In principle, the instrument design would cancel contributions from any potential interference. Desiccants and cryogenic drying were evaluated as means to remove water from the air flow. Selectivity against variations in O2, CH4 and H2 was achieved by use of a CO2 scrubber that selectively modulates CO2 in the presence of these potential interferences. The response of the USD is highly sensitive to temperature since the speed of sound increases as the square root of temperature. Equation 3 can be simplified so that the phase shift for a given analyte and carrier gas can be approximated as
( )
φ)c
n T1/2
(4)
where c is a collection of constants, n is the mole fraction of the analyte gas, and T is the absolute temperature. We can determine the relative sensitivities to mole fraction of analyte and to temperature by taking the derivatives of the phase shift with respect to each of these variables, then taking the ratio of the derivatives to give the result -2T dφ dφ ) dn n dT
(5)
From eq 5, the temperature change producing the same phase shift as a 0.1 ppmv increase in mole fraction of analyte at a mixing ratio of 370 ppmv and a cell temperature of 363 K is -0.2 K. Given that the required precision for vertical profiling of CO2 is about 0.3 ppmv, the temperature needs to be held constant to ±0.6 °C. Since our instrument measures the difference between CO2scrubbed and unscrubbed air, the temperature only needs to be this stable over the valve cycle time, which is typically