MARYLAND CHILD CARE RESOURCE NETWORK
Trends in Child Care
2015 This publication was produced as a work for hire for the benefit of, and with funds from, the Maryland State Department of Education.
NE
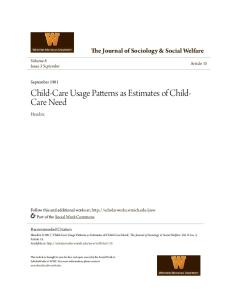
How many children in Maryland will need child care in the future?
In Maryland, 79% of children under age 12 – more than 772,000 children in 2019 – may require child care while their mothers are at work.
Number of Children 1,000,000 900,000 800,000 700,000 600,000 500,000 400,000 300,000 200,000 100,000
2010
2011
2012
2013
2014
2015
2016
2017
2018
2019
Years
This publication provides a summary of the critical components of child care (demand, supply, and cost) from 2010 to 2019. The analysis is based on the data collected by LOCATE: Child Care of the Maryland Family Network and the Maryland Child Care Resource Network. The historical data collected from 2010 to the present is analyzed in the following summary and is used to project the data forecasts for 2015 through 2019 using Multiple Regression Analysis and Forecasting template. The results of the analysis are presented through a combination of graphs, charts, and text descriptions that summarize the data and interpret the trends. The chart above shows the total number of children in Maryland and groups them into the indicated age ranges. The chart indicates the data collected to date and projects the size of the population from which the
2
Maryland Family Network | www.marylandfamilynetwork.org
future need for child care will come. It is estimated that 79% of the total population of children under the age of 12 have mothers in the work force and may require child care. Analysis of the data provides the following trends: • �The number of children in the 0-4 age group is projected to increase by about 6.3% from 2015 through 2019. • �The number of children in the 5-9 age group is projected to increase by about 4.9% from 2015 through 2019. • �The number of children in the 10-11 age group is projected to decrease by about 2.1% from 2015 through 2019. • �The total number of children under 12 in Maryland is projected to increase by about 4.3% from 2015 to 2019.
EED
How many child care providers will there be in Maryland in the future?
Number of Family Child Care Providers in Maryland
Number of Center-Based Programs in Maryland
11,000
1,900
10,000
1,700
9,000
1,500
8,000
1,300
7,000
1,100
6,000
900
Actual Number of Center-Based Programs
5,000
2010 2011 2012 2013 2014 2015 2016 2017 2018 2019 Years
700
Number of School-Age Programs in Maryland 1200
2,500
1000
2,000
800
1,500
600
1,000
400 Actual Number of School-Age Programs Predicted Number of School-Age Programs
0 2010 2011 2012 2013 2014 2015 2016 2017 2018 2019 Years
The graphs above depict the number of licensed child care providers in the state of Maryland, including both family providers and center-based programs. Separate graphs indicating the number of school-age programs and full-day infant care are also provided. The graphs indicate the actual numbers collected to date and show projections based on this information for the near future.
2010 2011 2012 2013 2014 2015 2016 2017 2018 2019 Years
Number of Full-Day Infant Centers in Maryland
3,000
500
Predicted Number of Center-Based Programs
200
Actual Number of Full-Day Infant Centers Predicted Number of Full-Day Infant Centers
700 0 2010 2011 2012 2013 2014 2015 2016 2017 2018 2019 Years
The second pair of graphs depicts the growth of schoolage programs and full-day infant centers in Maryland. The number of school-age programs is projected to decrease by 2.3% from 2015 to 2019. The number of full-day infant centers has grown at an extremely rapid rate from 2010 to the present and is expected to grow by over 7% into the year 2019.
As shown in the first graph, the number of family child care providers in Maryland shows a projected decrease of about 17% from 2015 to 2019. Over this same period, the number of center-based programs shows a projected growth of about 4%.
Maryland Family Network | www.marylandfamilynetwork.org
3
NE
Is there a need for child care that can serve children with social/emotional disorders?
The need for child care for children with special needs is substantial, and children with emotional and social disorders comprise a large segment of the population in need of these services.
Accommodations Needed by Children with Special Needs Served Through LOCATE: Child Care
Cognitive Accommodations Needed1 – 30%
Social Emotional Accommodations – 38%
Autism Spectrum Disorder – 19%
Medical/Physical Accommodations Needed – 32%
Attention Deficit Hyperactivity Disorder –10% Other Mental Health Disorders2 – 9%
1 2
Numbers include children with developmental delays as well as those with social/emotional disorders. Children with developmental delays often need social/emotional accommodations in the child care setting. Includes such conditions as depression, obsessive compulsive and other emotional disturbances.
In 2014, LOCATE: Child Care’s Special Needs Service provided enhanced child care resource and referral services to the families of 1,167 children with special needs. The demand for these services was greatest for young children – from birth to age six. A majority of the 1,167 children served (61%) were under the age of six. Only 8% of services related to children age twelve to twenty-one. Forty-six percent (46%) of children served by LOCATE’s Special Needs Service had a single disability while 54% had multiple disabilities.
4
Maryland Family Network | www.marylandfamilynetwork.org
Many children with a disability need some accommodation in child care settings. In earlier years, LOCATE had noticed a significant number of children needing social/emotional accommodations. Since 2006, the percentage of children needing social/emotional accommodations has leveled in the 36% to 40% range except for one year which showed an increase to 44% . Of the children requiring social/emotional accommodations, most are affected by Attention Deficit Hyperactivity Disorder (ADHD) or Autism. The percentage of children affected by Attention Deficit Hyperactivity Disorder (ADHD) has remained steady in the 8%-10% range since 2007.
EED
What about non-traditional hours of care?
Approximately 25% of caregivers are licensed to offer evening or overnight care.
*
Providers and programs licensed for overnight care – 2%
12:00 a.m. or later2 0.0%
Providers and programs licensed for evening care – 22% Before 6:00 p.m. 29.9% 10:00 p.m.-12:00 a.m. 36.2%
Providers and programs licensed for traditional hours only – 78%
7:00 p.m.-10:00 p.m. 4.6%
6:00 p.m.-7:00 p.m.1 29.3%
*Percentages may not equal 100% because of rounding.
*Percentages may not equal 100% because of rounding. 1 This is the defined time for the start of evening care. 2 This is the defined time for the start of overnight care.
Of the caregivers that are licensed for evening or overnight care, about 70% actually offer non-traditional hours of care.
In fiscal year 2014, LOCATE: Child Care received requests for child care for 8,033 children. Of these requests, 4% (344) needed care during evening hours (6:00 p.m. to midnight), and 0.9% (71) needed care overnight (midnight to 6:00 a.m.). The percent of demands for evening care and overnight care remained basically the same as the last two years.
Maryland Family Network | www.marylandfamilynetwork.org
5
CO
Will the cost of child care continue to grow?
The cost of care has shown, and will continue to show, general growth. Average Cost of Care in Maryland Center-Based Programs Average Weekly Cost $280 $260 $240 $220 $200 $180 $160
0-2 Years
$140
2-4 Years
$120
5 Years
$100
School-Age
$80 $60 $40 $20 $0 2010
2011
2012
2013
2014
2015
2016
2017
2018
2019
Years
Average Cost of Care in Maryland Family Child Care Programs Average Weekly Cost $320 $300 $280 $260 $240 $220 $200 $180 $160
0-2 Years
$140
2-4 Years
$120
5 Years
$100
School-Age
$80 $60 $40 $20 $0 2010
2011
2012
2013
2014
2015
2016
2017
2018
2019
Years
The charts above show actual and projected weekly costs of regulated child care in Maryland, grouped according to child age. The charts include both the actual cost data collected to date and the projected future costs based on the trends of these data. Analyzing the cost data shows that all child 6
Maryland Family Network | www.marylandfamilynetwork.org
care costs are projected to increase through 2019 from about 8% to 29%, depending on age and type of care. The cost of care for children age birth to two is the highest for any age group and shows a projected growth in both types of programs – 29% for family child care and 9% for center-based programs. The cost of care for children age birth to two in center-based programs is the highest cost of any age group in either type of program.
OST
How much of a family’s income is spent on child care?
The U.S. Department of Health and Human Services recommends that parents should not spend more than 10% of their family income on child care.
Percent of Median Income Spent on Child Care in Maryland Percent of Income Spent 50 45 40 35 30 25 20 15 Baltimore City
10
Garrett County Montgomery County
5 0 2010
2011
2012
2013
2014
2015
2016
2017
2018
2019
Years
The chart above shows the percentage of income that is spent on child care by a family using child care services and projects the spending requirements into the near future. There are three jurisdictions presented on the chart to represent three different population area types – an urban population (Baltimore City), a suburban population (Montgomery County), and a rural population (Garrett County).
The current expenditures are all above the recommended goal of 10%, and all jurisdictions show a projected decrease over the next five years. Based on these projections, one of the three areas, Garrett County, is expected to meet the 10% goal by 2019.
Maryland Family Network | www.marylandfamilynetwork.org
7
TURN
What about the turnover rate among center-based child care staff?
Funding issues precluded a survey being accomplished this year to update these values. In 2007, Maryland Committee for Children (MCC) conducted a survey of child care centers in the state to measure the extent of staff turnover. Responses were received from 372 of the centers. The workforce employed by the 372 responding centers numbered 4,116, as of January 1, 2006. In the ensuing year (January 1 through December 31, 2006), 1,357 members (33%) of this child care workforce left their positions.
The greatest turnover (42%) occurred in the teacher assistant/aide group. The director group had the least turnover. Funding issues precluded a survey being accomplished this year to update these values.
Total Staff and Exiting Staff at Responding Child Care Centers Staff Level Director
Number of employees at start of year
Number of employees that left during the year
450
84 (19%)
Senior Staff/Group Leaders
1,977
555 (28%)
Teachers Assistant/Aide
1,689
718 (42%)
Total Staff
4,116
1,357 (33%)
Source: Survey conducted by Maryland Committee for Children, September 2007
What factors contribute to the turnover rate among center-based child care staff? Compensation is the major factor affecting staff turnover. In the survey cited above, responses from 159 centers (54% of those centers who responded to this question) indicated that compensation was a significant factor in the decision of employees to leave their jobs. Respondents were asked to indicate which aspects of compensation played a role in turnover. Wages ranked highest in this regard, followed by other concerns: • 157 centers cited wages as an issue in turnover; • 83 centers cited health benefits; • 28 centers cited paid leave; and • 24 centers cited various other concerns.
8
Maryland Family Network | www.marylandfamilynetwork.org
Not all staff turnover was attributed to compensation. Surveys from 138 centers (46% of those centers who responded to this question) reported that compensation was not a factor in turnover. These centers cited various reasons for turnover including life cycle events such as marriage, pregnancy, employee’s desire to stay home with their own children, returning to school, getting a degree and seeking other employment, moving, retirement, etc. 1
� wenty percent (20%) of responding centers did not answer the T question regarding the relationship of compensation to turnover.
NOVER
What about the family child care provider turnover rate? 10.8% of Maryland’s licensed family child care providers left the profession last year.
This turnover rate is slightly less than the last two years but continues to be a source of concern. One outcome of high turnover is inconsistent care for children who are forced to change from one caregiver to another. In addition, high turnover creates a less-experienced child care workforce. In the year ending in June 2014, 84% of family child care providers sampled had been operating for more than three years with almost 54% in operation for more than nine years. Four percent had been operating their business for less than one year, according to MFN data.
The provider turnover rate represents changes in the child care provider database due to providers being deleted (leaving the child care profession due to the provider’s personal/family issues, burn-out, or career change) and new providers being added. The turnover rate is calculated as the number of family child care providers deleted from the database during the year divided by the sum of family child care providers at the start of the year plus the number of providers added during the year. There was a net loss of 335 family child care providers in Maryland between July 2013 and June 2014.
What attracts people to a career in family child care? What causes them to leave? In 2014, MCC surveyed 271 new family child care providers. As shown below, their primary reasons for entering the child care profession were that they enjoy working with children and that they want to stay home with their own children.
In 2014, MCC also surveyed 365 family child care providers who were leaving the child care profession. As shown below, they were leaving the child care profession because they moved; they experienced burnout or retired or got a new job; or they couldn’t attract enough children to make their child care business profitable.
Reasons New Family Child Care Providers Entered the Child Care Profession in Maryland
Reasons Maryland Family Child Care Providers Leave the Child Care Profession
Enjoy working with children
52%
Moved 21%
Stay at home with own children
35%
Retirement/Burnout 16%
Left prior work
7%
Not profitable
14%
Extra income
3%
New job
12%
No quality child care for my children
3%
Difficulty with parents
Source: MFN/LOCATE: Child Care, July 2014. Percentages do not equal 100% because this is not a complete listing of reasons.
2%
Source: MFN/LOCATE: Child Care, July 2014. Percentages do not equal 100% because this is not a complete listing of reasons.
Maryland Family Network | www.marylandfamilynetwork.org
9
What are the average salaries of child care workers in Maryland?
COMPENSATION The salaries of child care workers are low, when compared to other occupations – ranging between $8.63 and $20.19 per hour.
Annual Average Salary of Child Care Workers in Maryland* Average Annual Salary 45,000 40,000 35,000 30,000 25,000 20,000 15,000 Family Child Care Providers
10,000
Center Directors Center Senior Staff/Teachers
5,000
Center Aides 0 2010
2011
2012
2013
2014
2015 Years
The chart above summarizes the salary growth of four categories of child care workers. Actual data, collected to the present date, is indicated as well as future projections based on these data. As depicted in the graph, the salaries of all child care workers show a general increase to date with continued projected growth. Based on current trends, by 2019, all average salaries are projected to grow by 1% to 9% over the next five years.
10
Maryland Family Network | www.marylandfamilynetwork.org
2016
2017
2018
2019
* Based on working 2080 hours per year.
How can the quality of child care be improved?
QUALITY Over the past several years, programs, both at the state and national level, have been created to improve the quality of child care. These voluntary programs have been credited with developing criteria for improving both child care programs and the individuals working in the child care field. Participation in one of these programs provide recognition to those child care providers or programs that go beyond the requirements of state licensing and regulations.
Successfully meeting the established criteria for programs is recognized by awarding the program a status of “accredited”. Likewise, meeting the criteria for individuals working in child care programs is recognized by awarding a status of “credentialed”. Documentation of these efforts in Fiscal Year 2014 has been supplied for this report by the Maryland State Department of Education (MSDE).
Accredited Programs
Participants in MSDE Credential Program
Family Providers
115
Family Child Care Providers
Licensed Child Care Center Programs
262
Licensed Child Care Center Staff
Public Pre-K
87
Head Start
59
Early Head Start
996 9,454
8
Source: Maryland State Department of Education, 2014.
Maryland Child Care Resource Network Anne Arundel: Arundel Child Care Connections 44 Calvert Street, Rm# 140A Annapolis, MD 21404 Phone: 410.222.1712 www.arundelccc.org Baltimore City: Baltimore City Child Care Resource Center 1001 Eastern Avenue Baltimore, MD 21202 Phone: 410.685.5150 www.bcccrc.org Baltimore County: Child Care Links 1101 North Point Boulevard Suite 112 Baltimore, MD 21224 Phone: 410.288.4900 www.childcarelinksinc.org Carroll: Child Care Choices 255 Clifton Boulevard Suite 319 Westminster, MD 21157 Phone: 410.751.2917 www.fcmha.org/ childcarechoices
Frederick: Child Care Choices 226 South Jefferson Street Frederick, MD 21701 Phone: 410.662.4549 Toll free: 800.753.6841 www.fcmha.org/ childcarechoices Harford/Cecil: Child Care Links of Harford and Cecil Counties Emmorton Crossroads 2105 Laurel Bush Road Suite 105 Bel Air, MD 21015 Phone: 443.512.0461 www.hccchildcarelinksinc.org Howard: Howard County Child Care Resource Center 3300 North Ridge Road Suite 380 Ellicott City, MD 21043 Phone: 410.313.1940 www.howardcountymd.gov/ children
Lower Shore: Lower Shore Child Care Resource Center Suite 500 East Campus Complex Salisbury University Power and Wayne Streets Salisbury, MD 21804 Phone: 410.543.6650 www.applesforchildren.org Montgomery: Montgomery County Child Care Resource and Referral Center 332 West Edmonston Drive Rockville, MD 20852 Phone: 240.777.3110 www.montgomerycountymd.gov Prince George’s: Prince George’s Child Resource Center 9475 Lottsford Road, Suite 202 Largo, MD 20774 Phone: 301.772.8420 www.childresource.org
Southern Maryland: The Promise Center 29958 Killpeck Creek Court Charlotte Hall, MD 20622 Phone: 301.290.0040 Toll free: 866.290.0040 www.thrptomisecenter.org Upper Shore: Chesapeake Child Care Resource Center Chesapeake College P.O. Box 8 1000 College Circle Wye Mills, MD 21679 Phone: 410.822.5400 x346 www.ccrc.org Western Maryland: Apples for Children, Inc. 1825 Howell Road, Suite 3 Hagerstown, MD 21740 Phone: 301.733.0000 www.applesforchildren.org
Maryland Family Network | www.marylandfamilynetwork.org
11
maryland family network the first five years last forever. Maryland Family Network services for families and young children:
MARYLAND CHILD CARE RESOURCE NETWORK families that are raising infants and toddlers while facing poverty, limited education, family support center network. MFN’s Family Support Centers serve
and other challenges.
locate: child care provides phone counseling to help parents find child care
that meets their family’s needs, including birth to age five, school-age child care, and
summer programs. Additional services are offered to Spanish-speakers and families of children with special needs.
child care quality and availability. MFN’s local Child Care Resource
Centers provide training and technical assistance to child care providers to improve the quality and expand the supply of child care.
advocacy. MFN is the leading public policy advocate in Maryland working to
create a system of high quality supports that benefit all young children, their families, and neighborhoods.
Stay in touch with Maryland Family Network by signing up to receive regular updates at marylandfamilynetwork.org. Find us on Facebook or follow us on Twitter @MDFamilyNetwork.
1001 Eastern Avenue, 2nd Floor Baltimore, Maryland 21202-4079 Tel 410.659.7701 www.marylandfamilynetwork.org
The Maryland Child Care Resource Network is a public/private partnership designed to expand and improve child care delivery in Maryland. Maryland Family Network manages the Network and operates as its Statewide Coordinating Entity.
This publication was produced as a work for hire for the benefit of, and with funds from, the Maryland State Department of Education. ©Maryland Family Network 2015 ©Maryland State Department of Education 2015