ICSSEA Tutorial, Paris, Dec. 7, 2006
Trends in Business Process Management Paul Harmon Executive Editor, Business Process Trends Chief Methodologist, BPTrends Associates Author, Business Process Change Copyright © 2006, Business Process Trends
www.bptrends.com
1
Trends in Business Process Management • • • • •
The BPM Market Today Level 1: Enterprise Level Trends Level 2: Process Level Trends Level 3: Implementation Level Trends Where Do We Go Next?
• Case Study (If Time Allows)
Copyright © 2006, Business Process Trends
www.bptrends.com
2
Why the Interest in Business Processes Today? • Make the company more efficient and productive by improving existing processes • Allow the company to shift goals or get into new businesses by providing the company with the ability to quickly and efficiently create new business processes • A management philosophy that seeks to create and maintain competitive advantage by integrating all of the activities into highly efficient and effective value chains • IT: Take advantage of SOA, XML and BPM Systems technologies • IT: New approach to facilitating business-IT communication Copyright © 2006, Business Process Trends
www.bptrends.com
3
Dell Computers and the Future of Corporations
Copyright © 2006, Business Process Trends
www.bptrends.com
4
What is Business Process Management? • • • • • • • • • • • •
Michael E. Porter, Competitive Strategy, 1980 Edwards W. Deming, Out of the Crisis, 1986 Geary Rummler & Alan Brache, Improving Performance, 1990 James Harrington, Business Process Improvement, 1991 Michael Hammer & James Champy, Reengineering the Corporation, 1993 August-Wilhelm Scheer, Business Process Engineering, 1994 Carnegie Mellon/Software Eng. Inst. The Capability Maturity Model, 1995 Kaplan, Robert S. and David P. Norton. The Balanced Scorecard: Translating Strategy into Action,1996. Supply Chain Council. SCOR Reference Manual 1.0, 1997 Thomas Davenport, Mission Critical, 1999; Working Knowledge, 2005 Howard Smith & Peter Fingar, Business Process Management: The Third Wave, 2002 Paul Harmon, Business Process Change: A Manager’s Guide, 2003 Copyright © 2006, Business Process Trends
www.bptrends.com
5
Michael Porter and Process Management • The father of the modern Business Process Management movement is Michael E. Porter of the Harvard Business School • 1980 Competitive Strategy • 1985 Competitive Advantage • 1990 The Competitive Advantage of Nations • 1996 “What is Strategy?” (HBR,Nov-Dec 1996) • First and foremost, Business Process Management is a management philosophy and a methodology for increasing profits and obtaining competitive advantage
Copyright © 2006, Business Process Trends
www.bptrends.com
6
Michael Porter on Competitive Advantage • Competitive advantage allows a company to dominate its industry for a sustained period of time • “Ultimately, all differences between companies in cost or price derive from the hundreds of activities required to create, produce, sell, and deliver their products or services such as calling on customers, assembling final products, and training employees… “ • “Activities, then, are the basic units of competitive advantage.”
Copyright © 2006, Business Process Trends
www.bptrends.com
7
Operational Effectiveness and Strategy • “Operational effectiveness means performing similar activities better than rival perform them.” • “Few companies have competed successfully on the basis of operational effectiveness over an extended period, and staying ahead of rivals gets harder every day.” • “Strategic positioning means performing different activities from rivals’ or performing similar activities in different ways.” • “While operational effectiveness is about achieving excellence in individual activities, or functions, strategy is about combining activities.”
Copyright © 2006, Business Process Trends
www.bptrends.com
8
Fit and Competitive Advantage • “Competitive advantage grows out of the entire system of activities. The fit among activities substantially reduces cost or increases differentiation.” • “Achieving fit is difficult because it requires the integration of decisions and actions across many independent subunits.” • “Positions build on systems of activities are far more sustainable than those build on individual activities.”
•
Michael E. Porter. “What is Strategy?” HBR, Nov-Dec 1996.
Copyright © 2006, Business Process Trends
www.bptrends.com
9
The Focus of Functionally-Oriented Executives
Copyright © 2006, Business Process Trends
www.bptrends.com
10
The Focus of Process-Oriented Executives
Value Chain Manager
Value Chain Major Processes: New Product Development, Supply Chain/Manufacturing, Sales & Marketing
Value Chain Manager
Value Chain Major Processes: New Product Development, Supply Chain/Manufacturing, Sales & Marketing
Value Chain Manager
Value Chain Major Processes: New Product Development, Supply Chain/Manufacturing, Sales & Marketing
Copyright © 2006, Business Process Trends
www.bptrends.com
Markets Customers Markets Customers Markets Customers
11
What a Process Perspective Shows
Managment
Engineering new need identified
Production
Finance
Marketing
Product Value Chain Develop New Product
new product design Produce Products
materials
Promote Product
Product available
Sales & Support promotions Sell & Service Products
order
Customers
product delivered
Suppliers
Copyright © 2006, Business Process Trends
www.bptrends.com
12
An Aside on the Meaning of Process Value Chain Architecture SCOR Framework Business Process
Process Redesign Projects Business Rule Projects
Business Process
Business Process
Process
Process
Process
Sub-Process
Sub-Process
Sub-Process
Six Sigma Projects IT Automation Projects SAP Process Models
Sub-Sub-Process
Sub-Sub-Process
Activity
Copyright © 2006, Business Process Trends
www.bptrends.com
Activity
13
The BPTrends Associates Pyramid
Copyright © 2006, Business Process Trends
www.bptrends.com
14
The Three Areas of Process Change Strategy or Enterprise Level
Enterprise Management Activities
Process Analysis & Redesign Projects
Process Level
Implementation Level
Employee Implementation Level
Specific Process Improvement Projects IT Implementation Level
Copyright © 2006, Business Process Trends
www.bptrends.com
15
Where Organizations Are Moving
Copyright © 2006, Business Process Trends
www.bptrends.com
16
Most Companies Have a Variety of Efforts The Typical Situation There is no enterprise process model, measurement and process management system in place.
Strategy or Enterprise Level
In this case projects are undertaken in a more random way, often by different groups without tight coordination.
Process Level
Implementation Level
Employee Implementation Level
IT Implementation Level
Copyright © 2006, Business Process Trends
Equally important, changing processes not only require altering the specific processes but also require that a process management and measurement system be established.
www.bptrends.com
17
We Advocate You Create Process-Centric Company
The Ideal Situation An enterprise process model, measurement and process management system is already in place.
Strategy or Enterprise Level
Process Level
In this case the organization can consider all its options and choose processes to target.
Implementation Level
Employee Implementation Level
IT Implementation Level
Copyright © 2006, Business Process Trends
Equally important, changing processes won't require the creation of a management or a measurement system, as they will already exist and base lines for change will already be established.
www.bptrends.com
18
A Realistic Look at Process Change The SEI Capability Maturity Model (CMMI)
Copyright © 2006, Business Process Trends
www.bptrends.com
19
Some BPM Standards
Copyright © 2006, Business Process Trends
www.bptrends.com
20
BP Initiatives Underway in 2005
D evelopm ent of an Enterprise Process Perform ance Measurem ent System
C oordinating Enterprise Process Managem ent Efforts 8%
B alanced Scorecard 8%
8%
Six Sigm a Process Im provem ent Projects 7%
Process Manager Training 6% Lean Six Sigm a Process 5%
Major Process A utom ation Projects
Process A nalysis and R edesign Training (N on- Six Sigm a )
8%
4%
Modeling and R edesign Training R edesign Projects With Fram eworks (SC OR , ITIL)
4% N one 8% 13 % 9%
C oordinating Enterprise Process C hange Efforts
Copyright © 2006, Business Process Trends
12 % Major Process R edesign projects
www.bptrends.com
D evelopm ent of an Enterprise Process A rchiecture
21
The Size and Shape of the Business Process Market ERC, CRM & Other Packaged Business Applications $50 B Balanced Scorecard $ 50 M
SCOR Frameworks Consulting $50 M
EA & Business Process Redesign $ 250 M Lean Six Sigma Process Improvement $ 250M
HPT Consulting $50 M
Copyright © 2006, Business Process Trends
Business Rules Software & Consulting $ 250 M
BP Outsourcing $40 B
BPM Suites Workflow/EAI & Monitoring Software $ 1-1.5B
www.bptrends.com
22
Trends in Business Process Management • • • • •
The BPM Market Today Level 1: Enterprise Level Trends Level 2: Process Level Trends Level 3: Implementation Level Trends Where Do We Go Next?
Copyright © 2006, Business Process Trends
www.bptrends.com
23
Key Enterprise Level Considerations 1.1 Enterprise Level Activities 1.2 Business Process Strategy Themes and Financial Measures Organizational Mapping and Stakeholders 1.3 Business Process Architecture SCOR 1.4 Process Performance Measures Balanced Scorecard 1.5 Business Process Managers 1.6 A BPM Group Copyright © 2006, Business Process Trends
www.bptrends.com
24
The BPTrends Associates BPM Methodology
Copyright © 2006, Business Process Trends
www.bptrends.com
25
Enterprise Level Activities • • • • • • •
Define Strategy Model Business Processes Define Process Performance Measures Align Resources to Processes Organize Process Management Create a BPM Group to Provide Support Prioritize and Plan Process Changes
Copyright © 2006, Business Process Trends
www.bptrends.com
26
The Work of the Strategy Committee
Define Business Strategy
Monitor Strategic Performance
Copyright © 2006, Business Process Trends
Monitor Environment for Changes
www.bptrends.com
Propose Changes in Strategy As Needed
27
Strategy, Measures, and Processes Competitve/ Positioning Strategy
Achieve Competitive Advantage Strategic Theme
Strategic Theme Strategic Theme
Strategic Theme
Integrate & Align Value Chain Processes
Productivity Strategy
Growth Strategy
Internal Measures
External Measures
Improve Cost Structure
Increase Asset Utilization
Enhance Customer Value
Improve Value Chain Processes
Expand Revenue Opportunities
Improve Product/ Service
Financial Measures
Expand Market
Value Chain Create New Products
Market
Manage Sales & Marketing Product or Service
Enabling Processes
Customer Customer Customer Customer
Create Product/ Service
Copyright © 2006, Business Process Trends
www.bptrends.com
28
Strategic (Process) Themes • • •
•
•
An idea introduced by Porter and promoted recently by Kaplan & Norton (Balanced Scorecard) Porter argued that a value chain should be tightly integrated, and focused on producing a product or service that was well positioned Thus, when a positioning strategy is selected, the strategy group should proceed to define a set of themes and typical activities to show how the positioning strategy is to be implemented This isn’t process design, but simply a way of suggesting how a process design would implement the strategic position the strategy group identified The actual process designers should then assure that ALL activities in the actual process reflect the themes
Copyright © 2006, Business Process Trends
www.bptrends.com
29
Strategic Themes for Southwest Airlines Overall theme: Low cost, on time airline
Copyright © 2006, Business Process Trends
www.bptrends.com
30
Michael Porter’s Value Chain Model
Human Resource Management Finance and Accounting Technology Development Procurement
New Product Development
Operations
Distribution
Margin
Core Business Processes
Support Processes
Corporate Management
Service
Marketing and Sales
From Michael Porter, Competitive Advantage, Harvard, 1985 Copyright © 2006, Business Process Trends
www.bptrends.com
31
Unisys Corp. Functions and Value Chains Unisys Senior Management Strategy Committee
Marketing
Sales
Finance
New Product Development
Manufacturing
Service
Value Chain: Systems Integration Value Chain: Outsourcing Value Chain: Network Services Value Chain: Core Services Value Chain: Enterprise Server Technology Other Value Chains Copyright © 2006, Business Process Trends
www.bptrends.com
32
Mapping Organizations and Core Processes
Copyright © 2006, Business Process Trends
www.bptrends.com
33
Identifying What’s Valuable to Stakeholders Suppliers & Partners Labor Markets
people
General Environmental Influences : The US and world economies , government regulations , and social trends
Customers & Owners information & dividends
An Organization / A Specific Value Chain
Shareholders
advertising
Marketing
prospect identification Captial Markets
Research Community
capital
Market
New Product Development
product delivered
technology
Supply Chain Manufacturing analysis of competitor’s products
Vendors
Customers Customers
sales contacts
Sales & Service
materials
Competition Copyright © 2006, Business Process Trends
www.bptrends.com
orders service requests & complaints competitive products
34
Stakeholders • People who care about and exert influence over the company, its processes, and its products – Owners (shareholders) – Customers (and markets) – Employees – Managers – Partners – Suppliers – Government (legal, regulatory) – Public – Competitors Copyright © 2006, Business Process Trends
www.bptrends.com
35
Representing a Business Process Architecture
• A diagram that senior management can use to visualize the BP architecture – Useful, but keep it simple • A matrix that pulls all the information together in one place – What we’ll do in this class • A repository that makes it easy to alter and add elements to the architecture as they become available – What you’ll want to create at your company for the long haul
Copyright © 2006, Business Process Trends
www.bptrends.com
36
Creating a BP Architecture
Copyright © 2006, Business Process Trends
www.bptrends.com
37
Core, Managerial, and Supporting Processes
Copyright © 2006, Business Process Trends
www.bptrends.com
38
The Supply Chain Council’s SCOR •
• • •
The best example of a popular horizontal BP architecture is provided by the Supply Chain Council’s SCOR framework Created in past 5 years by consortium of some 700 companies Defines a top-down approach to organizing the BP architecture of a corporate supply chain process www.supply-chain.com
Copyright © 2006, Business Process Trends
www.bptrends.com
39
SCOR MODEL: Level 0
Business Value Chain: E.g. Consumer PCs
Resources
Copyright © 2006, Business Process Trends
Supply Chain
www.bptrends.com
Customers
40
SCOR MODEL: Level 1 Supply Chain
Plan Source
Make
Deliver
Return Copyright © 2006, Business Process Trends
www.bptrends.com
41
SCOR MODEL: Level 2 Plan
Source
Make
Deliver
S1 Source Stocked Products
M1 Make-to-Stock
D1 Deliver Stocked Products
S2 Source MTO Products
M2 Make-to-Order
D2 Deliver MTO Products
S3 Source ETO Products
M3 Engineerto-Order
D3 Deliver ETO Products
Return Copyright © 2006, Business Process Trends
www.bptrends.com
42
SCOR Model: Level 3
S3. Source ETO Product S3.1
S3.2
S3.3
S3.4
S3.5
Schedule Product Deliveries
Receive Product
Verify Product
Transfer Product
Authorize Supplier Payment
Copyright © 2006, Business Process Trends
www.bptrends.com
43
SCOR Material Flow Diagram
(S1, D1) (SR1,DR1,DR3) Manufacturing Warehouse (S1, S2, M1, D1) (SR1,SR3,DR3) Cu stome r
(S1) (SR1,SR3) Warehouse (S1, D1) (SR1,DR1,DR3) Other Suppliers (D1)
Custome r
European Supplier (S1) (D2) (SR1,SR3) (DR1)
Warehouse (S1, D1) (SR1,DR1,DR3) Latin American Suppliers (D1)
Customer
Warehouse (S1, D1) (SR1,DR1,DR3)
Cu sto me r
(S1) (SR1,SR3)
Copyright © 2006, Business Process Trends
(S1) (SR1,SR3)
www.bptrends.com
44
SCOR As Is Process Diagram P1
P1
P3 P2
European RM Supplier
S2
P3 P4
M2
P1
P2
P4
P2
P4
D1
S1
D1
S1
DR1
SR1
DR1
SR1
DR3
SR3
D2 S2
DR1
Key Other RM Suppliers
S1
M1
D1
RM Suppliers
Copyright © 2006, Business Process Trends
SR1
M1
S1
ALPHA
www.bptrends.com
Alpha Regional Warehouse
Customer
45
SCOR’s Level 1 Measures
Customer Facing Attributes
Performance Attribute
Performance Attribute Definition
The performance of the supply chain in delivering: the correct product, to the correct Supply Chain Delivery place, at the correct time, in the correct Reliability condition and packaging, in the correct quantity, with the correct documentation, to the correct customer. Supply Chain The velocity at which a supply chain provides Responsiveness products to the customer. Supply Chain Flexibility
The agility of a supply chain in responding to marketplace changes to gain or maintain competitive advantage.
Level 1 M etric Delivery Performance Fill Rates Perfect Order Fulfillment Order Fulfillment Lead Times Supply Chain Response Time Production Flexibility
Internal Facing Attributes
Cost of Goods Sold Supply Chain Costs
The costs associated with operating the supply chain.
Total Supply Chain Management Costs Value-Added Productivity W arranty / Returns Processing Costs
Supply Chain Asset Management Efficiency
The effectiveness of an organization in managing assets to support demand satisfaction. This includes the management of all assets: fixed and working capital.
Copyright © 2006, Business Process Trends
Cash-to-Cash Cycle Time Inventory Days of Supply Asset Turns
www.bptrends.com
46
SCOR Manual: M2.3 (1) Process Element: Produce and Test Process Element Definition
Process Element Number: M2.3
The series of activities performed upon sourced/in-process product to convert it from the raw or semi-finished state to a state of completion and greater value. The processes associated with the validation of product performance to ensure conformance to defined specifications and requirements.
Performance Attributes
Metric
Reliability
Ratio Of Actual To Theoretical Cycle Time Scrap expense In-process failure rates Yields Produce and Test Cycle Time None Identified Warranty costs as % of (S+M+D) costs Total Production Employment Produce and Test costs / unit Capacity utilization Asset Turns
Responsiveness Flexibility Cost Assets
Copyright © 2006, Business Process Trends
www.bptrends.com
47
SCOR Benchmarks Provide Instant ROI Supply Chain SCORcard
EXTERNAL
Overview Metrics SCOR Level 1 Metrics
Industry Benchmarks Actual
Parity
Advantage
Superior
Delivery Performance to Commit Date
50%
85%
90%
95%
Supply Chain Reliability
Fill Rates
63%
94%
96%
98%
0%
80%
85%
90%
$30M Revenue
Responsiveness
Perfect Order Fulfillment Order Fulfillment Lead Times Supply Chain Response Time
35 days
7 days
5 days
3 days
$30M Revenue
97 days
82 days
55 days
13 days
Key enabler to cost and asset improvements
Production Flexibility
45 days
30 days
25 days
20 days
Total SCM Management Cost
19%
13%
8%
3%
$30M Indirect Cost
Warranty Cost
NA
NA
NA
NA
NA
NA
$156K
$306K
$460K
NA
119 days
55 days
38 days
22 days
NA
196 days
80 days
46 days
28 days
$7 M Capital Charge
2.2 turns
8 turns
12 turns
19 turns
NA
Flexibility
INTERNAL
Cost
Assets
Value Added Employee Productivity Inventory Days of Supply Cash-to-Cash Cycle Time Net Asset Turns (Working Capital)
Copyright © 2006, Business Process Trends
www.bptrends.com
Value from Improvements
48
Balanced Scorecard and SCOR Measures r’ s rte gic o P ate s r S t e me p t Th nc e Co
d ce lan card a B re o pts S c nc e Co
OR c e S C ma n s r e rfo ut Pe ttrib A
Copyright © 2006, Business Process Trends
www.bptrends.com
49
Marketing
SCOR+ Towards a Complete Value Chain MCOR Plan
Analyze
Develop
Design
Integrate
Market
R&D
DCOR Research
Procurement
Plan
SCOR Source
Manufacturing
Plan Make
Sales & Distribution
CCOR Contact
Deliver
Amend
Return
Assist
Copyright © 2006, Business Process Trends
www.bptrends.com
Service
Plan
Revise
Relate
Sell
50
Kaplan and Norton’s Balanced Scorecard ECI's Balanced Business Scorecard Internal Business Perspective
Financial Perspective Goals
Measures
Goals
Measures
Survive
Cash flow
Technology capability
Manufacturing geometry vs. competition
Succeed
Quarterly sales growth & operating income by division
Manufacturing experience
Cycle time, Unit cost, Yield
Prosper
Increased market share and ROE
Design productivity
Silicon efficiency, Engineering efficiency
New product introduction
Actual introduction schedule vs. plan
Customer Perspective
Innovation & Learning Perspective Goals
Measures
Goals
Measures
Technology leadership
Time to develop next generation
New products
Percent of sales from new products, Percent of sales from proprietary products
Manufacturing learning
Process time to maturity Response supply
On-time delivery (defined by customer)
Product focus
Percent of products that equal 80% sales
Preferred supplier
Share of key accounts' purchases, Ranking by key accounts
Time to market
New product interdiction vs. competition
Customer partnership
Number of cooperative engineering efforts
Copyright © 2006, Business Process Trends
www.bptrends.com
51
Scorecard, Processes, & Process Managers
Copyright © 2006, Business Process Trends
www.bptrends.com
52
Branching Scorecard Systems
Copyright © 2006, Business Process Trends
www.bptrends.com
53
What is the Organizational Structure?
Copyright © 2006, Business Process Trends
www.bptrends.com
54
Coordinating the Management of Processes CEO Process Architecture Committee
Widget Process SVP Widget Process
Process Management Team
Sales Department VP Sales
Executive Committee
Manufacturing Department
Delivery Department
VP Manufacturing
Sales Supervisor
Manf. Supervisor
Sales Process
Manufacturing Process
VP Delivery
Delivery Supervisor
Delivery Process
Customer
Widget Value Chain
Copyright © 2006, Business Process Trends
www.bptrends.com
55
Your BPM Driver • Any major Enterprise Level BPM effort requires the strong support of the CEO • In most companies, a major BPM effort is organized around a “Driver” that gives impetus and focus to the effort – Winning the Baldrige Award – Establishing a More Efficient Performance Measurement System – Embracing Six Sigma Effort Companywide – Overtaking a Competitor – Installing a Single Instance of SAP Copyright © 2006, Business Process Trends
www.bptrends.com
56
The BPM Group Mission I: Strategy/Org Model: Plan to Create Mission II: BP Architecture: Plan to Create
BPM Group BPM Group Processes:
Create and maintain the enterprise business process architecture (Maintain BPM repository)
Mission III: Align Resources: Plan to Create Mission IV: Perf Measurement System: Plan to Create
Mission V: Management System: Plan to Create
Mission VI: BPM Group: Plan to Create
Help create, maintain and manage the process performance system
Help create and support the process manager system (Create/Maintain BP management training)
Maintain up-to-date BP architecture Use architecture to analyze, prioritize & scope process change options Report on corporate process performance Identify problems & recommend solutions Manage managers BP scorecards & evaluations BP manager job descriptions Train all new managers in business process techniques
Recruit, Train, Manage BP Change Professionals
Acquire BPM tools
(Standardize on methodologies, BP tools)
Manage BP change projects
Manage Risk / Standards Reporting & Documentation
Copyright © 2006, Business Process Trends
www.bptrends.com
Prepare reports for Sarbanes-Oxley & ISO 9000 documentation
57
US Federal Enterprise Architecture Framework (FEAF) Strategic Outcomes
The FEAF Performance Reference Model (PRM)
Value Mission & Business Results y y y
Customer Results
Services for Citizens Support Delivery of Services Management of Government Resources
Customer Benefit Service Coverage Timeliness & Responsivness Service Accessibility
y y y y
Value Processes and Activities y y y
Quality Security & Privacy Management Innovation
y y y
Financial Productivity & Efficiency Cycle Time & Timeliness
Value
Technology
Human Capital
y y y y y y y
Financial Quality Efficiency Information Reliability Availability Effectiveness
Other Fixed Assets
INPUTS
Copyright © 2006, Business Process Trends
www.bptrends.com
58
Trends in Business Process Management • • • • •
The BPM Market Today Level 1: Enterprise Level Trends Level 2: Process Level Trends Level 3: Implementation Level Trends Where Do We Go Next?
Copyright © 2006, Business Process Trends
www.bptrends.com
59
Key Process Level Considerations 2.1 The Process Level Focuses on Projects 2.2 Approaches to Process Change 2.3 Process Change Gaps 2.4 Specific Problems and Analytic Techniques 2.5 Lean Six Sigma
Copyright © 2006, Business Process Trends
www.bptrends.com
60
The Process Level Combines Projects and Methodologies
Copyright © 2006, Business Process Trends
www.bptrends.com
61
BPR Methodologies
Copyright © 2006, Business Process Trends
www.bptrends.com
62
The BPTrends Associates BPM Methodology
Copyright © 2006, Business Process Trends
www.bptrends.com
63
A Successful Project Needs to Be Managed
Copyright © 2006, Business Process Trends
www.bptrends.com
64
High-Level Process Problems
Process A
Inputs
Outputs
"Supplier" Contract
"Customer" Contract Subprocess A3
Copyright © 2006, Business Process Trends
www.bptrends.com
65
Mid-Level Process Problems Process Measures: External Measures: Quality and Timeliness Internal Measures: Output-to-Cost and Cycle Time Process A
Inputs
Outputs
"Supplier" Contract
"Customer" Contract
Subprocess A-3
5. Smooth Flow Without Unnecessary Activities 6. Logical Decision Points and Clear Business Rules 7. Minimum Time for Activities and for Handoffs 8. All employees know and perform necessary activities 9. Automation used were helpful and responsive where used 10 Subprocess performance is well defined and acceptable Copyright © 2006, Business Process Trends
www.bptrends.com
66
Activity and Task-Level Process Problems
Copyright © 2006, Business Process Trends
www.bptrends.com
67
The Heart of Redesign: Finding and Eliminating Gaps
Copyright © 2006, Business Process Trends
www.bptrends.com
68
A Problem is a Difference Between What Is and What is Desired
Copyright © 2006, Business Process Trends
www.bptrends.com
69
Defining the Nature of the Gap
Copyright © 2006, Business Process Trends
www.bptrends.com
70
A Simple Example
Product Production Cycle Currently Takes 5 Hours
Measures of As-Is Process’s Performance
Performance Gap
Desired Measures of To-Be Process’s Performance
Redesigned or To-Be Process
Existing or As-Is Process
Management Wants Process Outputs in Half the Time
Capabilities Gap What is Done What Will Need to Now Be Done Analysis Techniques Used to Define the Gap A Time Study Shows that Work Often Goes to Inventory Between Workstations and Stays There on Average 3 Hours Redesign Techniques Used to Modify the Capabilities of the Process Lean Technique: Streamline Flow by Reorganizing Steps to Eliminate Moving Work to Inventory Copyright © 2006, Business Process Trends
www.bptrends.com
71
You Keep Working at Eliminating the Gap
Copyright © 2006, Business Process Trends
www.bptrends.com
72
The Five Areas of a Project Scoping Diagram Information that will be referenced by processes Methods and Rules that will guide the processing 4 Events – Triggering & Completion Guides Inputs to Process: 3 Material to be transformed Information to be processes States to be changed People
5
I n p u t s
1
The Processes/ Subprocesses -in-Scope And the Management of the Same
O u t p u t s
2 Results of Processing
Enablers People assigned to process Technologies used in process Facilities that are used
Copyright © 2006, Business Process Trends
www.bptrends.com
73
An IGOE is a Variation on a Cause-Effect Diagram Process Inputs
Process Outputs
Process Flow Process Management
3
2
1 Effect:
Problem
Causes
5
Enablers
4
Guides
We simply find it easier to write in blacks than on fish bones and we can use the space in the center for simple flow diagrams Copyright © 2006, Business Process Trends
www.bptrends.com
74
The Work of a Day-to-Day Process Manager
Copyright © 2006, Business Process Trends
www.bptrends.com
75
Processes Components & Interface Requirements
Copyright © 2006, Business Process Trends
www.bptrends.com
Business Process Notation Rummler-Brache, UML Activity Diagrams, BPMN
Copyright © 2006, Business Process Trends
www.bptrends.com
77
Six Sigma at the Process Level: DMAIC 1. Define
2. Measure
3. Analyze
4. Improve
5. Control
Plan Project
Identify Measures
Analyze Data
Implement Measurement
Document and Maintain
1. Define project 2. Identify customer requirements 3. Document process 4. Set goal
1. Identify Measures 2. Define measures 3. Develop & test data collection methods 4. Define baseline measures
1. Analyze date 2. Explore possible causes and test hypothesises 3. Identify causes
1. Document and keep score of results
1. Select a soluton 2. Pilot test solution 3. Implement full scale solution
1-2 wks.
ongoing 1-2 wks.
4-8 wks 2 wks.
34.13%
13.06% -3 0.13%
Copyright © 2006, Business Process Trends
-2
-1
mean 68.26% 95.46% 99.73%
+1
+2
www.bptrends.com
2.14%
0.13%
+3
78
What’s Impressive About Six Sigma • The results it can achieve when it enters the organization with serious support from the CEO – Welch at GE tied each senior manager’s bonus to Six Sigma results
• The rigor the program creates: Master Black Belts, Black Belts, Green Belts, etc. • The techniques that have grown up around Six Sigma • Its “sales” approach is based on calculations of money saved – A black belt costs $50K to train and will generate $250K of saving /year
• Despite the results there is no industry standards group Copyright © 2006, Business Process Trends
www.bptrends.com
79
Lean and Six Sigma • Six Sigma – Maximizing Process Quality & Consistency – – – – –
Began at Motorola in mid-Eighties DMAIC for Process Improvement DMADV for New Process Design Design For Six Sigma (DFSS) TRIZ for Innovation
• Lean (Kaizen)– Smoothing Flow & Minimizing Waste – The Machine That Changed The World by James Womack, Daniel Jones & Daniel Roos (Harper, 1990) – Flow Kaizen – Focus on improving high level flow – Process Kaizen – Focus on the elimination of waste
Copyright © 2006, Business Process Trends
www.bptrends.com
80
Lean Flow Kaizen: Value-Stream Mapping
Copyright © 2006, Business Process Trends
www.bptrends.com
81
Trends in Business Process Management • • • • •
The BPM Market Today Level 1: Enterprise Level Trends Level 2: Process Level Trends Level 3: Implementation Level Trends Where Do We Go Next?
Copyright © 2006, Business Process Trends
www.bptrends.com
82
Implementation Level Considerations 3.1 Implementation 3.2 A Very Robust BP Tools Market 3.3 BPMS Systems Development 3.4 Business Rules 3.5 The Evolution on ERP Systems 3.6 Process Performance Monitoring Systems Development 3.7 Implementation Level Standards
Copyright © 2006, Business Process Trends
www.bptrends.com
83
Implementation is Managing the Work of Others
Copyright © 2006, Business Process Trends
www.bptrends.com
84
Types of Process Implementation Depending on the project, there will be different needs for changes: • Changes in Product Design or Facilities • Implementing Employee Systems Changes – Job Definitions – Training Programs – Motivation/Incentive Systems, etc. • Implementing IT System Changes – BPM Systems/Workflow/EAI – Rule-Based Management Systems – Applications Purchased (ERP-CRM)/Developed • Implementing Process Governance Changes • Process Owner Training • Process Performance Monitoring Systems • Business Process Outsourcing
Copyright © 2006, Business Process Trends
www.bptrends.com
85
Business Process Software Products Graphics Tools
Organization Modeling Tools Business Process Architecture Tools
BP Languages
Statistics Tools
BP Modeling Tools
Process Simulation Tools
Modeling Capability + Repository
Business Rule Management Tools
XML DSLs and BPEL, BPML
Tool for creating, storing and using business rules.
Universal BP Repository
BPM Suites
EAI Tools
Workflow Tools
Application Servers
Software Development Suites
Modeling Capability + BPM Engine
BPM Applications Modeling Capability + BPM Engine + Application Components
BP Monitoring Tools Modeling Capability + Ability to Monitor Runtime Process+ Dashboard Capability
Database capable of storing information from all the BP tools.
Packaged/ Enterprise Application Suites
BI and Data Warehouse Products
Copyright © 2006, Business Process Trends
www.bptrends.com
86
The Architecture of a Serious Modeling Tool Interface: Ability to Access Models Via a PC or a Browser
Index to All Models, Processes, Attributes, etc.
Can support multiple notations (e.g. BPMN)
Multiple Modeling Multiple Modeling Screens Multiple Modeling Screens Multiple Modeling Screens Screens
Can support standard interchange metamodel (or repository model) (e.g. CIF, OMG Process Metamodel)
Simulation Environment
Product Metamodel
Product Repository (Database)
Copyright © 2006, Business Process Trends
www.bptrends.com
87
Business Process Management Systems • • •
• •
BPMS (Not, BPM, please) Much confusion, spread in part by Smith & Fingar’s Business Process Management: The Third Wave (Megan-Kiffer, 2003) In essence, we are talking about a successor to Workflow and EAI technologies that make it possible to automate the execution of business processes The underlying assumption is that IT resources ought to be organized to implement explicit business processes The good news is that it’s now driving a lot of interest in BPM (used in its more generic sense).
Copyright © 2006, Business Process Trends
www.bptrends.com
88
A BPM Suite
Logical Description of the Process
Software Tool That Displays a Graphical View of a Process
A
B
C
D
Software Tool (Engine) That Manages Links Between Diagram and Impelementation
BPMS Engine
Physical Implementation of the Process
E
Software Component B
Software Component C
Enterprise Application Module D
Enterprise Application Module E
For more information, check the BPTrends BPM Suites Report – www.bptrends.com Copyright © 2006, Business Process Trends
www.bptrends.com
89
The Key is Controlling the Business Process Business Analyst Interface
Logical Description of the Process Software Tool That Displays a Graphical View of a Process
C
BPMS Engine
A
B
E Software Tool (Engine) That Manages Links Between Diagram and Impelementation
D User Interface Software Component C
Enterprise Application Module D
Software Component B
Enterprise Application Module E
Physical Implementation of the Process
Copyright © 2006, Business Process Trends
www.bptrends.com
90
Generic Model of a BPMS Product Knowledge Specific Rule Sets or Ontologies
Specific Business Models
Complete Process Frameworks
Utilities Developers
Process Modeling Environment
Development Environment
Process Modeling Environment
Management Environment
Process Managers
Engines Workflow Engine
Rules Engine
EAI Engine
Middleware/Application Server Eg. J2EE Server: WebSphere
Employees
Copyright © 2006, Business Process Trends
Eg. Windows .NET Server: BizTalk
Eg. ERP Server: NetWeaver
BPM Repositories /Databases
Software Applications
www.bptrends.com
91
BPM Systems and SOA •
•
• •
Service Oriented Architectures (SOA) refer to systems that use the Web and XML protocols to dynamically call software components as they are needed SOA is still building up momentum in the US and there are only a few large applications that truly implement this approach SOA will continue to evolve, however, and BPM systems will be key to developing applications We are approaching the point where companies will have to share business process descriptions to achieve their goals
Copyright © 2006, Business Process Trends
www.bptrends.com
92
BPM and SOA: Necessary Conjunction
Copyright © 2006, Business Process Trends
Figure After a BPTrends Column by Mike Rosen, Jan. 2006 93 www.bptrends.com
Aligning Processes and Business Rules The Business Rules Management Perspective
The Business Process Management Perspective
Strategy or Enterprise Level Organization Policies
Organization Goals Strategy
Organization Compliance
Business Rules Level
and Goals
s roces ess P Busin
Human Resource Architecture
Rules Embedded in Manuals and Process Documentation
Organization Performance BP Architecture
Organization Ontology and Specific Business Rules Specific Set of Rules
Implementation (Uses of Rules)
Strategy or Enterprise Level
Business Process Level
BP Analysis & Redesing
ic Specif y it v ti Ac
IT Architecture
Rules Embedded in Software Applications
ure hitect IT Arc cture rchite A e c r ou n Res Huma b y Activit nt eme Manag Plan ts, Budge Plans, urce o s e R , Hiring tion, Alloca k, ac Feedb es quenc e s n o C
Copyright © 2006, Business Process Trends
y Activit nt reme u s a e M Plan
y/ Activit ance rm o rf Pe ring o it n o M m te s y S
Jo Design
n-IT Huma ce rf te In a Model
ns Scree s, and Job Aid g s Trainin , Report ms Progra e dg Knowle ent em Manag m Syste
ation Applic cture Archite ation Applic s n ig s De de and Co
Data ecture Archit
Implementation Level
rk Netwo cture Archite
ase Datab s and n ig Des Data ement Manag s te Sys m
re Us ardwa H d n nt a al Pla Physic
l Logica Level
ology Techn cture Archite areArc Hardw
al Physic Level re hitectu
ed
www.bptrends.com
94
A Little History Review
Copyright © 2006, Business Process Trends
www.bptrends.com
95
The Business-Expertise Continuum
Business Processes Often Include a Mix of Business and Expert Rules Business Expert Rules Rules Business Knowledge (Business Policies) Based on Policies Derived Top-Down Derived Logically Relatively Straight-Forward Do Not Usually Involve Complex, Deep Hierarchies of Knowledge Objects
Copyright © 2006, Business Process Trends
“Knowledge Workers”
Expert Knowledge (Not formalized)
Decision Systems and Aids That Capture Limited Modules of Expertise
Based on Experience Derived Case by Case Derived Empirically Relatively Convoluted Usually Involves Complex, Deep Hierarchies of Knowledge Objects
www.bptrends.com
96
BPM, ERP and CRM • Davenport’s Mission Critical (HPR Press, 1999) • Most major companies have installed at least some packaged applications (ERP, CRM) • Many have spent 100s of millions and many are disappointed with the results • Most BP consultants think the difference between likely success and likely failure lies with how well understood and modeled a company’s business processes are before the ERP effort begins • Letting IT undertake ERP – as a technology effort – without first getting the business processes organized is a recipe for failure
Copyright © 2006, Business Process Trends
www.bptrends.com
97
A Customized ERP Suite
Copyright © 2006, Business Process Trends
www.bptrends.com
98
Reality: Multiple Processes and ERP Instances
Copyright © 2006, Business Process Trends
www.bptrends.com
99
Standardizing Processes to Standardize Instances
Copyright © 2006, Business Process Trends
www.bptrends.com
100
AP is a Process-Focused Company
Copyright © 2006, Business Process Trends
www.bptrends.com
101
A Set of ERP Modules Managed by BPMS
Copyright © 2006, Business Process Trends
www.bptrends.com
102
BPM Suites vs. BPM Applications • •
• •
Vendors will evolve from generic tools to applications Meantime ERP and CRM vendors are trying to incorporate BPM tools – SAP’s NetWeaver – Microsoft’s BizTalk Server – Oracle’s BPM Suite One Way or Another We Are Going to Move Beyond the Rigidity of the Current Line of Enterprise Applications In the Process Managers Will Get a Lot More Flexibility and Control
Copyright © 2006, Business Process Trends
www.bptrends.com
103
SAP Architecture - I SAP Telecommunications Business Architecture Enterprise Management
Strategic Enterprise Management
Business Analytics
Business Intelligence & Decision Support
Accounting
Workforce Planning & Alignment
Customer Relationship Management
Marketing & Campaign Management
Sales Management
Dealer Management
Customer & Retention Management
Customer Care
Sales & Order Management -Standard Products Sales & Order Management -Customer Solutions Service Assurance
Product Selling
Sales Cycle Management
Contract Management
Site Survey & Solution Design
Service Agreements
Contract Management
Customer Trouble Reporting
Order Management
Project Management
Service Activation
Order Management & Fulfillment
Customer Trouble Management
Provisioning
Trouble Resolution
Customer Financials Management
Credit Management
Pre-Billing
Convergent Invoicing
eBPP
Receivables & Collections Management
Dispute Management
Supply Chain Management
Supply Network Design
Demand & Supply Planning
eProcurement
Production Planning & Execution
Supply Chain Coordination
Warehouse Management
Network Lifecycle Management
Value Added Services
Business Support
Requirements Planning
Demand Planning
Content & Intellectual Properites Management Human Resources Operations Sourcing & Deployment
Advertising Management
Travel Management
Copyright © 2006, Business Process Trends
Investment Management
Network Design & BUild
Mobile Business & Wireless ASP
Financial Supply Chain Management
Treasury/Corporate Finance Management
www.bptrends.com
Operation & Maintenance
eLearning
Real Estate
104
The Chordiant BPMS Suite Customer Mail/Telephone
Internet Face-to-Face
Chordiant Interfaces for Employees Using Suite
Chordiant Marketing
Chordiant Retail Channel
Chordiant Contact Center
BPMS Engine Marketing Processes Chordiant Process Designer
Call Center Process 11 Call Center Process Call Center Process 111 Call Center Process Call Center Process Call Center Process 11 Call Center Process Call Center Process Marketing Process 11
MP Component 5
Uses Corticon Rules Engine
MP MP MP MP MP 11 Component Component Component 1 Component Component 11
Retail Channel Processes
Contact Center Processes
Call Center Process 11 Call Center Process Call Center Process 111 Call Center Process Call Center Process Call Center Process 11 Call Center Process Call Center Process Retail Channel Proc.11
Call Center Process 11 Call Center Process Call Center Process 111 Call Center Process Call Center Process Call Center Process 11 Call Center Process Call Call Center Center Process Process11
MP Component 8
MP MP MP MP MP 11 Component Component Component Component Component111
MP Component 2
Chordiant Straight Through service Processing
MP MP MP MP MP 11 Component Component Component Component Component111
Most Software Components Are From Chordiant, But the Suite Can Just as Easily Use Other Components With Their Own Databases
Copyright © 2006, Business Process Trends
www.bptrends.com
105
Process Monitoring (BAM) vs. Value Chain Monitoring
Copyright © 2006, Business Process Trends
www.bptrends.com
106
The OMG’s Model Driven Architecture ComputationIndependent Model (CIM) Created by Business Analysts to Describe Business
CIM >> PIM Mapping
PlatformIndependent Model (PIM) Created by Architect/ Designer to Describe Archtiecture
PIM >> PSM Mapping
Platform-Specific Model (PSM)
Created by Developer or Tester to Implement Solution
Copyright © 2006, Business Process Trends
www.bptrends.com
PSM >> Code Mapping
Code
107
The OMG’s BP Metamodels MOF Meta Object Facility XMI
UML 2.0
Ontology Metamodel
BPMN
Various BP Tools
Business Process Definition Metamodel
J2EE
Copyright © 2006, Business Process Trends
BPEL
Business Rules Metamodel
Various BP Tools
www.bptrends.com
108
BPEL • The Business Process Execution Language (BPEL) – a BPMS engine (for EAI) • Initially proposed by BEA, IBM, and Microsoft, it is currently being formalized by OASIS. • It provides the basis for managing/integrating software for BPMS products. • It doesn’t support integrating people into BPMS. • It is supported by several BPMS vendors • Open source versions are becoming available
Copyright © 2006, Business Process Trends
www.bptrends.com
109
Market Consolidation •
3-06
BEA (Middleware) buys Fuego (BPM engine)
• • • •
12-05 10-05 9-05 7-05
• •
6-05 4-05
Intalio (BPM Engine) buys FiveSight (BPEL) Metastorm (Workflow) merges with CommerceQuest (EAI) Fair Issac (Rules) buys RulesPower (Rules) Seagull Software (Middleware) buys Oak Grove Systems (BPM engine) Sun (Middleware) buys SeeBeyond (EAI) TeleLogic (Modeling) buys Popkin (BP modeling)
• • •
6-04 6-04 4-04
Oracle (Packaged applications) buys Collaxa (BPEL) TIBCO (EAI) buys Staffware (Workflow) Adobe (Documents) buys Q-Link (Workflow)
•
9-02
IBM (Middleware) buys Holosofx (BP Modeling)
Copyright © 2006, Business Process Trends
www.bptrends.com
110
Trends in Business Process Management • • • • •
The BPM Market Today Level 1: Enterprise Level Trends Level 2: Process Level Trends Level 3: Implementation Level Trends Where Do We Go Next?
Copyright © 2006, Business Process Trends
www.bptrends.com
111
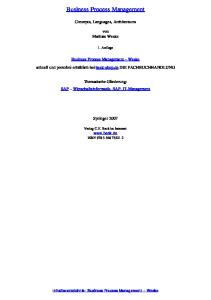
Why A Process-Centric Focus? • Process is the cornerstone of an effective strategy • Processes are the most practical and effective way of managing an organization • Process Management is the best response to rapid change • In many companies Process Change Initiatives are out of control • New requirements and techniques make Business Process Management even more compelling
Copyright © 2006, Business Process Trends
www.bptrends.com
112
New Slide: Uptake of BP Technologies
Innovators Companies that pursue new technologies aggressively to gain early advantage
Early Adopters
Early Majority
Companies that pursue new approaches aggressively to gain early advantage
2 Gen BP
Companies that wait for a new approach to prove itself and then move quickly
Moore’s Chasm
Late Majority Companies that wait until the new approach is well established and there is lots of support
Many new approaches prove too difficult to use relative to their benefits and simply disappear
3 Gen BP After Geoffrey A. Moore. Crossing the Chasm (HarperBusiness, 1991)
Copyright © 2006, Business Process Trends
www.bptrends.com
113
Where Do You Start? • There is no one right place to start • Some organizations have been working on process change for years. Others are new to process management. • Some have Six Sigma. Others have IT groups that are active in process redesign. • Some work on projects and others work on enterprisewide process management systems. • You start from where you are at. • You start at the point where your senior management is willing to begin. Copyright © 2006, Business Process Trends
www.bptrends.com
114
For More Information •
[email protected] – To contact me. • www.bptrends.com – Monthly newsletter and a wide variety of white papers – more detail on everything I’ve discussed
Copyright © 2006, Business Process Trends
www.bptrends.com
115
Books to Read • •
• • • • • •
Michael Porter on Competitive Advantage & Strategy (Completive Strategy, HBP, 1980; Competitive Advantage, HPR, 1985) Geary Rummler on Organization Mapping, the Organization as a System, and on Process Management & Measurement (Improving Performance, Jossy Bass, 1990; Serious Performance Consulting, ISPI, 2004) Roger Burlton on Stakeholder Analysis. (Business Process Management, SAMS, 2002) Peter Bolstorff on SCOR and the use of Frameworks (Supply Chain Excellence, AMACOM, 2003) Better, take a SCOR workshop (www.supply-chain.com) Anything Joe Francis has published on BPM Groups and the use of Frameworks (www.BPTrends.com column) APQC BPM Benchmarking Reports Paul Harmon on putting it all together (Business Process Change, Morgan Kaufmann, 2003 and BPTrends articles)
Copyright © 2006, Business Process Trends
www.bptrends.com
116
Copyright © 2006, Business Process Trends
www.bptrends.com
117
Case Study: Boeing Airlift & Transit • Boeing A&T has one of the most sophisticated integrated business process management systems in existence • They started creating it in in 1993 and it took four years • In 1998 they won the US Government’s Baldrige Award
Copyright © 2006, Business Process Trends
www.bptrends.com
118
Process Governance at Boeing A&T Group The Boeing Company Integrated Defense Systems
Commercial Airplanes
Phantom Works
Air Force Systems
Connexion by Boeing
Shared Services
Boeing Capital Corporation
Air Traffic Management
Airlift and Tanker Programs C-17 Program
767 Tankers Program
Derivitive Programs
Advanced A&T
HQ in Long Beach, CA Copyright © 2006, Business Process Trends
www.bptrends.com
119
Boeing A&T Identified 300+ Processes Boeing Airlift & Tanker Program: C-17 Program Value Chain Lead the Enterprise Ensure Organizational Effectiveness
Ensure Integration of Strategic Bus. & Functional Planning
Perform Integrated Bus Financial Mang.
Ensure Quality & Mission Assurance
Perform SelfGovernance Insure Continious Improvement
Integrate & Deploy Processes & Procedures
Manage Programs Administer Contracts
Create, Acquire & Grow Business
Manage Program Planning & Execution
Integrate Product/Service Definition Define & Manage Product/Service Requirements
Create Opportunities & New Markets
Plan & Control Product Service Design
Acquire New Business
Concurrently Develop Product/ Service/Build-to/ Buy-to/Support Elements
Maintain/Grow Existing Business
Verify & Validate Product/Service
Minimize Program Risk
Manage IWA Performance
Manage Suppliers
Communicate Positions & Directions
Ensure Customer Satisfaction
Strengthen the Team
Provide Ethics Guidance
Provide Integrated Performance Mang. (Cost & Schedule)
Provide Financial Services
Provide Communicatins Services
Provide Human Resources
Provide Legal Services
Copyright © 2006, Business Process Trends
Provide Supply Support
Produce Product
Manage Material Rqmts
Provide Field Services
Select Source Negoitate & Award Purchase Contracts
Define Production Plan
Provide Retrofit & Modification Services Provide Technical Data
Manage Supplier Performance
Provide Parts, Supplies, GFE & Tools to Assembly
Manage Supplier Quality
Assemble & Deliver Product
Provide Instructional Systems Data & Training
Verify Production Processes
Provide Integrated Support Planning & Management
Manage Supply Base Manage Gov Property
Provide System Support Analysis
Manage Inventory
Provide Enagling Infrastructure
Support Products & Services
Provide Support Equipment Provide Safety, Health & Env. Services Provide Security & Fire Protection Services
Provide Export/ Import Compliance
Manage Facilities & Equipment
Provide Integrated Information Systems & Services
Manage NonProduction Procurement
Provide Flight Operations Services
www.bptrends.com
120
Creating A Process Governance System - 1
Process Governance Committee
Define Value Chains
•
Identify Owner of Each Value Chain
Define Goals/ Measures for Each Value Chain
Assume you have 4 value chains, that 4 value chain owners
Copyright © 2006, Business Process Trends
www.bptrends.com
121
Creating A Process Governance System - 2 Assume each value chain has 8 major processes, that's 32 major process owners.
Process Governance Committee
Define Value Chains
Identify Owner of Each Value Chain
Define Goals/ Measures for Each Value Chain
Define Major Processes in a Value Chain
Identify Owner of Each Major Process
Define Goals/ Measures for Each Major Process
Copyright © 2006, Business Process Trends
www.bptrends.com
122
Creating A Process Governance System - 3 Assume each major process has 8 subprocesses, that's 256 subprocess owners.
Process Governance Committee
Define Value Chains
Identify Owner of Each Value Chain
Define Goals/ Measures for Each Value Chain
Define Major Processes in a Value Chain
Identify Owner of Each Major Process
Define Goals/ Measures for Each Major Process
Define Major SubProcesses in a Value Chain
Identify Owner of Each Major SubProcess
Define Goals/ Measures for Each Major SubProcess
Copyright © 2006, Business Process Trends
www.bptrends.com
123
Each Boeing A&T Process Owner Defines a Process PR O CESS FLO W CH ART
A p p lie s T o : < B u s. U nit/P ro g ra m N a m e H e re > Who In p u t M a jo r T a s k s fo r: P ro ce s s O w n e r:
R e s p o n sib le O rg an iza tio n o r In d iv id u a ls 3 .08 .0 4 R ele ase P u rc h ase R eq u isitio n s an d W ork O rd ers
O u tp u t P ro c e s s N u m b e r: 5 .0 2 C re a tio n D a te : < O rig in D a te H e re > R e vis io n D a te : < R e v isio n D a te H e re >
N e go tia te a n d A w a rd P u rc h a s e O rd e r < P ro ce ss O w n e r N a m e H e re >
Pu rch a se R equ isition
S u p pliers
S u pp lie r P ro p osa l
P ro g ra m E n gin eer
T ec h nica l E va lu a tio n
C ost A n a ly st
C o st/P ric e A n a lysis
P u rc hase O rd er
b
R eceive and E valuate Prop osa l fro m Supp lier a nd D eve lo p N ego tia tion P la n
Iss ue U nde finitize d P urc has e O rd er
B u yer
a
N egotiate C on tra c t R equire m e nts w ith S up plier
a S olicit a nd E v alua te B ids fr o m S upp lie rs and Selec t S upplier
D eve lop Proc ure m e nt File to R e quir em e nts
Y
N R eceiv e P urc ha s e R eq uisition
Proc u rem en t M ana g em en t
E valua te Purc hase R equis itio n
P roc ure m e n t C o m petitive ?
Is s ue D efinitize d Purcha se O rder
Y
P ro c urem en t File
N ego tia tio n P lan Adeq ua te?
N
N Proc u rem en t A d visor
Procure m ent File C om p lia n t?
b
Y R
T O T A L T IM E
E S T . T IM E
LEG END In pu t/O u tp u t
T ask
D e c is io n
a
C o n n e cto r
R
R e c ord
C o n trol P oin t
M D -71 4 8 (0 2 JU L 2 0 04 ) R E V IS E D
Copyright © 2006, Business Process Trends
www.bptrends.com
124
Boeing Airlift & Transport Measures Requirements
Key Performance Categories Quality
Meet or Exceed Customer Expectations
Timeliness
Measure of success in meeting a customer commitment
Efficiency
Measure of output that a process produces in relation to costs
CycleCycle-Time
Measure of time between a customer request and delivery of the product or service to the customer
Process Performance Attain Superior Business Results
Copyright © 2006, Business Process Trends
Measure of conformance or non-conformance (defects) to requirements or expected performance
www.bptrends.com
125
Aligning External, Output Measures
Boeing A&T C-17 Value Chain
Boeing Suppliers
Core Process 1
SubProcess 2.1
Inputs
Copyright © 2006, Business Process Trends
Core Process 2
The US Air Force
Core Process 3
SubProcess 2.2
Outputs
SubProcess 2.3
(Supplier of 2.3)
Inputs
(Customer of 2.2)
www.bptrends.com
126
Aligning External Measures With Contracts
Boeing A&T C-17 Value Chain
Boeing Suppliers
Core Process 1
Core Process 2
The US Air Force
Core Process 3
These Contracts Assure Vertical Alignment
SubProcess 2.1
Inputs
SubProcess 2.2
Outputs
SubProcess 2.3
(Supplier of 2.3)
Inputs
(Customer of 2.2)
These Contracts Assure Horizontal Alignment Copyright © 2006, Business Process Trends
www.bptrends.com
127
Boeing A&T Monthly Manager Feedback Process Performance Assessment 02 03 J
F
M
A
M
J
J
A
S
O
N
D
ND ND 1.5 2.0 2.0 2.0 1.5 1.5 Quality (1X)
Efficiency (1X) Good
100
90 Completed Items per Man-hour
90
Percent Compliant Orders
80 70 60 50 40 30
80 70 60 50 40 30
20
20
10
10
Assessment
Good
100
02 03 J
F
M
A
M
J
ND ND 1
2
2
2
2
2
J
A
S
Copyright © 2006, Business Process Trends
O
N
D Assessment
02 03 J
F
M
A
M
J
ND ND 2
2
2
2
1
1
www.bptrends.com
J
A
S
O
N
D
128
Results of Boeing A&T Governance Effort
7
Malcolm Baldrige Range
6
Performance Factor
CalQED
Daedalian
Baldrige
5 X
7.5 X
17 X
120 Aircraft Decison
Largest Multi-year Contract
Flex Sustainment
+10 Days
+25 Days
+40 Days
+20 Days
+60 Days +100 Days +204 Days +107 Days* Schedule
442 Days
380 Days
374 Days
349 Days
286 Days
268 Days
223 Days
208 Days
Span Time
5.0M
4.0M
2.5M
1.8M
1.4M
866K
707K
644K
535K
Rework/ Repair $
4.2%
4.3%
2.9%
2.5%
2.2%
1.9%
1.4%
1.4%
1.1%
COQ
100
80
50
17
12
8
6
10
15
Delivery Waivers
58%
58%
67%
100%
92%
100%
100%
100%
100%
100%
Systems
1.7
1.6
2.3
2.9
3.3
3.4
4.1
4.2
4.1
4.2
CPAR
'92
'93
'94
'95
'96
'97
'98
'99
'00
'01
KEY
5 4 3 2 1 0
Collier
18 X
15 C-17 add-on C32/C40 +60 appropriation
IW Finalist
Awards
31 X
50X+
RONA
UK Order
UK1-4 Deliveries
Milestones
*Days ahead of schedule to USAF decreased due to an insertion of four UK planes into the 2001 schedule
Copyright © 2006, Business Process Trends
www.bptrends.com
129
Copyright © 2006, Business Process Trends
www.bptrends.com
130