Arboriculture & Urban Forestry 37(4): July 2011
147
Arboriculture & Urban Forestry 2011. 37(4): 147–151
Tree-related Electric Outages Due To Wind Loading Siegfried Guggenmoos
Abstract. In the aftermath of a wind storm that interrupted service on more than 40% of Puget Sound Energy’s transmission system, the regulator ordered an investigation to evaluate options for hardening the electric system. The initial phase of the study quantified the extent of tree exposure along the transmission system and examined the correlation between various field measurable variables and tree-caused outage frequency. This phase of the work correlated 10 years of wind data with 10 years of outage data. Tree failure rates were calculated and used to model tree-caused outage expectations based on wind speed. Models were developed to assess the outage impact of interventions that reduce the transmission system exposure to trees. Key Words. Electric System Reliability; Reliability Modeling; Tree–Conductor Contacts; Tree Exposure Risk; Tree Risk Quantification; Tree-related Outages; Storm Hardening; Utility Arboriculture; Wind Loading.
Puget Sound Energy (PSE) is a utility providing electric and natural gas service in western Washington, U.S. PSE has about 17,300 kilometers of electric distribution lines and approximately 3,360 kilometers of electric transmission. For the purposes of this study, transmission refers to lines energized at 55, 66, 115, and 230 kilovolts (kV). In December 2006, Puget Sound Energy experienced substantial electric system damage and service interruptions due to gale force winds. Soils were saturated from previous rains and tens of thousands of trees uprooted and fell into power lines and substations (pers. comm. PSE, Hanukkah Eve Wind Storm of 2006, Wikipedia). The 115 kV system was particularly heavily impacted. In the aftermath of this storm, the Washington Utilities and Transportation Commission, or regulator, asked what could and would be done to avoid such extensive damage and prolonged outages in future storm events (pers. comm. PSE). This article reports on work done to examine the relationship between the 1998 to 2007 wind and the tree-related outage experience on PSE’s transmission system. Specifically, as the regulator was concerned about electric system performance during storms, this work sought to make tree-related outage response to wind loading predictable. Utilities are charged with maintaining a reliable electric system and in some cases are financially penalized for failure to meet reliability targets, which is the case for PSE. Consequently, it is important for utilities to understand what is within their control and what conditions will simply overwhelm their system and efforts to provide continuous service. Through this understanding, realistic system performance expectations can be advanced and communicated, creating in the process, common, shared, fact-based expectations.
METHODOLOGY
Two data sets were examined to assess the role of trees in PSE’s service interruption experience. One data set was the out-
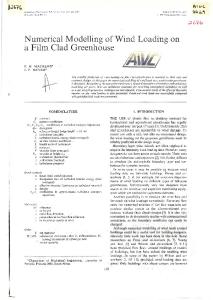
age statistics generated from a combination of equipment function and servicemen consisting of more than 137,000 records. When this system reports a tree-caused outage occurring on a transmission line or on a whole distribution circuit, PSE sends an arborist to the site to gather detailed information, creating the second data set. This information includes: the nature of the outage, either a grow-in or fall-in; tree species; tree location; and condition and type of failure. Outage data generated between 1998 and the end of 2007, for the entire system, both transmission and distribution were examined. The data consisted of more than 34,000 tree-caused outage records and more than 6,200 arborist generated investigation records. The 265 transmission outage statistics, generated from 1998 through 2007, were sorted by county. Wind data was obtained from CompuWeather. The wind data provided maximum wind speeds for all days between January 1, 1998 and December 31, 2007 with sustained winds equal to or greater than 24 km/hr. The data is comprised of approximately 33,000 records. Data was obtained from nine airfields (county): Bellingham International (Whatcom), Friday Harbor (San Juan), Everett Snohomish (Snohomish), Seattle Tacoma International (King), Tacoma Narrows (Pierce), Bremerton (Kitsap), Olympia (Thurston), Stampede Pass (King/Kittitas), and Ellensburg Bowers (Kittitas). There were three counties that either did not have airfields or did not have records for one or more years for the period sampled, in which case, wind data from the closest airfield were used. Classifying both maximum daily wind speed and tree-related service interruptions by county, the relationship between wind speed and tree-related outage incidents, was examined. Graphics to represent the frequency of wind events and outages associated with wind speed were developed. The troughs in the data at 32 and 45 km/hr (Figure 1), and the saw tooth pattern or variability (Figure 2), made it apparent that a modeling approach was needed to smooth out the data. Exponential regression was used to develop algorithms to predict tree-related outage events. ©2011 International Society of Arboriculture
148
Siegfried Guggenmoos: Tree-related Electric Outages Due to Wind Loading
Tree-related outage frequencies were established both over the ten-year wind experience and per wind event. Predictive models were developed by fitting a Weibull distribution to the ten-year wind and outage history and by using exponential regression for single wind events. The modeled outage expectations were divided by the mean outside right-of-way danger tree exposure to determine tree failure rates at varying wind speeds. The tree failure rates were used in evaluating potential tree-caused outage mitigation strategies and overall to determine if harden-
Figure 1. PSE service territory ten-year wind frequency (1998– 2007). Note: Y-axis is number of days when winds of a specific speed were experienced at one or more of the nine airfields.
of the frequency distribution is not explicit, but there is enough data to know that it is a positively skewed distribution (Figure 1). Figure 2 is the result of graphing the number of tree-caused transmission interruptions by wind speed. While the pattern produced is somewhat rough, being based on only 209 records, an approximately normal distribution centered at about 55 km/hr is suggested. There is a note of caution necessary. When utilities experience widespread or what they term major storm damage, the recording of outage causes may be sacrificed in the interest of expediting service restoration. The effects can be seen in the data. Figure 2 shows service interruptions were very low at wind speeds above 90 km/hr. This does not seem logical and is likely attributable to the combination of the incidence of days with winds in excess of 90 km/hr being low and the damage at such wind speeds being so great that the utility dropped the reporting of outages. This is perfectly illustrated by the fact that even though more than 40% of the PSE transmission system was out of service at points through a major storm in December 2006 (pers. comm. PSE), there is only one tree-related transmission record attributed to the storm. Consequently, it may be said that the ten-year outage frequency data represents normal operating conditions for PSE. Both the underrepresentation of data at high wind speeds and the overall small sample size of tree-caused transmission outages resulting in a rough pattern of interruptions when organized by wind speed on occurrence, call for a modeling approach to facilitate interpretation of the data. This is accomplished through the application of a Weibull distribution to
ing the transmission system against storm damage is possible.
Figure 3. Weibull distribution for transmission outages (1998–2007).
Figure 2. Scatter diagram for transmission interruptions (1998– 2007) based on wind speed.
RESULTS AND DISCUSSION
Trees are the primary cause of unplanned service interruptions on the PSE electric system. Tree-caused in-growth outages have averaged only 10% over the period of 1998 through 2007, and have been less than 5% of all tree-caused interruptions since 2005. PSE’s recent experience is that 95% of tree-caused outages are due to tree failure, either branch or trunk failure or uprooted trees. Of the failed trees that caused an interruption, only 32% had externally detectable faults that would permit designating them hazard trees. It was found that over the ten-year period, 18% of the days had sustained wind speeds of less than 24 km/hr. Fifty-six of the 265 tree-caused transmission interruptions occurred under these conditions. Without detailed data on winds below 24 km/hr, the shape
©2011 International Society of Arboriculture
Figure 4. Modeling transmission interruptions based on wind speed (1998–2007).
Arboriculture & Urban Forestry 37(4): July 2011
149
the data (Brown 2009a). The Weibull distribution (Figure 3) represents probability, and the area under the curve equals 1. The Weibull distribution is a function of a scale parameter a, and a shape parameter b. It is able to assume various shapes to fit varying data sets (Brown 2009a). The a and b parameters can be established by trial and error, fitting the curve (Figure 3) to the data (Figure 2). Once the a and b values for the Weibull distribution were determined, the Weibull distribution was adjusted first (Weibull 1, Figure 4) by minimizing the χ2 error, and secondly (Weibull 2, Figure 4) by application of a constant to reflect the upper limits of outage frequency. While it appears that the pattern of outage events (Figure 4) can be represented by a normal distribution, this was not statistically verified. The sample size was too small to meet the minimum bin frequency requirement for a Pearson’s χ2 goodness of fit test. Future work, with substantially larger outage incident data sets may serve to validate or reject this assertion. It will require inclusion of distribution system data, which in PSE’s case would add more than 33,500 outage incidents to the 265 transmission outages. While modeling transmission tree-related outages via a Weibull distribution could not be statistically verified, the graphics produced in the process are revealing. Figure 4 shows that over the ten-year period most reported tree-related outages occur during winds ranging from 30 to 80 km/hr (estimated from Figure 4). Figures 2 through 4 present data based on a ten-year experience. However, it is also important to know the distribution of outages in response to a single wind event of a particular intensity. To make this determination, an interruption frequency was calculated by dividing the number of reported tree-caused outage events that occurred at a wind speed over the ten-year period by the number of days that wind speed was experienced over the ten-year period. The interruption frequency presented in Figure 5 shows interruptions to be exponential to wind speed. The correlation between wind speed and interruption frequency was tested. This yielded a Pearson Product Moment correlation coefficient of 0.7257 with P(r = 0) of 0.0000. Regression, to explain outage frequency by wind speed, was performed. The exponential regression form provided an r2 value of 0.8426 with P = 0.0000. However, the Hoerl’s regression form serves to minimize residuals and has a better fit (Figure 5). The Hoerl’s regression has an r2 of 0.8617 with P = 0.0000. The Hoerl’s regression produces the algorithm
for PSE could be said to cover wind speeds from 36 to 71 km/hr (x̃ ± s) (Figure 4). This may apply to other utilities also at winds
[1]
Figure 7. Tree failure ratio.
IF = 0.8716053773 * WS^-3.0114265384 * e^(0.2056078327 * WS)
where IF is interruption frequency and WS is wind speed. The regression algorithm permits modeling of outages beyond the wind speeds for which data is available. In Figure 6, interruptions for wind speeds up to 121 km/hr are modeled. At 121 km/hr interruptions are approaching an asymptote. This projection fits with observations made in the aftermath of Hurricane Hugo, where it was observed that tree damage increased rapidly with wind gust speeds in excess of 60 km/hr but did not worsen beyond 130 km/hr (Francis and Gillespie 1993). The ratio of expected interruptions was determined for 24 km/hr, 48 km/hr, 72 km/hr, 97 km/hr, 105 km/hr, and 121 km/hr (Figure 7). The expected outage frequency at 24 km/hr winds was used as the denominator to calculate the ratio of expected interruptions for the range of wind speeds. Normal operating conditions
Figure 5. Interruption frequency.
Figure 6. Transmission interruptions per wind incident.
over 71 km/hr, as some major storm damage has been experienced, which was the case with tropical storm Isabel (Michaels 2003). Total transmission system of danger tree exposure was found through trigonometry to be 4,276,395 trees. By dividing the upper limit Weibull modeled outage events (Weibull 2, Figure 4) by the system tree exposure, a ten-year failure rate for each wind speed was calculated. In a similar manner, dividing the Hoerl’s regression values by the total tree exposure provides the means of calculating the expected tree-related outages for a particular wind event. In both cases, the failure rates are based on environmental conditions from 1998 through 2007. Assuming all else being equal, changes in system tree exposure will result in new outage expectations, which can be calculated by multiplying the tree exposure by the failure rate. A possible mitigation approach to PSE’s tree-related interruption frequency that involved reducing the extent of tree exposure,
©2011 International Society of Arboriculture
150
Siegfried Guggenmoos: Tree-related Electric Outages Due to Wind Loading
by increasing clear width at all locations where the current tree risk exceeds that of the voltage class mean was examined. The mitigation, if implemented, would reduce the transmission system tree exposure to 3,905,052, or by 8.7%. When the impact of this reduction in tree exposure is graphed over the ten-year wind experience, it produces Figure 8. Figure 8 shows the response to the mitigation to be a 43% reduction in tree-related outages. The impact of the same proposed mitigation scenario was also examined for single wind events (Figure 9). It too shows a 43% reduction in tree-related interruptions due to the reduction in system tree exposure.
Figure 8. Ten-year outage expectations before and after intervention.
Figure 9. Outages per wind intensity event before and after intervention.
©2011 International Society of Arboriculture
CONCLUSION
This work has demonstrated that tree-related electric service interruptions arising from wind loading can be modeled. While these outage predictions are based on the assumptions of environmental conditions similar to those associated with the historical data, such predictions are useful in comparing various outage mitigation strategies. Furthermore, this work has established that the electric system can be hardened against storm damage caused by tree failures. The system cannot be hardened to withstand wind loading to a particular level. Rather, as mitigation involves the reduction in system tree exposure, there is a uniform percentage reduction in tree-related outages across all wind speeds (Figure 8; Figure 9). It can be concluded that reducing electric system tree exposure will reduce tree-related outages during normal operating conditions (Figure 8) and during major storms (Figure 9). Utility systems are built to withstand specific levels of wind and ice loading (Wadhwa 2006). This work has made explicit that tree-related outages are exponential to increasing wind loading (Figure 5; Figure 6). Both the system design and the interaction between wind and trees demand a certain staffing level to provide an acceptable level of service. The design and the staffing level are a response to what would be considered a normal system performance expectation (Wadhwa 2006). For PSE, normal conditions may be said to range over wind speeds of up to 71 km/hr (x̃ + s). It may be expected that PSE is staffed to meet the system performance under these conditions, comprising 98% of the days (Figure 1). Over the ten-year test period, winds in excess of 83 km/hr (x̃ + 2s) occurred only 0.26% of the days (Figure 1). Figure 7 shows that in the PSE service territory, winds of 97 km/hr are expected to cause tree-related outages an order of magnitude greater than at 71 km/hr and 121 km/hr winds will cause tree-related outages two orders of magnitude greater. If the utility is staffed to expediently remedy outages occurring at 71 km/hr, it will be severely challenged to contain the duration of outages when winds are 97 km/hr and outage incidents increase tenfold. The one hundred fold increase in outages at 121 km/hr winds may be expected to overwhelm the utility. There are elements of this work that can be extended to other electric systems. Knowing that wind loading is exponential to wind speed (Brudi and van Wassenaer 2001), it is logical that tree-caused service interruptions are exponential to wind speed. It is hypothesized that this relationship is universal for aboveground electric systems. Consequently, it should be expected that when electric systems face winds in excess of 72 km/hr, as wind speed increases, tree-related interruptions increase rapidly and soon overwhelm the utility's ability to contain the duration of outages. It was stated that utility outage statistics are skewed to normal operating conditions because during major storm events the focus is on restoring service. An argument could and has been made that very useful information to guide future damage avoidance could be garnered for a relatively small investment of time (Brown 2009b) if data was gathered with storm damage assessments. However, the status quo skews the data to normal operating conditions. Under normal operating conditions the distribution of outages as seen in Figure 4, may be expected for other utilities. Due to differences in tree species, tree failure characteristics and wind and other environmental conditions, the amplitude of the curve may differ and it may be centered on a different wind speed.
Arboriculture & Urban Forestry 37(4): July 2011
The frequency of outages projected for various wind speeds are specific to PSE's service territory. They are a reflection of and interaction between system design, tree characteristics, and environmental conditions. Future work of this nature in other geographic areas should serve to elucidate the relationships between wind speed and tree-caused interruptions showing which, if any, are universal and which are environment specific.
LITERATURE CITED
Brown, R.E. 2009a. Electric Power Distribution Reliability. Taylor & Francis Group, LLC, CRC Press, Boca Raton, FL. 484 pp. Brown, R.E. 2009b. FINAL REPORT, Hazard Trees: Benchmark Survey and Best Practices. Prepared for Public Utility Commission of Texas, Quanta Technology, August 2009. p. 48. Brudi, E., and P. van Wassenaer. 2001. Trees and Statics: Nondestructive Failure Analysis. In: E.T. Smiley and K.D. Coder (Eds.). Tree Structure and Mechanics Conference Proceedings. Savannah, GA. October 2001. p. 57. Francis, J.K., and A.J.R. Gillespie. 1993. Relating Gust Speed to Tree Damage in Hurricane Hugo, 1989. Journal of Arboriculture 19(6):368–373. Hanukkah Eve wind storm of 2006. Wikipedia. Michaels, Patrick J. 2003. A Passion That Leaves Us Powerless. The Washington Post, October 1, 2003. Reprinted at Wadhwa, C.L. 2006. Electrical Power Systems. Fourth Edition. New Age International (P) Limited, Publishers, New Delhi, India. p. 158.
Siegfried Guggenmoos President Ecological Solutions, Inc. 10 Milburn Place Sherwood Park, AB, T8A 0T8 Canada
151
Résumé. Suite aux séquelles causées par une tempête de vent qui a interrompu le service pour plus de 40% des abonnés au service électrique de Pugget Sound Energy, les autorités réglementaires ont ordonné une enquête afin d’évaluer les options pour renforcer le réseau électrique. La phase initiale de l’étude a permis de quantifier l’étendue de la problématique des arbres le long des lignes d’électricité et a permis d’examiner la corrélation entre diverses variables mesurables sur le terrain et la fréquence des pannes causées par les arbres. Cette phase de l’étude a permis de corréler ensemble des données accumulées sur 10 ans à propos des vents et des pannes. Des degrés de risque de bris d’arbre ont été calculés et ont été employés pour modéliser les causes anticipées de panne par rapport à la vitesse du vent. Des modèles ont été développés afin d’évaluer l’impact des interventions qui permettraient de réduire le risque de panne lorsque le réseau est en présence d’arbres. Zusammenfassung. In der Folge eines Sturmereignisses, welches die Stromversorgung von mehr als 40% des Puget Sound Energy Versorgungssystems unterbrach, hat die Behörde eine Untersuchung angeordnet, um die Möglichekeiten zur Stärkung des Systems zu bewerten. Die Anfangsphase der Studie quantifizierte das Ausmaß der Exposition von Bäumen entlang der Stromleitung und untersuchte die Korrelation zwischen verschiedenen, im Feld gemessenen Variablen durch Bäume verursachte Ausfälle. Diese Phase der Arbeit korrelierte 10 Jahre von Windmessungen mit 10 Jahren der Ausfalldatenerhebung. Baumversagensraten wurden kalkuliert und verwendet für ein Modell der auf Windgeschwindigkeiten basierenden Erwartungen des Netzausfalls verursacht durch Bäume. Es wurden Modelle entwickelt zur Untersuchung des Einflusses des Netzausfalls auf Interventionen, welche die Exposition des Stromversorgungsnetztes gegenüber Bäumen reduziert. Resumen. Después de una tormenta el servicio se interrumpió en más del 40% del sistema de transmisión de energía de Puget Sound; el regulador ordenó una investigación para evaluar las opciones de endurecer el sistema eléctrico. La fase inicial del estudio cuantificó la extensión de la exposición a los árboles a lo largo de la línea y examinó la correlación entre variables del campo y la frecuencia de interrupción de energía causada por el árbol. Esta fase del trabajo correlacionó 10 años de datos de viento con 10 años de datos de afectación. Las tasas de falla del árbol fueron calculadas y usadas en un modelo basado en los datos de velocidad del viento. Los modelos fueron desarrollados para evaluar el impacto de la interrupción de intervenciones que reducen la exposición a los árboles de los sistemas de transmisión.
©2011 International Society of Arboriculture