Transportation Cost and Benefit Analysis II – Transportation Cost Implications Victoria Transport Policy Institute (www.vtpi.org)
9.
Transportation Cost Implications
This chapter explores some implications of transportation economic evaluation with regard to optimal pricing, economic efficiency, land use, stakeholder perspectives, and travel patterns.
9.1 Chapter Index 9.1 Chapter Index .............................................................................................. 1 9.2 Economic Efficiency Impacts...................................................................... 1 9.3 Economic Development Implications of Underpricing ................................ 4 9.4 Land Use Impacts of Underpricing ............................................................. 9 9.5 Stakeholder Perspectives of Transportation Underpricing ......................... 10 9.6 Implications of Underpricing to Consumers................................................ 12 9.7 References and Information Resources ..................................................... 13
9.2 Economic Efficiency Impacts A basic tenet of market theory is that economic efficiency is maximized when prices (perceived variable internal costs) reflect marginal costs, as described in Chapter 3. Mispricing prevents users from efficiently incorporating costs into their consumption decisions. “Price is the mechanism by which scarce resources are allocated efficiently between competing uses. For consumers, price encourages a purchase if the benefits of making the purchase exceed the benefits of alternatives. For producers, prices provide incentives for resources to move to those uses which people value most highly by informing firms how to produce, which products to produce, when and where to sell the products, and when, where and how to invest.” 1
Cost estimates in this study indicate that motor vehicle use is significantly underpriced. External costs range from 31% to 42% of total costs, as shown in Table 9.2-1. User costs (both market and non-market) would need to increase 58% to 69% to incorporate all costs. Other studies described in Chapter 2 reach similar conclusions. Table 9.2-1
Average Automobile Costs as a Percent of Total Costs Total Costs Internal Costs External Costs Units per veh. Mile per mile % of Total per mile % of Total Urban Peak $1.64 $0.95 58% $0.68 42% Urban Off-Peak $1.18 $0.76 64% $0.44 36% Rural $0.94 $0.67 69% $0.27 31% Weighted Average $1.18 $0.76 64% $0.42 36%
On average, about one-third of the costs of driving are external.
1 Halcrow Fox (1993), Land Transport Pricing for New Zealand, Transit New Zealand (www.transit.govt.nz), p. 47. 16 March 2011
www.vtpi.org/tca/tca09.pdf Page 9-1
Transportation Cost and Benefit Analysis II – Transportation Cost Implications Victoria Transport Policy Institute (www.vtpi.org)
With the underpricing of private motor vehicle travel external costs are not eliminated, they simply show up elsewhere in the economy; for example as higher prices for commercial goods (for parking costs), increased local taxes (for road services), higher health care costs (from automobile crashes), illnesses (from pollution and inactivity), and lower residential property values (from urban traffic). Another effect of underpriced driving is that non-automotive travel choices decline. Walking, bicycling, transit, and rail transport receive little capital investment, land use patterns and social habits develop which conflict with these travel options, and they are stigmatized. The majority of automobile costs are either external or fixed, and therefore unrelated to the amount a vehicle is driven. These are forms of underpricing. External costs range from 73% to 113% of user marginal costs (vehicle operating costs plus, user time and accident risk), and 186% to 323% of vehicle operating costs. For each dollar users spent operating a vehicle they incur an average of $2.55 worth of external costs related to congestion, crashes, parking and environmental degradation. Although underpricing driving may appear to benefit users (and indeed benefits many individuals in the short term), mispricing reduces overall economic efficiency.2 Underpriced automobile use increases purchases of transport over other consumer goods, and driving over other travel modes. As Johnson states, “When a good as central to American life as the automobile remains underpriced for several decades, that good tends to be used more than it otherwise would be. Habits become ingrained and are hard to break. They are reinforced by the present urban infrastructure designed to exploit the full possibilities of private mobility.”3 Low prices force other constraints, such as congestion, pollution, and resource depletion to limit growth. Underpricing makes these problems unavoidable. Under such circumstances, increasing road capacity is not only ineffective at reducing congestion, it may be counterproductive.4 Consumers pay fixed and external costs no matter how much or little they drive, which reduces the incentive to limit driving to trips with positive net value. Put another way, automobile owners receive only a small portion of the savings produced when they driving less. Shifting costs from being external or fixed to being internal and variable increases user choice. At worst consumers would simply shift the money saved in reduced fixed expenses to cover their higher variable expenses, resulting in no overall change in travel or cost. But they can achieve savings that are not currently possible by foregoing low value trips or shifting to more efficient modes. The driving that is eliminated represents existing travel with negative net benefit. Efficient pricing makes consumers better off and improves transportation system efficiency.
2 Terry
Moore and Paul Thorsnes (1994), The Transportation/Land Use Connection, American Planning Association, Report #448/449 (www.planning.org). 3 E.W. Johnson (1993), Avoiding the Collision of Cities and Cars, Academy of Arts and Sciences (www.amacad.org), p.11; at www.jstor.org/pss/3824395. 4 Kenneth Button (1993), Transport Economics, Second Ed., Edward Elgar (Aldershot), p. 181, 191, 202. 16 March 2011
www.vtpi.org/tca/tca09.pdf Page 9-2
Transportation Cost and Benefit Analysis II – Transportation Cost Implications Victoria Transport Policy Institute (www.vtpi.org)
The total inefficiency and harm of these market distortions is far greater than most analyses indicate because their impacts are cumulative and synergistic (total impacts are greater than the sum of individual impacts). For example, underpriced parking not only increases parking costs, by increasing total vehicle ownership and use it also increases traffic congestion, accidents, pollution emissions and sprawl compared with what would occur with efficient pricing, while underpricing road use, by increasing vehicle trips, increases parking costs. Underpricing increases automobile dependency and reduces travel options, which is unfair to non-drivers and reduces transport system efficiency. Underpricing encourages automobile use for trips when alternatives are more efficient overall. Put differently, correcting pricing distortions provides multiple benefits. Because transport costs are diverse, no single mechanism can capture all externalities. The Economist argues, “Cars must be made expensive to use rather than own, whether through taxation, road -pricing or parking fees.”5 Increased fuel taxes are often recommended to internalize automobile costs,6 but this provides only modest incentive to reduce congestion, parking costs, and some environmental impacts. Others emphasize peak period road pricing,7 which reduces congestion but not other externalities such as pollution or parking subsidies. Efficient pricing requires several types of fees: weightdistance fees, fuel taxes, congestion pricing, smog fees, parking charges, marginalized insurance, and higher fines for traffic violators.8 Transaction costs can make optimal pricing inefficient, which could justify continued underpricing. Current parking charges and traditional road tolls require users to deliver money in the correct form, and impose administration costs. People may prefer to avoid transaction costs by paying lump sums or bundling transportation fees with other charges. New technologies can significantly reduce these transaction costs, lowering the threshold under which marginal pricing is justified. Although transaction costs prevent society from ever achieving pricing that perfectly reflects costs, this is not a barrier to significant progress in marginalizing transport costs. Many costs associated with increasing transportation prices, such as unemployment and reduced profits in motor vehicle dependent industries are transition costs which decrease over a few years and eventually disappear. Transition costs are economic inefficiencies that result when durable factors such as location, equipment and training don’t match current markets. Transition costs can be minimized by good planning and gradual implementation of changes. For example, the British government’s plan to increase fuel taxes 5% annually above inflation for a decade to internalize environmental costs is expected to have minimal transition costs because it is so predictable and gradual.
5 Economist
(1996), “Taming the Beast: A Survey on Living With the Car,” The Economist (www.economist.com), 22 June 1996. 6 Steve Nadis and James MacKenzie (1993), Car Trouble, WRI, Beacon Hill Press (Boston), p. 160. 7 Anthony Downs (1992), Stuck In Traffic, Brookings Institute (www.brookings.edu). 8 Per Kågeson (1993), Getting the Prices Right, European Fed. for Transport & Environment (www.transportenvironment.org); Todd Litman (2007), Socially Optimal Transport Prices and Markets, VTPI (www.vtpi.org); at www.vtpi.org/sotpm.pdf 16 March 2011
www.vtpi.org/tca/tca09.pdf Page 9-3
Transportation Cost and Benefit Analysis II – Transportation Cost Implications Victoria Transport Policy Institute (www.vtpi.org)
9.3 Economic Development Implications of Underpricing Economic Development refers to progress toward a community’s economic goals, including increased productivity, employment, competitiveness, property values, business activity, investment and tax revenues, as summarized below. Transport is a major component of economic activity. In 2005, transportation-related demand accounted for over 10.3 percent of U.S. Gross Domestic Product (GDP), represented about 10% of total employment, and represented about 18% of household expenditures.9 As a result, there is a popular assumption that motor vehicle travel is economically beneficial, and constraints on driving (such as increased prices for fuel, road use and parking) are economically harmfuel. Increased transport prices are claimed to have a “multiplier effect” that raises overall costs and reduces productivity.10 However, these arguments misrepresent transportation costing impacts. Increasing transportation system efficiency and reducing total transport costs can increase economic productivity, but shifting costs and reducing transportation system efficiency tends to be economically harmful. For example, businesses benefit if their shipping or parking costs decline, but are worse off if underpricing of roads and parking facilities leads to traffic congestion and increases parking demand, increasing their total costs. Although the U.S. produces some motor vehicles and fuel, expenditures on these goods provide relatively little economic benefit because they are capital intensive and mostly imported.11 Even locally assembled vehicles are built from components largely imported from other regions. There is no evidence that policies which stimulate domestic vehicle and fuel expenditures stimulate economic development overall. A consumer dollar spent on automobiles means one less dollar for housing, food, entertainment, education, or investment. Conusmer expenditures on fuel are particularly harmful to the economy, as discussed in Chapter 5.12. For example, a Texas case study found that automobile expenditures provide far fewer jobs than expenditures on general consumer goods or public transportation, as summarized in Table 9.3-1. Table 9.3-1 Regional Economic Impacts Of $1 Million Expenditure12 Expenditure Category Regional Income Regional Jobs Automobile Expenditures $307,000 8.4 Non-automotive Consumer Expenditures $526,000 17.0 Transit Expenditures $1,200,000 62.2
This table shows economic impacts of consumer expenditures in Texas.
9
BTS (2008), “Transportation and the Economy,” Transportation Statistics Annual Report, Bureau of Transportation Statistics (www.bts.gov). 10 Hickling Lewis Brod (1997), Social Cost Pricing and the External Benefits of Trucking, American Trucking Association (www.trucksdeliver.org). 11 David Goldstein (2007), Saving Energy, Growing Jobs: How Environmental Protection Promotes Economic Growth, Profitability, Innovation, and Competition, Bay Tree Publishers (www.baytreepublish.com); summary at www.cee1.org/resrc/news/07-02nl/09D_goldstein.html. 12 Jon Miller, Henry Robison and Michael Lahr (1999), Estimating Important Transportation-Related Regional Economic Relationships in Bexar County, Texas, VIA Transit (www.viainfo.net). 16 March 2011
www.vtpi.org/tca/tca09.pdf Page 9-4
Transportation Cost and Benefit Analysis II – Transportation Cost Implications Victoria Transport Policy Institute (www.vtpi.org)
Similarly, shifting expenditures from petroleum and automobiles substaintialy increases employment in British Columbia, as indicated in Table 9.3-2. Even in Germany, a major vehicle exporter, a less automobile-oriented transportation system would provide a net increase in national employment.13 This indicates that policies which reduce consumer expenditures on motor vehicles and fuel tend to increase employment and business activity, particularly in regions that import petroleum. Table 9.3-2 Jobs Created in British Columbia by Transportation Expenditures14 $1 Million Expenditure Full Time Jobs Created Petroleum 4.5 General Automobile Expenses 7.5 Public Transit 21.4
This table shows economic impacts of transportation expenditures in British Columbia.
The Effects of Underpricing: Two Industry Example Consider an economy with two industries: Heavy and Light. Transport is a relatively large portion of Heavy’s production costs, and a small portion of Light’s. 1. These industries initially face a transport price structure which underprices shipping by funding roadways through general taxes. Since both industries pay the same tax, Light is effectively subsidizing Heavy. Score: Heavy + Light Economic Efficiency 2. A $0.10 per mile road use fee is implemented to replace the property tax, called FairPrice. Heavy industry pays more taxes while Light pays less. Score: Heavy Light + Economic Efficiency + 3. At worst, Heavy pays the full road charge. But, Heavy may change practices to reduce costs such as by moving more goods by rail, so its net cost increase is minimal. Score: Heavy = Light + Economic Efficiency ++ 4. FairPrice also reduces traffic congestion and accidents. Assume that Heavy industry’s shipping time is reduced by 1/2 hour for every 100 miles of trucking and its trucks cost $50 per hour to operate, this means the $10 per hundred mile road user charge saves $25 in operating expenses, for an overall saving to Heavy. Score: Heavy + Light + Economic Efficiency +++ Although this example is simplistic, it emphasizes two important points: 1.
Underpricing transfers rather than eliminates costs.
2.
Full cost pricing provides incentives for business to use resources more efficiently, which provides long term economic benefits, especially to transportation dependent industries.
13
Frank Ebinger, et al. (1998), Chief Benefits for the Future; New Jobs Created With EnvironmentallyCompatible Traffic, Öko-Institut/VCD (www.oeko.de/english/transport/chief.htm). 14 B.C. Input/Output Table, British Columbia Treasury Board,1996 16 March 2011
www.vtpi.org/tca/tca09.pdf Page 9-5
Transportation Cost and Benefit Analysis II – Transportation Cost Implications Victoria Transport Policy Institute (www.vtpi.org)
Table 9.3-1 identifies the types of companies that are likely to be better or worse off from underpricing. Only if “Better Off” firms provide more profit or employment than those in “Worse Off” might underpricing provide overall economic benefit. Table 9.3-1
Commercial Impacts of Motor Vehicle Use Underpricing Better Off Worse Off Motor vehicle production, sales and service. Alternative forms of transportation. Bulk commodities. High-value products. Low-value manufacturing. Communications and information industries. Imports. Domestic and local production. Isolated companies. Centrally located companies. Isolated retail and recreation. Local oriented retail and recreation.
Underpricing benefits some companies and harms others. Overall, reducing underpricing should benefit more companies than it harms due to increased economic efficiency.
Although a certain amount of motor vehicle travel is efficient and economically beneficial, beyond this optimal, increased driving is economically harmful. A World Bank study indicates that automobile dependency reduces regional economic development.15 The researchers conclude that, “there are no obvious gains in economic efficiency from developing car dependence in cities,” and, “There are on the other hand significant losses in external costs due to car dependence...” They find that beyond a certain point (about 7,500 kilometers of per capita annual motor vehicle travel), increased driving impose economic costs that outweigh marginal economic benefits. They suggest that expenditures on motor vehicles and their facilities divert large amounts of private and public capital from alternative uses that are more economically productive. This study finds that the portion of income devoted to commuting is highest in automobile dependent cities, and that transit service efficiency is lowest and vehicle accident rates per capita are highest in automobile dependent cities. Long-term negative economic effects of transport price increases are relatively small, and appear to be declining in most industrial sectors.16 Freight transport has decreased as a percentage of GNP, industrial production, and national employment due to increased efficiency and more high-value, low-bulk products. Transport accounts for only about 56% of most manufactured product prices.17 North American fuel prices and user fees are among the lowest among developed nations as shown in Figure 9.3-1. Increasing fuel taxes to internalize externalities and reduce demand, with revenues used to replace other taxes, could have would have overall positive economic and employment impacts.18 15
Jeff Kenworthy, Felix Laube, Peter Newman and Paul Barter (1997), Indicators of Transport Efficiency in 37 Global Cities, Sustainable Transport Research Group, Murdoch University (Perth), for the World Bank (www.worldbank.org), February 1997. 16 Dr. Rainer Walz, et al. (1999), A Review of Employment Effects of European Union Policies and Measures for CO2 Emission Reductions, Fraunhofer Institute (www.isst.fhg.de). 17 Diamond and Spence (1989), quoted in Piet Rietveld (1994), “Spatial Economic Impacts of Transport Infrastructure Supply,” Transportation Research, Vol. 28A, p. 337. 18 Douglas Norland and Kim Ninassi (1998), Price It Right; Energy Pricing and Fundamental Tax Reform, Alliance to Save Energy (www.ase.org). 16 March 2011
www.vtpi.org/tca/tca09.pdf Page 9-6
Transportation Cost and Benefit Analysis II – Transportation Cost Implications Victoria Transport Policy Institute (www.vtpi.org)
Figure 9.3-1
Vehicle Fuel Retail Prices (International Fuel Prices, 2007)
The US, Canada and Australia have low fuel taxes compared to most European countries.
A U.S. federal study states, “...if a gasoline tax were coupled with an equal-revenue increase in investment tax credits, short-run macroeconomic losses resulting from motor fuel tax increases could be more than offset by the short-run macroeconomic gains”.19 Because fuel is a small portion of total industrial costs Kågeson concludes that, “The effects from internalizing the social costs of transport on the ability of European industry to compete on the world market will be almost negligible. The total impact will amount to less than 0.5% of the annual turnover of most industries.”20 Automobile underpricing may have been justified when the automobile industry was first developing, since vehicle and road production experienced economies of scale.21 This unique historical event does not apply to mature markets. Vehicle use now experiences diseconomies of scale now due to increasing congestion, crash risk and other externalities. Each driver benefits if others drive less, reducing conflicts over road and parking space. There are probably few, if any, further economies of scale in automobile, petroleum and roadway industries.
19
Office of Technology Assessment (1994), Saving Energy in U.S. Transportation, US Congress (www.access.gpo.gov/ota/), p.225. 20 Per Kageson (1993), Getting the Prices Right, European Fed. for Transport & Env. (www.transportenvironment.org), p. 183. 21 Clay McShane (1994), Down the Asphalt Path, Columbia University Press (http://cup.columbia.edu/), p. 105; Stephen Goddard (1994), Getting There, Basic Books, (www.basicbooks.com). 16 March 2011
www.vtpi.org/tca/tca09.pdf Page 9-7
Transportation Cost and Benefit Analysis II – Transportation Cost Implications Victoria Transport Policy Institute (www.vtpi.org)
A review of economic impact research concludes that transportation improvements may provide negative as well as positive economic impacts in a community.22 Most highway improvements in developed countries provide only marginal productivity benefits.23 Nijkamp and Blaas argue that transport facility investments only contribute to development if other conditions are ripe and transport costs are a significant economic constraint.24 Kessides concludes that infrastructure investments can provide high returns in developing countries but only normal returns in North America and Western Europe.25 Public transit expenditures provide twice the rate of return in productivity as highway expenditures, indicating that increased transport diversity and efficiency provide greater macroeconomic benefits than overall increases in motor vehicle use.26 Piet Rietveld calls economic arguments for transport subsidies “scientific mythification.” He states that “...the direct contribution of infrastructure improvement to a reduction in transport costs is in general small in industrialized countries.”27 Harry Dimitriou argues that inter-community transport improvements support economic development, but intracommunity transport improvements (such as urban roadway widening) provide little economic benefit in developed regions.28 Some macroeconomic research suggests that transportation infrastructure investments may have high economic returns.29 However, this does not prove that increased driving provides economic benefits. Rather, it implies that increased transport efficiency provides benefits. Public transit expenditures provide twice the return on investment as highway improvements,30 indicating that it is the general benefits of mobility or accessibility rather than the specific benefits of driving that provides economic benefits.
22
Standing Committee on Trunk Road Assessment (1997), Transport Investment, Transport Intensity and Economic Growth: Interim Report, (www.dft.gov.uk/pgr/economics/sactra). 23 Marlon Boarnet (1997), “New Highways & Economic Productivity: Interpreting Recent Evidence,” Journal of Planning Literature, Vol. 11, No. 4 (http://jpl.sagepub.com/), May 1997, pp. 476-486; Amy Helling (1997), “Transportation and Economic Development: A Review,” Public Works Management & Policy, Vol. 2, No. 1 (http://pwm.sagepub.com), July 1997, pp. 79-93. 24 Kenneth Button (1993), Transport Economics, Second Edition, Edward Elgar (Aldershot), Chapter 10; Nijkamp and Blaas (1993), Impact Assessment and Evaluation in Transport Planning, Kluwer, p. 45-49. 25 Christine Kessides (1993), The Contributions of Infrastructure to Economic Development, World Bank Discussion Paper #213 (www.worldbank.org). 26 David Aschauer (1991), Transportation Spending and Economic Growth, American Public Transit Association (www.apta.com). 27 Piet Rietveld (1994), “Spatial Economic Impacts of Transport Infrastructure Supply,” Transportation Research, Vol. 28A, No.4 (www.elsevier.com/locate/tra), p. 339. 28 Harry Dimitriou (1992), Urban Transport Planning: A Developmental Approach, Routledge (www.routledge.com), p. 144. 29 Alicia Munnell (1990), “How does public infrastructure affect regional economic performance?” New England Economic Review (www.bos.frb.org/economic/neer/neer.htm). 30 David Aschauer (1991), Transportation Spending and Economic Growth: The Effects of Transit and Highway Expenditures, American Public Transit Association (www.apta.com). 16 March 2011
www.vtpi.org/tca/tca09.pdf Page 9-8
Transportation Cost and Benefit Analysis II – Transportation Cost Implications Victoria Transport Policy Institute (www.vtpi.org)
9.4 Land Use Impacts of Underpricing Transportation has direct and indirect impacts on land values and use.31 Overinvestment in transportation facilities and underpricing of vehicle use increases the amount of land used for transportation and encourages low-density, urban fringe development.32 If highways improve access between urban and rural areas, rural property values increase as urban home buyers compete with other rural land uses. This profits current rural land owners if they are willing to sell to developers and allows individuals to purchase more land, privacy, and private environmental amenities than otherwise possible. It also allows exurban residents to compete for urban jobs, and access urban services, benefiting exurban residents. At one time this was considered unquestionably good for society.33 Webber states, “Today [1985] people are moving into outlying areas because technological improvements in transportation and communications have reduced the real cost of traveling and communicating...current transportation and communication systems are generating new forms of urbanization that are highly efficient, yet spread over thousands of square miles. I suggest that this calls for celebration, not commiseration. It promises unprecedently amiable living and working arrangements in pleasant surroundings and increasingly intimate contact with friends and associates, many of whom may be located miles away. When combined with high automobility, the exurbs promise spacious residential sites, temporal proximity to numerous employment sites, and relatively easy access to recreational resources and culturally rich activities.”34
Webber is only half correct. While increased driving allows individuals access to land that is less impacted by urban problems, it expands the range and scale of the impacts that individuals are trying to avoid, which call into question his claim of “efficiency.” Competition for exurban locations creates a self-perpetuating cycle of increased costs since increased motor vehicle traffic degrades the urban environment, thereby increasing urban sprawl and automobile use. The amount of time people spend on transport varies little, regardless of travel mode or speed.35 One geographer writes, “Those who use technology to travel at greater speeds still have to make the same amount of contacts--still work, eat, sleep and play in the same
31
Terry Moore and Paul Thorsnes (1994), The Transportation/Land Use Connection, American Planning Association, Report #448/449 (www.planning.org); Kelley (1994), “The Transportation Land-Use Link,” Journal of Planning Literature, Vol. 9, No. 2, (http://jpl.sagepub.com), Nov. 1994, p. 128-145. 32 VTPI (2008), “Land Use Evaluation,” Online TDM Encyclopedia, VTPI (www.vtpi.org); at www.vtpi.org/tdm/tdm104.htm. 33 James Kunstler (1993), The Geography of Nowhere, Simon & Schuster (www.simonsays.com), p. 39; Peter Muller (1986), “Transportation and Urban Form,” in Geography of Urban Transportation, Guilford Press (NY). 34 Melvin Webber (1985), “The Emerging Metropolis: Trends and Trepidations.” In: Metropolitan Growth Centers: A New Challenge for Public-Private Cooperation, UMTA-CA-06-0196-1, Nov. 1985, p.9, quoted in Homberger, Kell and Perkins (1992), Fundamentals of Traffic Engineering, 13th Edition, Institute of Transportation Studies, UCB (www.its.berkeley.edu), p. 2-12. 35 Gordon Stokes (1994), “Travel Time Budgets and Their Relevance for Forecasting the Future Amount of Travel, in Proceedings of European Transport Forum, PTRC (www.ptrc-training.co.uk), p. 25-36. 16 March 2011
www.vtpi.org/tca/tca09.pdf Page 9-9
Transportation Cost and Benefit Analysis II – Transportation Cost Implications Victoria Transport Policy Institute (www.vtpi.org)
proportions as always. They simply do these further apart from each other.”36 As a result, it is possible that little net benefit is derived from a substantial increase in driving. As discussed in Chapter 5.14, urban sprawl has significant environmental and social costs, including environmental and aesthetic degradation, reduced community cohesion, increased municipal service costs, and reduced mobility for non-drivers. Sprawled land use tends to be highly automobile dependent, increasing per capita driving and external costs. Many urban planners now argue that land uses have become unnecessarily separated.37 Lee concludes that an efficient transportation/land use system based on fullcost pricing would increase economic efficiency, reduce total transport expenses, reduce subsidies and tax burdens on non-users, improve urban environmental quality, reduce urban sprawl, and increase the use of efficient travel modes.38 9.5 Stakeholder Perspectives of Transportation Underpricing From society’s perspective, all costs and benefits must be considered in each decision, but the perspective of individual decision makers is often more limited. People tend to have different, often conflicting perspectives of transport costs and benefits, depending on their role (Table 9.5-1). These differing perspectives and definitions create conflicts over goals, objectives and strategies, and can result in economically inefficient decisions. Table 9.5-1 Stakeholder Perspectives of Transport Benefits and Cost Perspective Costs Benefits Society All costs All benefits Driver Time, vehicle costs, risk Mileage Non-Driver Time, fares, discomfort, risk Access Politician Political jurisdiction costs Political jurisdiction benefits Highway Planner Roadway and drivers’ costs Vehicle mileage, road capacity Urban Planner Facility costs, traffic impacts Mobility/Access Energy Planner Fuel consumption Mobility/Access Environmentalist Environmental impacts Mobility/Access
Definitions of transport costs and benefits varies depending on stakeholder’s perspective.
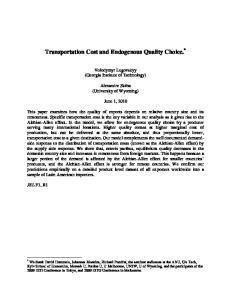
Another way to view the conflicts in transportation decision making is to consider the perceived relationships between average costs and quantity of driving from three perspectives: of users (who decide how much to travel), transportation professionals (who plan transport facilities) and society (which bears environmental and social costs and provides facility funding). These relationships are illustrated below in Figure 9.5-1.
36
John Whitelegg (1993), “Time Pollution,” The Ecologist, Vol. 23, No. 4 (www.theecologist.org), July/Aug. 1993, p. 131-134. 37 California Air Resources Board (1994), The Land Use-Air Quality Linkage, (www.arb.ca.gov), p. 9. 38 Douglass Lee (1992), “A Market-Oriented Transportation and Land Use System: How Different Would it Be?” in Privatization and Deregulation in Passenger Transport: Selected Proceedings of the 2nd International Conference, Espoo, Finland, Viatek, Ltd., June 1992, pp. 219-238. 16 March 2011
www.vtpi.org/tca/tca09.pdf Page 9-10
Transportation Cost and Benefit Analysis II – Transportation Cost Implications Victoria Transport Policy Institute (www.vtpi.org)
Figure 9.5-1
Motor Vehicle Use Conflicting Cost Curves User Costs Transport Agency Costs
Cost Per Mile
Environmental and Social Costs
Annual Mileage
Since most motor vehicle costs are fixed, marginal costs decline with increased annual milage, giving vehicle owners an incentive to maximize driving. Facility development has a downward sloping cost curve (economies of scale) when traffic is low, since increased driving allows costs to be divided among more miles of use, but once the system is congested average costs increase. Environmental, and social costs of driving are minimal when use is low, but slope upward.
Individuals face incentives to maximize driving, “to get their money’s worth” from large fixed vehicle costs. The transport agency’s U-shaped average cost curve implies economies of scale when roadway development is a goal.39 Only after congestion becomes a problem do transport agencies perceive benefits from reducing traffic demand, and even then they frequently experience incentives to encourage driving, such as fuel taxes dedicated to road building. The upward sloping cost curves associated with other social and environmental costs means that society benefits from reduced driving. As a result of these different price signals the perspectives of individual drivers and automobile oriented transport planners conflict with society in general, and transport professionals who take a broader view of transport costs and choices. The emphasis on increasing automobile capacity, rather than accessibility and other community goals is ingrained in transport planning and financing. The existence of dedicated roadway agencies and funding skews planning decisions toward roadway development. As described by Harry Dimitriou, “...the conventional bias in traditional [planning] methodologies with their concern for transport systems efficiency above all else, exists because those most intimately involved in such approaches are well equipped with tools and techniques to design and plan ‘operational efficient’ networks, whereas the equivalent expertise in the planning and management of more ‘developmentally effective’ transport systems is much less advanced.”40
39 40
Stephen Goddard (1994), Getting There, Basic Books (www.basicbooks.com). Harry Dimitriou (1992), Urban Transport Planning, Routledge (www.routledge.com), p. 220.
16 March 2011
www.vtpi.org/tca/tca09.pdf Page 9-11
Transportation Cost and Benefit Analysis II – Transportation Cost Implications Victoria Transport Policy Institute (www.vtpi.org)
9.6 Implications of Underpricing to Consumers You may be wondering, “What does this mean to me?” Underpriced driving is an economic transfer that allows some households to own more cars, travel more and live in more suburban locations than if prices were higher. But this additional consumption of mobility may provide little net consumer benefit. Underpricing imposes costs that show up elsewhere in household budgets, such as higher consumer prices to pay for “free” parking, higher taxes to pay for roads and traffic services, and increased health costs. At one time underpricing may have provided external benefits due to economies of scale in roadway and industrial development, but there is no evidence that such benefits still exist. Automobile advocates often claim that underpricing increases personal choices and freedom, as discussed in Chapter 8. The truth is just the opposite. Individuals have no choice but to bear the financial, crash risk and environmental costs of automobile use. Non-drivers have fewer mobility choices. Negative effects of underpriced driving include: •
Increased overall transport costs. Low marginal prices for driving encourage individuals to spend more on driving, leaving less funding for other goods.
•
Reduced transportation diversity. Fewer people use alternative modes, so they receive less investment than they otherwise would.
•
More externalities. Pollution, congestion, and motor vehicle accidents are surely greater than they would be if user costs were higher.
•
Increased land devoted to roads and parking facilities. This means less land available for other uses, higher taxes, or reductions in other government services, and higher consumer costs to pay for “free” parking.
•
Automobile oriented land use, economic and social patterns. Increased centralization and scale of services and activities, and less emphasis on neighborhood activities, services and relationships. The use and usefulness of streets for non-driving purposes, including walking, playing and other socializing has declined.
How these affect any specific individual depends on many factors including driving ability and automobile ownership, income, residence and job location, and future goals. The impacts of transport underpricing are also affected by how much an individual values environmental protection and social equity, and how much they value nonmotorized transport and community interaction. The benefits of underpriced driving are skewed toward people who drive the most, including those who are relatively wealthy, exurban and rural drivers, and long distance commuters. Children and teenagers, the elderly, the very poor and the handicapped tend to use automobiles relatively little and therefore receive the least benefits of underpricing and suffer significant disbenefits. The effects of price increases depend on how new prices are structured, how quickly and predictably changes occur, whether alternative modes are improved, and how revenues are distributed.
16 March 2011
www.vtpi.org/tca/tca09.pdf Page 9-12
Transportation Cost and Benefit Analysis II – Transportation Cost Implications Victoria Transport Policy Institute (www.vtpi.org)
9.7 References and Information Resources Booz Allen Hamilton (2005), Surface Transport Costs and Charges Study, Ministry of Transportation New Zealand (www.transport.govt.nz). Mark Delucchi (2005), The Social-Cost Calculator (SCC): Documentation of Methods and Data, and Case Study of Sacramento, Sacramento Area Council of Governments (SACOG) and the Northeast States for Coordinated Air-Use Management (NESCAUM), UCD-ITS-RR-05-37 University of California at Davis (www.its.ucdavis.edu); at www.its.ucdavis.edu/people/faculty/delucchi/index.php José A. Gómez-Ibáñez, William B. Tye and Clifford Winston (1999), Essays in Transportation Economics and Policy: A Handbook in Honor of John R. Meyer, Brooking Institution (www.brookings.edu). Per Kågeson (1994), Getting the Prices Right: A European Scheme for Making Transport Pay Its True Costs, European Federation for Transport and Environment (www.transportenvironment.org). European Transport Pricing Initiatives (www.transport-pricing.net) includes various efforts to develop more fair and efficient pricing. FHWA (2002), Highway Economic Requirements System: Technical Report, Federal Highway Administration, USDOT (www.fhwa.dot.gov/infrastructure/asstmgmt/hersindex.htm); at http://isddc.dot.gov/OLPFiles/FHWA/010945.pdf Douglass Lee (1997), “Uses and Meanings of Full Social Cost Estimates,” The Full Costs and Benefits of Transportation, Springer (www.springer.com), pp. 113-148. Todd Litman (2006), “Transportation Market Distortions,” Berkeley Planning Journal; issue theme Sustainable Transport in the United States: From Rhetoric to Reality? (wwwdcrp.ced.berkeley.edu/bpj), Volume 19, pp. 19-36; at www.vtpi.org/distortions_BPJ.pdf. Todd Litman (2007), Socially Optimal Transport Prices and Markets, VTPI (www.vtpi.org); at www.vtpi.org/sotpm.pdf. Ian W. H. Parry, Margaret Walls and Winston Harrington (2007), Automobile Externalities and Policies, Discussion Paper 06-26, Resources for the Future (www.rff.org); at www.rff.org/rff/documents/rff-dp-06-26-rev.pdf Richard C. Porter (1999), Economics at the Wheel; The Costs of Cars and Drivers, Academic Press (www.academicpress.com). Andrea Ricci, et al (2006), Pricing For (Sustainable) Transport Policies – A State Of The Art, Deliverable 1, Project contract no. 006293, IMPRINT-NET (www.imprint-net.org); at http://vplno1.vkw.tu-dresden.de/psycho/download/imprint-net_d1.pdf T. Sansom, C. A. Nash, P. J. Mackie; J. D. Shires and S. M. Grant-Muller (2001), Surface Transport Costs and Charges, for the UK DETR, Institute for Transport Studies, University of Leeds (www.its.leeds.ac.uk); at www.its.leeds.ac.uk/projects/STCC/surface_transport.html) 16 March 2011
www.vtpi.org/tca/tca09.pdf Page 9-13
Transportation Cost and Benefit Analysis II – Transportation Cost Implications Victoria Transport Policy Institute (www.vtpi.org)
TC (2003-2007), The Full Cost Investigation of Transportation in Canada, Transport Canada (www.tc.gc.ca); at www.tc.gc.ca/pol/en/aca/fci/menu.htm . For technical analysis see Anming Zhang, et al. (2005), Towards Estimating the Social and Environmental Costs of Transportation in Canada, Centre for Transportation Studies, University of British Columbia (www.sauder.ubc.ca/cts); at www.sauder.ubc.ca/cts/docs/Full-TC-report-UpdatedNovember05.pdf. Transport Policy Section (2004), External Costs/Benefits: Definition of External Costs and Exogenous Benefits, Swiss Federal Office for Spatial Development (www.are.admin.ch). UNITE (“Unification of Accounts and Marginal Costs for Transport Efficiency”), is a comprehensive research program on transportation costs by several European academic and research organizations. The University of Leeds (UK) serves as Project Coordinator and has information at its website at www.its.leeds.ac.uk/projects/unite. van Essen, et al (2004), Marginal Costs of Infrastructure Use – Towards a Simplified Approach, CE Delft (www.ce.nl). Vermeulen, et al (2004), The Price of Transport: Overview of the Social Costs of Transport, CE Delft (www.ce.nl). William Vickrey (1994), Public Economics; Selected Papers by William Vickrey, Cambridge University Press (www.uk.cambridge.org).
16 March 2011
www.vtpi.org/tca/tca09.pdf Page 9-14