TRADING STRATEGY Mark Buchanan + 44 207 888 0908
[email protected]
Trading Strategy Guide to Trading in Frontier Markets Market Commentary
12 December 2012
The Final Frontier
Key Points While frontier markets may be an attractive investment opportunity, it is important to recognize that there are many challenges to investing and trading in these markets.
A Natural Progression for EM investors, But Beware the Hidden Costs and Risks
The investable universe is tiny compared to emerging markets and lacks the capacity to absorb large scale institutional investment.
Furthermore, they are dominated by financials, the Middle East and a handful of large caps.
A general lack of liquidity also means that trading is costly and slow, especially at times of high stress.
Investors who decide to take the plunge regardless should proceed with caution and be prepared for a bumpy ride.
Frontier markets are increasingly being touted as an attractive option for investors seeking growth opportunities and wishing to diversify their portfolio. While this may be a natural progression for investors already exposed to emerging markets, it is important to recognise that there are many challenges to investing in frontier markets, some of which are not widely appreciated. For example, the investable universe for frontier markets is relatively small and stocks are generally illiquid - especially during times of high stress. Broad frontier benchmarks are highly exposed to the Middle East and financials, and increased correlation with more developed countries has reduced the benefits of diversification. This report investigates these topics in detail and in the Appendix provides exchange details (e.g. market hours, settlement cycles, etc) for the main frontier markets.
What Is a Frontier Market? The term “frontier markets” is widely used to describe countries of small size, limited investability, substandard financial reporting and/or low regulation. While the major index providers broadly agree on this definition, technical differences in methodology means country classifications vary by index provider. Of the 46 countries deemed to be “frontier” across the 4 major providers (i.e. MSCI, FTSE, S&P and Russell), only 20 are present in all 4 indices and eleven are present in only one index. See Exhibit 19 in the Appendix for further details.
Exhibit 1: Frontier Markets as a % of Global Market Cap 100%
80%
Frontier Markets
Still a Very Small Slice of the Pie
60%
Frontier Markets Account for 1.5% of Global Market
40%
Based on MSCI country classifications, our analysis suggests that the entire market cap of frontier markets is ~$645bn. Although this may sound like a large number, it is actually extremely small compared to ~$12,300bn for emerging markets and ~$30,700bn for developed markets (see Exhibit 1).
20%
Frontier
Emerging
Oct 11
Oct 10
Oct 09
Oct 08
Oct 07
Oct 06
Oct 05
Oct 04
Oct 03
0%
Developed
Source: Credit Suisse Trading Strategy, MSCI, Bloomberg, Jan 1st, 2003 – Dec 15th, 2011 (212 (
The investable universe – as defined by the major index providers – is even smaller as many securities are ruled out due to minimum size thresholds, a lack of liquidity or foreign ownership limits. The MSCI Frontier Markets Index – a popular frontier markets benchmark – has a full market cap of ~$100bn and a free float adjusted market cap of just ~$43bn. The scope for expanding institutional investment is therefore somewhat limited, especially when we consider the generally low liquidity profile of stocks which qualify for index inclusion (see the ‘Gaining Exposure Takes Time’ section below).
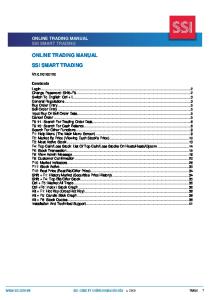
TRADING STRATEGY Exhibit 2: Performance of MSCI Frontier Markets vs. MSCI Developed and Emerging Markets
Frontier Markets Changed Their Spots Post 2008 Crash Prior to the 2008 global financial crisis, the performance of frontier markets was roughly in line with emerging markets. However, while emerging markets have rebounded strongly from the lows in March 2009, frontier markets have been less robust, more closely tracking the performance of developed markets (see Exhibit 2).
300% Global Financial Crisis
250%
Performance
How Different Are Frontier Markets?
200%
Within frontier markets, the Middle East has performed well in relative terms, led by Qatar which is due to host the 2022 FIFA World Cup (see Exhibit 3). Sri Lanka and Vietnam have also expanded strongly, while Ukraine and Slovenia have shrunk significantly.
150% 100%
Exhibit 3: Frontier Market Country & Regional Weightings ESTONIA
100%
50%
LITHUANIA
Europe
BULGARIA
Nov 11
Nov 10
May 11
Nov 09
May 10
Nov 08
May 09
Nov 07
MSCI DM
KAZAKHSTAN
80%
Asia
th
Source: Credit Suisse Trading Strategy, MSCI, Nov 30 , 2004 – Dec 13th, 2011
ROMANIA UKRAINE
Africa
MSCI EM
Weighting
MSCI FM
May 08
Nov 06
May 07
Nov 05
May 06
Nov 04
SLOVENIA May 05
0%
60%
CROATIA SRI LANKA
South America
VIETNAM PAKISTAN MAURITIUS
40%
KENYA TUNISIA
Middle East Exhibit 4: Correlation between MSCI Frontier Market, Developed Market and Emerging Market Indices
ARGENTINA
20%
LEBANON BAHRAIN OMAN
100%
60%
Aug-11
Apr-11
Dec-10
Aug-10
Apr-10
Dec-09
Aug-09
Apr-09
Dec-08
Aug-08
Apr-08
Dec-07
Aug-07
Apr-07
0%
80%
Correlation
NIGERIA
UAE KUWAIT QATAR
Source: Credit Suisse Trading Strategy, MSCI, Bloomberg, April 1st, 2007 – Dec 15th, 2011
40%
Correlation With Developed and Emerging Markets Increasing Over Time
20%
Low correlation with more developed markets is often cited as one of the main reasons for investing in frontier markets. However, while the correlation between developed and emerging markets has remained relatively stable over the last 6 years (see Exhibit 4), the correlation between frontier markets and more developed markets has increased significantly, thus eroding some of the potential diversification benefits.
0%
Sep 11
Mar 11
Mar 10
Sep 10
Sep 09
Mar 09
Sep 08
Mar 08
Mar 07
MSCI FM vs. DM
Sep 07
Mar 06
Sep 06
Sep 05
-40%
Mar 05
-20%
MSCI FM vs. EM
MSCI DM vs. EM Source: Credit Suisse Trading Strategy, MSCI, Nov 30th, 2004 – Dec 13th, 2011
2
TRADING STRATEGY
Trading in Frontier Markets is Tough Bid-Ask Spreads 2x Higher Than Emerging Markets
Tighter bid-ask spreads are usually reflective of a more open and competitive market. It is therefore not surprising to find that average spreads in frontier markets are 2x higher than emerging markets and 7x higher than developed markets (see Exhibit 5).
50 40
As shown in Exhibit 6, there is a wide variation in bid-ask spreads by country, with no clear trends by region.
30 20
Exhibit 6: Median Bid-Ask Spreads in Frontier Markets* 200
10 0 MSCI FM
MSCI EM
MSCI DM
Source: Credit Suisse Trading Strategy, MSCI, Nov 23rd, 2011
Median Bid-Ask Spread (bps)
Average Bid-Ask Spread (bps)
Exhibit 5: Bid/Ask Spreads Comparison 60
180 160 140 120 100 80 60 40
QATAR
PAKISTAN
VIETNAM
ARGENTINA
TUNISIA
NIGERIA
JORDAN
BAHRAIN
OMAN
ROMANIA
UAE
ESTONIA
SLOVENIA
LITHUANIA
KUWAIT
MAURITIUS
BULGARIA
CROATIA
LEBANON
SERBIA
SRI LANKA
0
KAZAKHSTAN
20
Source: Credit Suisse Trading Strategy, MSCI, Nov 23rd, 2011. *Note: Ukraine and Kenya have bid-ask spreads in excess of 300bps and are excluded from this chart
Exhibit 7: Median Bid-Ask Spreads vs. Turnover
More liquid stocks in Frontier Markets tend to have lower bid-ask spreads (see Exhibit 7), in common with more developed markets. However, some of the largest stocks in the MSCI Frontier Markets index have amongst the widest bid-ask spreads (see Exhibit 8), implying that even optimized portfolios may incur high trading costs.
100
Exhibit 8: Median Bid-Ask Spreads vs. MSCI Index Weighting 1000 MSCI FM
10 MSCI FM MSCI DM MSCI EM 1 10
1000
100000
10000000
Bid-Ask Spread (bps)
Bid-Ask Spread (bps)
1000
Liquid Stocks Have Tighter Spreads, But Some of the Biggest Stocks Have Among Widest Spreads
MSCI DM MSCI EM
NBK KK
100
ZAIN KK
10
Turnover ($k) Source: Credit Suisse Trading Strategy, MSCI, Nov 23rd, 2011
1 0.00
0.01
0.10
1.00
10.00
Weight (%) Source: Credit Suisse Trading Strategy, MSCI, Nov 23rd, 2011 3
TRADING STRATEGY
Gaining Exposure Takes Time Liquidity Disappears at Times of High Stress
Frontier markets are notoriously illiquid, particularly at times of high stress. For example, at the height of the global financial crisis in 2008 Pakistan introduced circuit breaker rules which effectively closed its market (see Exhibit 9). More recently, the UAE has experienced a significant drop in liquidity following the Dubai sovereign debt crisis (see Exhibit 10).
Exhibit 9: Value Traded in Pakistan vs. Volatility 100
3.0
1.6
80
2.5
100
1.2
60
2.0
80
0.8
40
1.5
60
1.0
40
0.4
20
0.5
20
0.0
0 0.0
0
Value Traded ($bn)
120
Jan-12
Jul-11
Jan-11
Jul-10
Jul-09
Jan-10
Jul-08
Jan-09
Jan-08
Jul-07
Jul-06
Jan-07
Jul-05
Jan-06
Jan-05
Volatility
Value traded ($bn)
Dubai Debt Crisis
Jan-12
Jan-11
Jan-10
Jan-09
Jan-08
Jan-07
Jan-06
Jan-05
Jan-04
Jan-03
Global Financial Crisis
Volatility
2.0
Value traded ($bn)
Exhibit 10: Value Traded in Dubai vs. Volatility
VIX Index Value Traded ($bn)
Source: Credit Suisse Trading Strategy, Jan 3rd, 2003 – Jan 5th, 2012
VIX Index
Source: Credit Suisse Trading Strategy, Jan 6th, 2005 – Jan 5th, 2012 [excludes Sundays]
Patience Required Even in “Normal” Conditions Even in “normal” market conditions the time taken to invest a relatively modest amount of money can be considerable. This is reflected in Exhibit 11 which shows the time taken to invest $10m across the MSCI Frontier Markets index at 25% participation based on recent 20d average volumes. While ~80% of the trade completes in 0.5 of a day, it takes a further 2.5 days to complete the trade, according to our estimates.
Exhibit 11: Trade Schedule for $10m investment in MSCI Frontier Markets at 25% Participation 100% 90%
Completion %
80% 70% 60% 50% 40% 30% 20% 10% 0.05
0.1
0.2
0.5
0.8
1
1.5
2
2.5
3
Duration (days) Source: Credit Suisse Trading Strategy, Nov 23rd, 2011 4
TRADING STRATEGY Exhibit 12: Frontier Index Performance Comparison*
Choose Between MSCI, FTSE, S&P and Russell
140%
The MSCI Frontier Markets index is perhaps the most popular frontier markets benchmark, but there are alternatives provided by FTSE, S&P and Russell. Below we highlight the key similarities and differences.
130% 120%
Exhibit 13: Comparison of Frontier Market Benchmarks
110%
Nam e
100%
S&P Frontier 50 BMI
70%
26.4%
25
42.6
50
16
48.5
40.8%
S&P Frontier Broad Market Index
520
36
196.7
16.5%
Russell Frontier Index
570
36
193.1
15.1%
Who’s Next in Line for Promotion? MSCI and FTSE maintain country classification reserve lists which are closely followed by local market authorities and investors. Qatar and the UAE are on the MSCI reserve list for promotion from Frontier to Emerging Market status. At the most recent review MSCI decided not to promote either country citing foreign ownership limits and lack of regulatory progress. The next review will take place in June 2012. Kuwait is on the FTSE reserve list for promotion to Secondary Emerging, while Kazakhstan and Ukraine are being considered for promotion to Frontier Market status. The next FTSE review will take place in March 2012.
Exhibit 14: Frontier Market Regional Weightings 70% MSCI Frontier Markets Index
60%
Middle East accounts for >40% of Index Weightings
The Middle East has a greater than 40% weighting in all 4 indices (see Exhibit 14). Kuwait is a notable absentee from the FTSE index, failing to meet their minimum market regulation and clearing / settlement requirements. In all other indices it commands the largest weighting. Exhibit 15: Frontier Market Country Weightings* 35% 30% 25% 20%
MSCI Frontier Markets Index FTSE Frontier 50 Index S&P Frontier BMI Russell Frontier Index
15% 10% 5% 0%
Source: Credit Suisse Trading Strategy, Nov 23rd, 2011. *Note: Countries with a weighting of