University of Rhode Island
DigitalCommons@URI Senior Honors Projects
Honors Program at the University of Rhode Island
2009
Trade Policy and the Geography of Fashion William Doscher University of Rhode Island
Follow this and additional works at: http://digitalcommons.uri.edu/srhonorsprog Part of the Social and Behavioral Sciences Commons
Recommended Citation Doscher, William, "Trade Policy and the Geography of Fashion" (2009). Senior Honors Projects. Paper 137. http://digitalcommons.uri.edu/srhonorsprog/137
This Article is brought to you for free and open access by the Honors Program at the University of Rhode Island at DigitalCommons@URI. It has been accepted for inclusion in Senior Honors Projects by an authorized administrator of DigitalCommons@URI. For more information, please contact
[email protected].
Trade Policy and the Geography of Fashion
By William Doscher University of Rhode Island Senior Honors Project Spring 2009 Faculty Sponsor: Professor Arthur Mead, Economics
Doscher 2
ABSTRACT
The textile and apparel (T&A) industries are global and constantly on the move. The mobility of these industries can be seen here in Rhode Island, with abandoned textile mills stretched across the state. In its search for the lowest-cost production, the T&A industries moved from northern to southern New England, and then relocated from New England to the Carolinas, and with record high unemployment currently hitting North and South Carolina, there is evidence that the industries are moving again. There is also reason to believe the relocation of the T&A industries will have an international dimension. As world power shifts east in the 21st century, this will bring about a dramatic shift in the production and design of apparel and textiles, which is the issue I will be addressing. More specifically, I will examine how world trade policy has affected the geography of the fashion industry, and what we are likely to see in the upcoming years. I begin the analysis by discussing U.S. trade policy in the 1930s, when countries around the world essentially shut down international trade. The West later determined that the best way to avoid a WW III was to revive world trade decimated by two world wars and the Great Depression. I examine the institutions that emerged from Bretton Woods, namely the International Monetary Fund (IMF), the World Bank, and the General Agreement on Tariffs and Trade (GATT) that were designed to undo the protectionist policies of the 30s. I then look at how postwar public policy in the West impacted the location of the T&A industries, focusing on Japan, Italy and the US, and what we are likely to see in China and other emerging markets.
Keywords: Economics, Trade Policy, Textile and Apparel Industry
Doscher 3
INTRODUCTION
As renowned economist Joseph Stiglitz noted, “It was the Great Depression of the 1930s that was responsible for the wave of liberalization that began sixty years ago [from today].1” Tracing back to this time in history, tariff reduction has since been the prevailing theme of United States trade policy. To understand why and how this has impacted the geography of the textile and apparel industries worldwide, we begin by examining US tariffs during the 1930s and the institutional order of Bretton Woods in 1944. The Bretton Woods system was the US and Britain’s plan for a new international monetary system and the expansion of foreign trade and the removal of tariffs and nontariff barriers to trade following World War II. We then examine the decision made by countries to either follow the globalization model being sold by the US and Britain, or follow the Soviet model and restrict foreign trade during the postwar era. Regions that rebuilt their economies immediately after the war, such as Europe and East Asia, specifically Japan and the four Asian Tigers (Singapore, Hong Kong, South Korea and Taiwan), used the textile and apparel industries as a step-ladder to get their economies going, which contributed to the mobility of these industries worldwide. Finally, we look at the decision made by China and India to open up their economies to foreign trade since the postwar period, and how this has affected the geography of the textile and apparel industries today, and what we are likely to see in the future.
1
Stiglitz, Joseph E. Making Globalization Work, p.74
Doscher 4
PART I. THE ROAD TO BRETTON WOODS
The Smoot-Hawley Tariff Act When the US economy fell into a sharp recession following the stock market crash on October 24, 1929, pressure for protectionist economic policy grew strong.2 During the 1928 presidential election campaign, President Herbert Hoover pledged to help American farmers, “whose wartime markets in Europe were disappearing with the recovery of European agricultural production.3” The original intention of Smoot-Hawley was to increase tariffs specifically on agricultural imports to protect domestic farmers.4 Faced with opposition from many US economists,5 Congress approved an Act that was designed to raise tariffs on imported goods in order to restrain trade between nations, the Smoot-Hawley Tariff Act, implemented in 1930 under the Hoover administration. The protectionist order of the Smoot-Hawley Tariff is revealed below in a graph of tariff rates in the US since 1820.
2
This link between tough economic times and protectionist policies seems relevant to what is happening in the US today as a result of the 2008 financial crisis. 3 “Protectionism in the Interwar Period.” The U.S. Department of State. 3 March 2009. http://www.state.gov/r/pa/ho/time/id/17606.htm 4 “Smoot-Hawley Tariff.” The U.S. Department of State. 3 March 2009. http://future.state.gov/when/time line/1921_timeline/smoot_tariff.html 5 “1,028 Economists Ask Hoover to Veto Pending Tariff Bill.” The New York Times, 5 May 1930. http://www.clubforgrowth.org/media/uploads/smooth%20hawley%20ny%20times%2005%2005%2030.pdf
Doscher 5
The graph provides a wealth of information on the “politics” of US trade policy. Looking back at the Civil War period (1861-65), you can see tariff increases to support northern industrialists.6 You can also see how the democrats reduced tariffs in the 1910s and the republicans increased them in the 1920s.7 Clearly, when Congress passed the SmootHawley tariff in 1930, tariff rates in the US rose dramatically, revealing the protectionist order of US trade policy. Based on the graph, there was nearly a 50% increase in tariff rates from 1920 to 1930. The Smoot-Hawley Tariff eventually proved to be an enormous failure, sinking America deeper into the Great Depression and contributing significantly to the drastic decline in international trade. For example, according to government statistics, US 6
Some believe that the Civil War was fought about tariffs. This proved to be an important trend when examining the series of tariff reductions that took place under the General Agreement on Tariffs and Trade (GATT), which is discussed later in the analysis.
7
Doscher 6
imports from Europe fell from a 1929 high of $1,334 million to $390 million in 1932, while US exports to Europe declined from $2,341 million in 1929 to $784 million in 1932.8 By 1933, the volume of world trade had fallen by nearly 70 percent from its 1929 levels.9 Furthermore, the Act failed to promote any sort political or economic cooperation and trust between nations at a particularly risky period in foreign relations. If there was anything to gain from the Smoot-Hawley Tariff legislation, it marked the beginning of the end of high tariffs in 20th century American trade policy. Four years later, with passage of the Reciprocal Trade Agreements Act, the US moved toward trade liberalization through bilateral and multilateral tariff reductions,10 and began to reconstruct their international trade, financial, and investment relations.
The Reciprocal Trade Agreements Act (RTAA) The negative consequences of the Smoot-Hawley Tariff prompted US policy officials to take the lead in proposing negotiations to reduce tariffs. Secretary of State Cordell Hull, an outspoken supporter of free trade for years as a senator from Tennessee, designed the Reciprocal Trade Agreements Act (RTAA) under the Roosevelt administration, which Congress passed in 1934. Hull pushed for this act by reminding skeptics that “war did not break out between the US and any country with which we had been able to negotiate a trade agreement.11” A similar idea was popularized in an early version of Thomas Friedman’s, The Lexus and the Olive Tree. The idea was to keep people busy at work and not at war.
8
Ibid. Ibid. 10 “Protectionism in the Interwar Period.” 11 Frieden, Jeffry A. Global Capitalism: Its Rise and Fall in the Twentieth Century, p.254 9
Doscher 7
The primary objective of the RTAA was to provide for the negotiation of tariff agreements between the US and foreign nations. The Act ultimately allowed President Roosevelt to negotiate tariff reductions of up to 50 percent with other countries without the approval of Congress.12 As a result, US trade barriers had gone down, and by 1939, the US had signed twenty trade agreements covering 60 percent of the nation’s imports.13 Referring back to the tariff chart, you can see the reductions that resulted from the RTAA, where tariff rates dipped down under 40%. The Act also led to a gradual recovery in employment and exports, both of which had been devastated by the depression. Furthermore, the RTAA swayed other nations in their trade policy decisions. For example, in early 1938 Britain and France agreed to support the former Belgian Prime Minister’s efforts to liberalize trade. Just before the outbreak of World War II, the industrial democracies were committed on paper to reducing trade barriers, and some of them had in fact begun to move in that direction.14 The RTAA clearly signaled a change in the direction of US trade policy. Well before the war ended, the Roosevelt administration concluded that “the lack of an open world economy during the 1930s was a major cause of the war.15” The foreign policy leaders of the Democratic Party believed it was essential for the US to take the lead role in opening an international trading system and be “the guidepost for the remained of the globe16” Therefore, prior to the war’s end, the US and Britain began outlining plans for
12
Ibid, p.248 Ibid. 14 Ibid, 248-249 15 Baldwin, Robert E. “The Changing Nature of U.S. Trade Policy since World War II.” The Structure and Evolution of Recent U.S. Trade Policy. Ed. Robert E. Baldwin and Anne O. Krueger, p.7 16 Frieden, Jeffry A. Global Capitalism: Its Rise and Fall in the Twentieth Century, p.254 13
Doscher 8
the International Trade Organization (ITO), and the Roosevelt administration requested power from Congress to reduce tariffs.
Lend Lease Act and Atlantic Charter The outbreak of World War II, with Lend-Lease Act and the Atlantic Charter of 1941, lent even greater support for a liberal international trading regime. Before the US entered World War II, Congress agreed to a lend-lease agreement with Britain in March 11, 1941. Britain needed the help of the Americans to fend off the Nazis, and under this arrangement, the US was permitted to ‘lend’ war materials to Britain and other Allies between 1941 and 1945. However, there were strings attached to this agreement that put the US in a strong position to insist on opening markets in the UK. Under the Lend-Lease Act, the British committed to freer trade.17 Britain’s pledge to ‘free’ trade resulted from an Atlantic Charter that was signed in August 1941 by President Roosevelt and Prime Minister Churchill. They announced joint aims for war, which included “[furthering] the enjoyment by all states…of access, on equal terms, to the trade and to the raw materials of the world.18” In addition, just after the US entered the war, Britain and the US signed the Lend-Lease Act that committed both nations to reduce trade and tariff barriers, as well as to eliminate discriminatory treatment in international trade.19
17
Ibid, p.256 Ibid. 19 Ibid. 18
Doscher 9
PART II. BRETTON WOODS: A NEW INTERNATIONAL ORDER
In July 1944, the allied nations convened at Bretton Woods, New Hampshire, to design their proposal to rebuild the international monetary system, which had been devastated by World War II and the Great Depression. The goals were to enhance financial stability, support the flow of international investment, and expand foreign trade by removing tariffs and non-tariff barriers to trade. The result was the Bretton Woods agreement, a new international order centered on three institutions: the International Monetary Fund (IMF), the World Bank, and the General Agreement on Tariffs and Trade (GATT).
International Monetary Fund and World Bank If the US and the allies were to achieve their goals, they needed to rebuild the international monetary system. The center of discussion between the US and Britain was the international monetary system. Beginning in 1940, Harry Dexter White and John Maynard Keynes, representing the American and British treasuries drafted proposals for a postwar international economic order.20 Although there existed support among many to continue the international monetary cooperation of the 1930s, early debate focused heavily on the reestablishment of the international gold standard that was abandoned following 1931 financial crisis. Some people, particularly international bankers, felt that a renewed gold standard would best meet their needs. Policymakers, on the other hand, were fearful of retuning to gold on the basis that gold was inflexible, and that “the
20
Helleiner, Eric. States and the Reemergence of Global Finance: From Bretton Woods to the 1990s, p.25
Doscher 10
government could not use monetary policy to stimulate the economy and could not devalue to improve industry’s competitive position.”21 It was the proposal by White and Keynes of an International Monetary Fund (IMF) that would iron out this compromise between the stability of a gold-dollar standard and the flexibility of managed currencies. In early 1944, White and Keynes sought to enhance financial stability by establishing the IMF. Countries would join the IMF and link their currencies to gold at a fixed rate, thereby establishing a ‘pegged rate’ or ‘adjustable peg’ currency regime.22 The IMF would also act as a ‘lender of last resort,’ in which the Fund could lend countries money in times of financial crisis and change currency values under certain economic conditions. As Jeffry Frieden noted in his book, Global Capitalism, “the KeynesianWhite plan balanced the objectives of the American and British governments: currency stability with flexibility, gold backing without rigidity.23” White and Keynes also drafted plans for a multilateral organization known as the International Bank for Reconstruction and Development, or the World Bank. This bank was backed by the governments of the major financial power and was established to ensure that long-term investment would flow to regions that needed it.24 For example, if lenders had become reluctant to fund large projects, such as roads, railroads and ports, which were crucial to private investment, “the bank could borrow on private markets at low interest rates (because of the backers’ guarantee) and re-lend money to projects that would facilitate other private investment.25” It was clear that White and Keynes proposed
21
Frieden, Jeffry A. Global Capitalism: Its Rise and Fall in the Twentieth Century, p.257 Cohen, Benjamin. “Bretton Woods System.” Routledge Encyclopedia of International Political Economy. Ed. R.J. Barry Jones. Routledge, 2002 23 Frieden, Jeffry A. Global Capitalism: Its Rise and Fall in the Twentieth Century, p.257 24 Ibid, p.258 25 Ibid.
22
Doscher 11
this Bank to support the flow of international investment and to act as a supplement, not a replacement, for private lending. In July 1944, delegates from more than forty countries met and finalized plans for the IMF and the World Bank under the leadership of White and Keynes. Although faced with opposition from isolationists and a few international bankers, the US Congress approved the Bretton Woods Agreements Act three weeks later. The Bretton Woods System was unique in that the there had never been an international organization like the IMF, where member countries would agree to subject their decisions on economic policies (e.g. the League of Nations was proposed and never happened), nor had an institution such as the World Bank existed to lend billions of dollars to governments around the world. Keynes, however, was disappointed with the final proposals of the Bretton Woods institutions, mainly because “he believed that a cooperative international agreement was being undone as Americans reworked the Bretton Woods institutions to guarantee American predominance.26” In other words, Keynes was bitter that his homeland, Britain, was losing influence. In fact, at an inaugural meeting, he warned about the danger of politicians capturing the institutions, fearing that the IMF and the World Bank would turn into political instruments. Nonetheless, for the next twenty-five years, the IMF would create the financial stability needed for trade. Next, the establishment of the General Agreement on Tariffs and Trade (GATT) in 1947 would soon become the third ‘pillar’ of the Bretton Woods institutional order.
26
Ibid, p.259
Doscher 12
The General Agreement on Tariffs and Trade (GATT) The expansion of international trade also depended upon reductions of tariff and non-tariff barriers to trade, and at Bretton Woods the debate centered on how best to achieve these reductions. The solution was the establishment of an International Trade Organization (ITO) that was initially proposed to complement the IMF and the World Bank. The ITO would have a wide scope over various aspects of international economic activity, “with rules covering not just commercial policy, but also employment, commodity agreements, restrictive business practices, and international investment.27” However, this agreement never went beyond the proposal phase because the US refused to ratify it. Opponents denounced the ITO charter as “a dangerous document…because it jeopardized the free enterprise system by giving priority to a centralized national governmental planning of foreign trade.28” In other words, the US feared having some supranational agency setting tariff rates on goods it exported and imported.29 Fortunately, the failure to approve the ITO charter did not extinguish the only means of liberalizing world trade policies. At a 1947 meeting in Geneva, twenty-three nations gathered and agreed to enact revised versions of articles from the ITO draft charter. Countries agreed to reduce tariffs amongst themselves, and the General Agreement on Tariffs and Trade (GATT) became the institution for resolving trade disputes and lowering trade barriers.30 In the wake of the ITO’s failure, GATT quickly became the sole institution for overseeing international commercial policies, specifically
27
Irwin, Douglas. “The GATT’s Contribution to Economic Recovery in Post-war Western Europe.” Europe’s Post-war Recovery. Ed. Barry Eichengreen, p.130-131 28 Ibid, p.131 29 Mead, Arthur C. “Possibility Curves and International Trade.” http://www.uri.edu/artsci/ecn/mead/INT 1/Eco/Trade/Read_Trade.html 30 Ibid.
Doscher 13
the reduction of import tariffs. Under GATT, “countries could not discriminate against the products of one nation in favor of other products of another.”31 This meant that each country was required to treat all others the same. All nations would be most favored, hence the name: the ‘most favored nation’ (MFN) clause. Therefore, any reduction in trade barriers between two GATT signatories was offered to all GATT members. Tariff reductions took place in a series of multi-year international conferences, known as rounds, which were organized on a bilateral (country-to-country) basis. The complex bargaining that took place between counties under the rounds proved to be quite successful during the postwar period. The first two rounds that took place in 1950 and 1951 further reduced trade barriers. In fact, by 1952, “tariffs on imports into most European and North American countries were about half their prewar levels.32” By the time the Kennedy Round ended in 1967, average tariffs on nonagricultural goods were significantly reduced. In addition, the industrialized nations, among themselves, had removed most barriers to trade.33 The Kennedy Round was followed by the Tokyo Round (1973-79), and the Uruguay Round (1986-94), which reduced tariff rates further. The Uruguay Round, in particular, extended the range of trade negotiations, “which led to major reductions in agricultural subsidies, an agreement to allow full access for textiles and clothing from developing countries, and an extension of intellectual property rights.34” Referring back to the tariff chart (shown below), you can see the startling affects the GATT rounds had on tariff rates.
31
Frieden, Jeffry A. Global Capitalism: Its Rise and Fall in the Twentieth Century, p.288 Ibid. 33 Ibid. 34 “Timeline: World Trade Organization.” BBC News, 7 January 2009. http://news.bbc.co.uk/2/hi/europe/country_profiles/2430089.stm 32
Doscher 14
GATT
Tariff and non-tariff barriers to trade significantly dropped as result of the GATT rounds. The Uruguay round clearly did the job of driving tariff rates to the lowest point on the graph since 1920, below the 10% rate. GATT, which had 128 member countries, morphed into the World Trade Organization (WTO) in 1995 that currently has 149 member countries, designed to provide faster expansion of trade agreements. Although GATT was not an independent organization like the IMF and the World Bank, it was a forum within which countries met and focused primarily on the liberalization of trade in manufactured goods, the comparative advantage of the advanced industrial nations. However, GATT only dealt with trade in goods, not services,35 which is why there was pressure to create the WTO, where both goods and services would be
35
Mead, Arthur C. “Possibility Curves and International Trade”
Doscher 15
included.36 The results of GATT were impressive, as international pressure to reduce tariffs resulted in an outburst of world trade.
PART III. TO TRADE OR NOT TO TRADE? Bretton Woods was a vision of the future developed by the US and Britain, and countries needed to decide if they wanted in on the system. In other words, the US and Britain decided to rebuild the world around trade during the postwar era, and the rest of the world was ultimately given a choice: to trade or not to trade. This was a decision that Europe, Japan, Latin America, India and China had to make in the aftermath of World War II.
The West decided the best way to avoid a World War III was to revive international trade. However, not every country around the world agreed to the globalization model being sold by the US. The reality was that after WW II ended there was more than one important strand of ideas that affected the geography of the textile and apparel industries. As the world emerged from the war, there were two defining movements that ultimately shaped the postwar era: the Cold War (communism vs. capitalism) and the independence movement. I will briefly discuss each of these movements in turn to provide a sense of how the world was being shaped during the postwar period.
36
There was also limited trade liberalization in important areas for developing countries, such as agriculture and textiles. Textiles, for example, remained subject to strong quotas, on a country-by-country, product-by-product basis, and agriculture remained highly protected and subsidized.
Doscher 16
The Cold War meant that the world was divided into two “teams,” the communists centered in Russia and China, and the capitalists centered in the US and Europe. These were two “teams” had little economic interaction, but did have repeated military interactions as the US was committed to “containing” communism and establishing Mutually Assured Destruction (MAD) as a defense strategy. Nonetheless, communism seemed to be a viable option for those countries looking to choose an economic system, and as European empires began to unravel during this period, there were an extraordinary number of nations looking for a new way forward. What emerged was a simple world made up of those who were with the US and those who were against US. It was the capitalists versus the communists, and the world watched as the two competitors slugged it out.
On the other side, you had the independence movement, which was basically the formula for economic nationalism following WW II. The developing world specifically embraced this idea, closing itself to foreign trade and pursing rapid industrialization.37 The colonies achieved their freedom and the Latin American countries emerged from their isolation period of the Depression and WW II. India, led by Mahatma Gandhi, China, led by Mao Zedong, and Latin America were the major players in the movement toward independence in the postwar era. India, China, and Latin America struggled toward a strategy for national development after the war, and made the decision to restrict foreign trade and shutting themselves off to the rest of the world.
37
Frieden, Jeffry A. Global Capitalism: Its Rise and Fall in the Twentieth Century, p.302
Doscher 17
The Choice: To Trade
In the aftermath of World War II, the US, Europe, Japan, and the four Asian Tigers (Singapore, Hong Kong, South Korea and Taiwan) opened themselves up to foreign trade. We will now observe the decision made by Europe, Japan and the Tigers to follow the new international order of Bretton Woods designed by the US and Britain.
Europe In 1946, Europe began their long process of economic integration, called for by British Prime Minister Winston Churchill in Zurich when he stated, “We must build a kind of United States of Europe.38” At the end World War II, unity was favored by the political climate in Western Europe mainly because it was as an escape from the extreme forms of nationalism that devastated the continent.39 Therefore, the process of integration began in earnest with the successful formation of the European Coal and Steel Community (ECSC) in 1951, which morphed into the European Economic Community (EEC) in 1957. The ECSC successfully unified Western Europe during the Cold War, and established the groundwork for European democracy and the modern-day development of the European Union.40 “The community integrated the six nations’ iron, coal, and steel sectors and quickly created a common market.41” The arrangement was highly favored by
38
“We must build a kind of United States of Europe.” Wikisource: Speeches by British Prime Ministers. http://en.wikisource.org/wiki/We_must_build_ a_kind_of_United_States_of_Europe 39 “The Political Consequences.” European Navigator. 20 April 2009. http://www.ena.lu/ 40 Ibid. 41 Frieden, Jeffry A. Global Capitalism: Its Rise and Fall in the Twentieth Century, p.286
Doscher 18
the US, but this was only a start. Six years later, the ECSC transformed into the EEC that created a single, integrated market for Western European nations by the 1960s. The EEC morphed into the European Union in 1993, and integration quickly took a step further later with Europe’s creation of common currency, the Euro. Nations within the EU were guaranteed ‘four freedoms,’ namely, freedom of movement of people (including workers), good, services and capital.42 While these freedoms were certainly fundamental to the common market, there was concern that integration was creating ‘fortress Europe,’ a set of countries that had external barriers to trade but limited internal barriers. In trade of goods, for example, a customs union applied an external tariff on all goods entering the market. Once the goods were admitted, they could not be subject to import taxes as they traveled internally. The intention was to increase competition and specialization between the EU nations, and this had a large impact on industry growth in Europe, allowing European businesses to compete internationally.43 European unity embraced the Bretton Woods compromises, and proved to be the most ambitious trade liberalization in history.44 The arrangement ultimately eliminated tariffs, with support of the GATT, among the wealthy European nations, leading to a prosperous integrated market during the postwar era. Europeans were spending, and economic growth quickly was translated into consumption. Resulting from the trade agreements established among Western European nations, the textile and apparel industries were present, but really did not thrive in Europe. Italy, for example, surfaced as the primary design center for apparel. Italy
42
“The EU Single Market: Fewer barriers, more opportunities.” European Commission. 21 April 2009. http://ec.europa.eu/internal_market/index_en.htm 43 Frieden, Jeffry A. Global Capitalism: Its Rise and Fall in the Twentieth Century, p.287 44 Ibid, p.287
Doscher 19
maintained a highly entrepreneurial, consumer-based society that likely resulted in emergence of apparel design, and not production, in the region. Since textiles and apparel are labor-intensive industries, production generally thrived in environments found in poor, highly populated countries in East Asia where the cost of production was low. We now turn to Japan, who emerged as the major producer of apparel and textiles in their reconstruction process following WW II.
Japan and the Asian Tigers The textile industry was a significant player in Japan’s early rebuilding process following WW II. Tracing back to the 1920s, the Japanese spinning industry took its place among world leaders and remained a leading employer and exporter for Japan. However, even before the Pacific War broke out, Japan was faced with the problem of overproduction, forcing textile mills into temporary production cartels.45 By the time WW II ended, much of Japan’s mill capacity, particularly in Osaka and Tokyo, was decimated, and Japanese firms soon became deprived of their mills abroad. In fact, “in the spinning industry, only about 10% of the prewar production capacity survived the war.46” Nevertheless, Japan proved to be the most dramatic success story after the Bretton Woods system was put into action. Following the war, “Japanese industrialists moved quickly to adopt new technologies developed in the previous thirty years…drawing on a backlog of new products as well as a highly trained and very cheap labor force.47” The Japanese clearly had the determination, combined with a skilled and low-cost labor force, to industrialize 45
McNamara, Dennis L. Textiles and Industrial Transition in Japan, p.xiii Ibid, p.36-37 47 Frieden, Jeffry A. Global Capitalism: Its Rise and Fall in the Twentieth Century, p.279-280 46
Doscher 20
quickly. Japan’s government supplied funding for equipment and supported manufactures with tax breaks, subsides, inexpensive loans, and other means of assistance. In addition, the U.S. provided Japan with aid for the purchase of American raw cotton,48 which vastly contributed to the reconstruction of industry in Japan, particularly the textile industry, over the next decade. Japan’s rebuilding process and low-cost labor significantly helped textile millers renovate with new machinery and restore production in both foreign and domestic markets.49 As a result, textile production grew fast in the early 1950s. The industry restored its capacity to meet domestic needs, and expanded to supply UN troops during the Korean War from 1950-53.50 During this time, the Japanese proved to be a major force in international trade, as the nation leaned new methods, created new industries, and searched out foreign markets. Japan’s postwar economic ‘miracle’ had begun to accelerate. By 1956, however, the textile industry began to fall into a recession. The industry’s downturn was mainly the result of an armistice in the Korean War, which, for Japanese textile manufactures, meant that they were forced to stop supplying UN troops. Meanwhile, price ceilings had been imposed on exports to the US and Japan’s domestic market for apparel and textiles stagnated. 51 “The decline of textiles among Japanese industries prompted textile investors to explore new areas of investment, which had, in turn, prompted textile firms to diversify out of textiles or take their production abroad.52” Textile and apparel production, beginning in the 1950s, began to relocate specifically to 48
McNamara, Dennis L. Textiles and Industrial Transition in Japan, p.37 Ibid, p.xiv 50 Ibid, p.37 51 Ibid 52 Ibid, p.42 49
Doscher 21
Singapore, Hong Kong, South Korea and Taiwan where labor and the overall cost of production were the cheapest. This evidently triggered a series of protectionist agreements, the Long-term Agreement Regarding International Trade in Cotton Textiles (LTA) in 1964 and the Multi-fiber Agreement (MFA) in 1974, which will be discussed later in the analysis. Aside from the low-cost production that ultimately shifted textile and apparel production out of Japan and into other nations in the regions, Japan’s growth in chemical and heavy industries, and later in areas of high technology, contributed to the decline in relative importance of textiles in the domestic economy. Japanese companies in the 1950s and 1060s, for example, spent one-half of their research and development budgets to buy foreign technology.53 Japanese companies like Sony in electronics (particularly radios and televisions), Honda in motorcycles, and Toyota in automobiles grew rapidly with government support for manufactures through tax breaks, subsidies and cheap loans. As production exports in high-technology items grew, the share of textiles in the total annual value of Japanese exports fell from 30 percent in 1960 to 2.5 percent in 1990.54 Exporting higher-technology goods became cheaper for Japanese manufacturers. Clearly, the shift in textile and apparel production out of Japan beginning in the 1950s is an example of the mobility of these industries. During the postwar period, both central Asia, including India, and East Asia, including Japan and China, were dramatic economic success stories. The success of the region was driven by its export industries, which was only possible because of the US’s task of rebuilding the world around world trade after WW II. Japan was the original Asian Tiger, and its success prompted some
53 54
Frieden, Jeffry A. Global Capitalism: Its Rise and Fall in the Twentieth Century, p.280 McNamara, Dennis L. Textiles and Industrial Transition in Japan, p.41
Doscher 22
copy-cat tigers: Singapore, Hong Kong, South Korea and Taiwan. In terms of GDP growth in the postwar ear (1950-1980), Japan’s economy was growing at an average annual rate of 7.7%, while the Asian Tigers were growing at an annual rate of 8.3%.55 The textile and apparel industries shifted out of Japan and relocated to the Asian Tigers, where Singapore, Hong Kong, South Korea and Taiwan, like Japan, used these industries as a step-ladder to get their economies going during the postwar era. As the industries continued to scour the planet for the lowest cost production, textiles and apparel were on the move once again, this time to China.
The Choice: Not to Trade
On the other hand, there were those countries who decided to restrict foreign trade and close themselves off to the rest of the world. We will now examine the decision made by China, India, and Latin America not to trade during the post-WWII era.
China: The Mao Years
When China’s civil war ended and Mao took control of country in 1949, he made the decision to follow the lead of the Soviet Union and isolate China from the world as a development strategy.56 Under Mao, China maintained a centrally planned economy that was not open to foreign trade and investment. The Chinese government controlled a large share of the country’s economic output by setting production goals, controlling prices, making decisions about the distribution of income, and allocating resources throughout China. 55
Data Source: Angus Maddison Data, Groningen Growth and Development Center. 24, April 2009. 56 Mead, Arthur C. “Made in China.” The Fashion Reader, p.419
Doscher 23
Mao’s primary objective was to move the nation away from their traditional economy that was largely dependent on the agricultural production of individual smallscale households, to a nation that focused on rapid industrialization.57 “Mao’s promise of a better tomorrow was built on a five-year industrial plan [1953 to 1957] that was driven by sates and community owned businesses, agrarian reform that ended land ownership, the Great Leap Forward of 1958 and the Cultural Revolution of 1966.58” His plans for China, however, resulted in major disaster. During the 1950 and 1960s, China was hit with hard times. The failure to increase China’s agricultural production while maintaining high industry growth under Great Leap Forward resulted in severe famine killing millions of Chinese and devastating the country. Mao’s decisions forced China to sit on the sidelines as trade in the West expanded under Bretton Woods following WW II. By the time of Mao died in 1976, China was forced to restructure its economy, with a 5% share of the world’s population.59
India and Latin America
India and Latin America, along with most of Asia and Africa, had adopted similar economic policies through import-substituting industrialization (ISI) during their independence. In the 1950s, Latin America, for example, made a conscientious effort to restrict foreign trade, and “ISI aimed to substitute domestic industrial production for goods that had previously been imported.60” In other words, the first step towards achieving restriction of international trade was to make domestic manufacturing more 57
Naughton, Barry. The Chinese Economy: Transitions and Growth, p.23 Mead, Arthur C. “Made in China.” The Fashion Reader, p.420 59 Ibid, p.420 60 Ibid, p.304 58
Doscher 24
profitable, and this was the ultimate goal of import substitution. Governments implemented trade protection (i.e. high trade barriers), subsidized credits, tax incentives, as well as other ways to boost industrialization. One likely explanation for why India and Latin America embraced the idea highly protectionist policy after gaining independence from British rule was that there seemed to be little interest in an export-led growth model built around establishing economic relations with former colonial power.
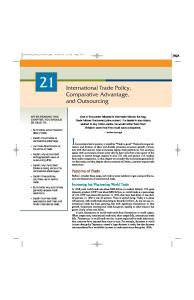
And the Winners were? Now we examine the results of those countries that chose to join the international trading system, and those countries that chose to restrict foreign trade as their postwar development strategy. Below was a graph I generated using Angus Maddison data for the average annual GDP growth rate in the postwar period from 1951 to 1981.
1951-81 9% 8% 7% 6% 5% 4% 3% 2% 1% 0%
Japan
4 Tigers
China
India
Data source: Shares of GDP, Angus Maddison, http://www.ggdc.net/maddison/
Japan and the four Asian tigers (Singapore, Hong Kong, South Korea and Taiwan) are clearly the winners in terms of average annual GDP growth in the post-WW II era. The
Doscher 25
Bretton Woods system had evidently delivered economic growth in the “winning” nations. The liberalization of world trade, however, was perhaps the most important achievement of Bretton Woods. America’s international position, specifically on trade, had fundamentally changed after the war, which was a significant success story of Bretton Woods. As discussed earlier, the US had not been open to foreign goods, and was generally uninterested in foreign markets prior to the war. By the 1950s, US imports from the rest of the world had climbed substantially, and America was now exporting enthusiastically. In fact, US trade in the 1950s was two or three times greater than in the interwar period.61 European and Japanese companies, for example, would sell what they produced in the US market and buy the majority of their capital equipment and supplies from the US American markets and capital, in essence, help reorient the world’s industrial economies. This eventually spared a rival in world trade and investment, driving a burst of growth in Western Europe and Japan, which contributed to the dynamism of the world economy.62 Clearly, the Bretton Woods system fulfilled the original hopes of its architects. Everything seemed to go together in a cycle integration that led to corporate expansion, economic growth, and prosperity.
61 62
Ibid, p.283 Ibid, 283
Doscher 26
PART IV. CHINA AND INDIA RECONSIDER THEIR CHOICES After witnessing the economic miracles of Japan and the four Asian tigers that chose to build their economies around trade (export-led growth), China and India reconsidered their choices for no trade, and eventually opened themselves up the world. First it was China in 1978, followed by India in 1991. We will examine the reform process of both nations, beginning with China.
China Opens Up Following Mao’s death, the control of China became one large power struggle. On one side, you had the Gang of Four who wanted to proceed with the policy of mass mobilization of China, and on the other side, you had the reformers who wanted to lead the country away from Maoist ideologies. Among these reformers was Deng Xiaoping, who made the decision to open China up to the world in 1978. Deng’s objective was to transform China into a market economy, with the creation of four Special Economic Zones located near Taiwan and Hong Kong. The zones allowed businesses to experiment with the ‘free trade,’ and the Chinese government would offer tax and trade incentives to attract foreign investment. Deng’s inspiration to transform China was drawn from the economic miracles of Japan and the Asian tigers (Singapore, Hong Kong, South Korea and Taiwan) that chose to rebuild their economies around trade. Deng witnessed these miracles first-hand, and now it was China’s turn to grow. However, inheriting a country of nearly 1 billion people, Deng quickly realized that productivity, not people, would fuel economic prosperity. He launched his one-child policy in 1979 to decelerate China’s population
Doscher 27
growth. China’s economic growth had to be based on “foreign direct investment (FDI) of multinationals that were attractive for firms looking for access to those 1 billion potential consumers and low labor costs.63” Overseas firms began to relocate operations to China, mainly because of cheap labor costs, and also their inability to compete with “The China Price.64” The results of China’s reform processes were remarkable, and soon after China joined the world trading system in 2001, Chinese exports of manufactures began flooding the world market. Between 1980 and 2000, China’s share of world manufacturing exports increases 6-fold, and China generated rapid economic growth averaging 10% a year and lifted 422 million people above the $1 a day poverty line.65 This was the largest improvement by any country in history. Similar to Japan and the Asian Tigers, China used the labor-intensive textile an apparel industries as a stepping-stone to their economic prosperity. China quickly emerged as a major producer and exporter of textiles and apparel worldwide. To understand how and why these industries have centered themselves in China in recent decades, it is necessary to get glimpse at the nation’s economic history and development strategy during China’s communist revolution under by Mao Zedong, leading up to the nation’s economic reform process under Deng Xiaoping beginning in 1978. It was these processes that ultimately altered China’s relationship with the world.
63
Ibid. Engardio, Pete and Dexter Roberts. “The China Price.” BusinessWeek Special Report. 6, December 2004. http://www.businessweek.com/magazine/content/04_49/b3911401.htm 65 Zeng, Douglas Zhihua. “China’s Employment Challenges and Strategies after WTO Accession.” World Bank Research Working Paper, February 2005. http://papers.ssrn.com/sol3/papers.cfm?abstract_id=667861
64
Doscher 28
There is no question that the reduction of trade barriers and China’s large pool of low-cost labor has resulted in the country’s emergence as the textile and apparel manufacturer of the world. The relocation of textile and apparel production, beginning in the 1950s in Japan and then moving on to the four Asian tigers (Singapore, Hong Kong, South Korea and Taiwan) happened quickly, and significantly contributed to the economic miracles displayed by those countries. As the T&A industry thrived in environments found in poor, agricultural countries where labor was vast and cheap, apparel and textiles were viewed by many as the first step on the economic development ladder, and the “proof” was success stories displayed by Japan and the tigers after WW II.66 With reduced barriers to trade and an ample supply of cheap labor, the industries relocated to China and remain their as a leading producer and exporter of textiles and apparel. The affects that China has had on the T&A industries were remarkable. Based on a series of trade statistics compiled from the World Trade Organization, there is evidence that clearly supports a global shift in apparel production from the year 2000 to 2007. China grew rapidly as a supplier of clothing during this period, specifically to the US and the EU For example, in 2001, China surpassed Mexico as the largest exporter of apparel to the US, increasing its supply of clothing from $8750 million in the year 2000, to around $28,500 million by 2007.67 China’s growth in apparel exports to the US skyrocketed by 225.8% in over seven years, which is an average annual rate of 18.4%.68 In terms of textile production, China is currently second to the EU as the largest exporter
66
Ibid, p.421 International Trade Statistics_2008, World Trade Organization. 68 Ibid.
67
Doscher 29
in the world. As of 2007, China represented 23.5% of the world’s textile exports, behind the EU’s (accounting for 27 nations) share of 33.9%.69 Clearly, these numbers alone illustrate that China has been a rock star of economic growth, prove that China has been among the leading producers and exporters of apparel and textiles. Perhaps the main ingredient was due to China joining the World Trade Organization (WTO) in 2001. Since then, China has further opened itself up to international trade, and with low trade barriers and a cheap labor supply, China has grown in its value and share as a world supplier of textiles and apparel. Now we turn to look at India’s economic liberalization beginning in 1991, and the country’s emerging market for textiles and apparel.
India Opens Up Like China, India made the decision to open up its economy to the world, only much later. India remained isolated from the world and adhered to Socialist policies after its independence from Europe in 1947. It was not until 1991 that India began its process of economic liberalization. In the 1980s, India was led by Rajiv Gandhi, who was largely responsible for the country’s economic liberalization. Gandhi lightly started to reform India in the 80s. New policies included opening up to trade and foreign investment, reforming capital markets and deregulating domestic business, among other reforms.70 Since 1991, India has remained one of today’s rapidly emerging markets.
69
Ibid. Panagariya, Arvind. “India in the 1980s and 1990s: A Triumph of Reforms.” Columbia University, 3 January 2009. http://129.3.20.41/eps/it/papers/0403/0403005.pdf
70
Doscher 30
Recently, the fruits of liberalization reached their peak for India in 2007, when it recorded a 9% growth in GDP, the highest in the country’s history.71 In terms of trade, India reduced tariffs from an average of 85% to 25%, and rolled back quantitative controls, making the rupee convertible on trade account.72 As India’s trade policy opened up to the world, the country has since exhibited rapid economic growth and increased its trade volume in textiles and apparel. In 2007, for example India exported $5.09 million of textile in 2000, which gradually increased to $9.5 million (4% share of world market) by 2007.73 In the apparel, India exported $6 million in 2000, and was exporting $9.7 million by 2007.74 The numbers clearly show that India has been a rising star in the production of textiles and apparel.
It Works
As we have seen, the decision by China and India to open up to the world was largely successful for them. Now, we return to the Angus Maddison data for the average annual GDP growth rate, this time for the period since the postwar era, from 1981 to 2006, as evidence for China’s and India’s success story (refer to the graph below).
71
Central Intelligence Agency. The World Factbook. Updated 23 April 2009 https://www.cia.gov/library/publications/ the-world-factbook/geos/in.html#Econ 72 Delong, J. Bradford. “The Indian Growth Miracle.” July 2001. http://econ161.berkeley.edu/Econ_Articles/India/India_Rodrik_DeLong.html 73 International Trade Statistics_2008, World Trade Organization. http://www.wto.org/english/res_e/statis_e/its2008_e/its08_toc_e.htm 74 Ibid.
Doscher 31
1981-2006 9% 8% 7% 6% 5% 4% 3% 2% 1% 0%
Japan
4 Tigers
China
India
Data source: Shares of GDP, Angus Maddison, http://www.ggdc.net/maddison/
China clearly emerged as the winner during this period in terms of average annual GDP growth, at 8.1%.75 India’s economic growth was also incredibly impressive, increasing in average annual GDP from 3.7% during their isolation in the post-WW II era, to 6% after their economic liberalization.76 India, therefore, nearly doubled their economic performance since opening themselves up to the world in 1991. Now that we have examined the results of China and India opening up to the world and their emergence as “players” in the textile and apparel industries, it is time to consider the future of these industries. However, in order to look forward we need to look beyond the world of GATT and tariff reductions and examine more closely the “special” treatment of textiles and apparel under the Multi-Fiber Agreement.
75
Shares of GDP, Angus Maddison, The Groningen Growth and Development Centre, Statistics on World Population, GDP and Per Capita GDP, 1-2006 AD (March 2009 update copyright Angus Maddison). http://www.ggdc.net/maddison/ 76 Ibid.
Doscher 32
PART V. THE MULTI-FIBER AGREEMENT AND TRADE
To understand how trade policy has helped shape the geography of the textile and apparel industries (T&A), it is imperative that take a look at the establishment of the Multi-Fiber Agreement in 1974 that emerged under GATT, which essentially ‘singled out’ the T&A industries. Beginning in 1974, textiles and apparel were singled out as industries to get ‘special treatment’ under GATT. The rules of international trade governed by GATT were never applied to the field of cotton textiles from the start. In the postwar years, there was growth in the demand for products of cotton textile industries of the developed countries, and Japan and Hong Kong emerged as significant the exporters during the 1960s.77 A Long-term Arrangement Regarding International Trade in Cotton Textiles (LTA) was established in 1962 to prevent the raid influx of textile imports in the developed markets, particularly the US In fact, the US textile regions of Maine, South Carolina, Alabama, Georgia, Louisiana, Mississippi and Massachusetts organized state government action against Japanese textiles.78 The idea was basically to avoid serious threat to domestic producers by establishing quotas on the imports of cotton goods. Therefore, the US can be seen here as a leading advocate for protectionism.79 The LTA eventually led to the signing of the Multi-Fiber Agreement (MFA) in 1974, which imposed further quotas on the amount of cotton goods, and also extended to other goods, such as wool and man-made fibers, that developing countries could export to
77
Khanna, Sri Ram. International Trade in Textiles: MFA Quotas and a Developing Exporting Country, pp.21-22 78 Ibid, p.22 79 Ibid, p.23
Doscher 33
developed countries. All quotas would therefore be negotiated bilaterally and governed under the MFA. Japan and the four Asian Tigers (Singapore, Hong Kong, South Korea and Taiwan) had a competitive advantage in textile production because the industry was labor intensive, and they had low-cost labor. Despite the intentions of the MFA, perhaps its most undesirable feature was that it violated the ‘most favored nation’ clause (nondiscrimination), a critical component of the GATT. The MFA went on to govern international trade in apparel textiles until it was replaced by the Agreement of Textiles and Clothing (ATC). Under jurisdiction of the World Trade Organization, the ATC “established a 4-stage quota liberalization schedule to eliminate all quotas on apparel and textiles by January 1, 2005.80” The ATC was now governed by the general rules and disciplines embodied in the multilateral trading system. The textile and apparel (T&A) industries are relatively small industries in the US However, there is evidence that the T&A industries are mobile domestically. When the T&A industries first came to the US in the late 1700s, many set up operations in the northeast, specifically in Maine and New England. As the industries continued to search for the lowest-cost production in the US, the industries relocated to the South, specifically to North and South Carolina. The graph I generated below is based on employment statistics complied by the US Bureau of Labor, there has been dwindling employment in these industries since the 1990s (refer to the graph below).
80
Mead, Arthur C. “Made in China.” The Fashion Reader. Ed. Linda Welters and Abby Lillethun, p.421
nds)
Doscher 34
U.S. Employment in the Textile and Apparel Industries January 1990 to January 2009
Employees(thousands)
1000
800
600
Apparel
400
200
Textiles
0 1990
1992
1994
1996
1998
2000
2002
2004
2006
2008
Data source: US Bureau of Labor Statistics. http://www.bls.gov/
Employment in the T&A Industry has significantly been declining. The year 2001 resulted in a significant dip in the industries, which was likely due to the September 11th terrorist attacks. Now, let’s compare this drop in employment with two other US industries, primary metals and machines.
U.S. Employment in Primary Metals and Machines (th
January 1990 to January 2009
Employees( thousands )
2000 1600
Machines
1200
Primary Metals
800 400 0 1990
1992
1994
1996
1998
2000
2002
Data source: US Bureau of Labor Statistics. http://www.bls.gov/
2004
2006
2008
Doscher 35
Clearly, employment in machines and primary metals remained relatively consistent since the 1990s. This provides evidence that US employment in textiles and apparel is dropping much faster than other industries in the US Therefore, we have further reason to believe that the T&A industries are domestically on the move again. In fact, based on the high unemployment rates currently hitting North Carolina and South Carolina, the T&A industries are relocating to areas that are cheaper for production.
PART VI. WHAT IS THE FUTURE OF THE T&A INDUSTRIES? After examining the mobility of the textile and apparel industries (T&A) from Japan to the Asian Tigers, and from the Asian Tigers to China, the question is where the future of these industries will lie. What will happen over the next five years? The next ten years? Will these industries continue to scour the planet for the lowest-cost production as China becomes too expensive? As we have seen, China has emerged as the major producer in textiles and apparel, but if things go as history would suggest, then the T&A industries will be on the move again. What is certain is that soon after the turn of the century, the apparel industry received two big shocks: China’s entry into the WTO in 2001 and the end of the MFA in 2005.81 How the T&A industries respond to these shocks will largely depend on future developments in trade policies and China. There is reason to believe that we may see the T&A industries moving out of China in the future. The extent to which China’s competitive advantages (i.e. large population of low-cost labor) are sustainable in the longer term is the driving factor that
81
Mead, Arthur C. “Made in China.” The Fashion Reader. Ed. Linda Welters and Abby Lillethun, p. 422
Doscher 36
will largely determine the mobility of textiles and apparel out of China. This was undoubtedly the reason why “‘sustainable’ was one of the three guiding principles in China’s 11th 5-year plan.82” In terms of China’s “sustainability,” we must consider the potential limitations to China’s market share: growing inequality (i.e. demographics), environmental degradation and increased resource demands, and political instability and social unrest. These three factors are challenges that currently face China, and it may just be a matter of time before these limitations severely affect China’s economy, and their T&A industries. In recent years, there has been growing disparities between urban and rural China. In 2005, nearly 800 million (out of 1.3 billion) Chinese were living in China’s cities, where incomes were low and jobs were scarce.83 There has also been a massive ruralurban migration within China, and with the closing of the state owned enterprises, millions of Chinese workers have been displaced. The Chinese government will be forced to generate possibly 8-10 million jobs,84 which, for apparel means a lot of state support since apparel is a labor-intensive industry. However, “there will be pressure to move operations to inland, and this will raise transportation time and costs and reduce China’s competitive advantage.85 This is sure to have an impact on geography of the T&A industries in China, specifically if demand changes remain as high as they are. China’s environment and growing demand for resources is another factor that is likely to limit China’s market share. According to the US Energy Information
82
Ibid, p.423 Ibid. 84 Zeng, Douglas Zhihua. “China’s Employment Challenges and Strategies after WTO Accession.” 85 Mead, Arthur C. “Made in China.” The Fashion Reader. Ed. Linda Welters and Abby Lillethun, p. 422 83
Doscher 37
Administration’s report on the world’s ten most polluted cities, seven were in China.86 It is highly unlikely that China will be able to ignore its environmental and resource demands as they continue their process of industrialization. The issue of environmental degradation and China’s increasing potential for political instability and social unrest, will likely as brakes to this economic in the not-so-distant future, largely impacting the T&A industries within China. After looking at the history of trade policy and observing the mobility of the textile and apparel industries worldwide, as well as examining the constraints to growth that face China, it is my projection that the T&A industries will likely be on the move again as we head further into the post-MFA world. While it is not exactly certain when and where the primary source of production for these industries may end up, India, which we have discovered is an emerging market for textiles and apparel, is likely the most promising location for the future of these industries.
86
“China: Economics, Demographics and the Environment.” U.S. Energy Information Administration. 28 April 2009. http://www.eia.doe.gov/emeu/cabs/china/part1.html
Doscher 38
Sources
“1,028 Economists Ask Hoover to Veto Pending Tariff Bill.” The New York Times, ProQuest Historical newspapers (1851-2003), 5 May 1930. Baldwin, Robert E. “The Changing Nature of U.S. Trade Policy since World War II.” The Structure and Evolution of Recent U.S. Trade Policy. Ed. Robert E. Baldwin and Anne O. Krueger. Chicago: University of Chicago Press, 1984, pp.5-31 Central Intelligence Agency. The World FactBook. Updated 23 April 2009.