J. Mex. Chem. Soc. 2009, 53(1), 34-40 © 2009, Sociedad Química de México ISSN 1870-249X
Article
Titrimetric and Spectrophotometric Assay of Pantoprazole in Pharmaceuticals Using Permanganate Kanakapura Basavaiah,1* Nagaraju Rajendraprasad,1 Kalsang Tharpa,1 Urdigere Rangachar Anilkumar,1 Salamara Ganeshbhat Hiriyanna,2 and Kanakapura Basavaiah Vinay2 1 Department
of Chemistry, University of Mysore, Manasagangothri, Mysore-570006, India.
[email protected]. Tel: 09448939105; Fax: 0091-821-2421263, 2516133. 2 Process Analytical Laboratory, Advinus Therapeutics, Peenya, II Phase, Bangalore-560058, India. Received November 18, 2008; Accepted March 12, 2009 Abstract. Titrimetric and spectrophotometric assay of pantoprazole sodium (PPS) using permanganate as the oxidimetric reagent is described. In titrimetry, PPS is treated with a measured excess of permanganate in H2SO4 medium followed by the determination of unreacted oxidant by back titrating with a standard iron(II) solution. Spectrophotometry involves addition of a known excess of permanganate to PPS in H2SO4 medium followed by the measurement of absorbance of the residual permanganate at 545 nm. In both the methods, the amount of permanganate reacted corresponds to the PPS content. Experimental conditions that provide wide linear range, maximum sensitivity and selectivity, and accuracy and precisions have been optimized. In titrimetry, the calculations are based on a 1:1 (PPS : KMnO4) reaction stoichiometry and the method is applicable over 1.0-7.0 mg range. In spectrophotometry, Beer’s law is obeyed over the concentration range 15.0-150.0 µg mL-1. The linear regression equation of the calibration graph is A = 0.78 + 0.005 C with a regression coefficient (r) of 0.9982 (n = 11). The apparent molar absorptivity is calculated to be 2.213 × 10³ l mol-1cm-1 and the Sandell sensitivity is 0.1954 µg cm-2. The limits of detection (LOD) and quantification (LOQ) calculated as per the ICH guidelines are 0.73 and 2.21 µg mL-1, respectively. Accuracy and precision of the assays were determined by computing the intra-day and inter-day variations at three different levels of PPS; the intra-day and inter-day RSD was < 3.09 % and the accuracy was better than 3.5 %. The methods were successfully applied to the determination of PPS in three different brands of tablets with good accuracy and precision, and without detectable interference by excipients. The accuracy was further ascertained by placebo blank and synthetic mixture analyses and also by recovery experiments via standard-addition procedure. Key words: Pantoprazole, assay, titrimetry, spectrophotometry, permanganate, pharmaceuticals.
Resumen. En este trabajo se describe la cuantificación de pantoprazol sódico (PPS) mediante una valoración redox usando permanganato como agente oxidante siguiendo la determinación potenciométrica y espectrofotométricamente. En potenciometría, se adiciona un exceso de permanganato en medio H2SO4 y el PPS es cuantificado valorando el excedente de permanganato con una solución estándar de Fe(II). La determinación espectrofotométrica se realiza agregando permanganato a una concentración que asegure un exceso conocido y se mide la absorbancia del permanganato residual a 545 nm. En ambos métodos la cantidad de permanganato que reacciona con PPS esta relacionada con el contenido de PPS. Fueron optimizadas las condiciones experimentales que proporcionan un rango lineal, selectividad y sensibilidad máxima, precisión y exactitud. En potenciometría, los cálculos se basan en una estequiométrica de reacción 1:1 (PPS: KMnO4) y el método es aplicable en un intervalo de 1.0-7.0 mg. En espectrofotometría, la ley de Beer es lineal en un intervalo de concentración de 15.0-150.0 µg mL-1. La regresión lineal para la curva de calibración es A = 0.78 + 0.005 C con un coeficiente de regresión (r) de 0.9982 (n = 11). El coeficiente de absorbitividad molar calculado fue de 2.213 × 10³ l mol-1 cm-1 y la sensibilidad de Sandell de 0.1954 µg cm-2. Los límites de detección y cuantificación calculados de acuerdo con la guía ICH son 0.73 y 2.21 µg mL-1, respectivamente. La precisión y exactitud de los ensayos fueron determinadas calculando la variación intra-día e inter-día a tres niveles de PPS; la desviación estándar relativa intra-día e inter-día fue < 3.09 % y la exactitud fue mejor que 3.5 %. Los métodos fueron exitosamente aplicados para la determinación de PPS en tres diferentes marcas de tabletas con buena exactitud y precisión y sin interferencia detectable por los excipientes. La exactitud fue asegurada realizando el análisis de un placebo blanco y una muestra sintética y también por los experimentos de recuperación vía el procedimiento de adiciones estándar. Palabras clave: Pantoprazole, ensayo, potenciometría, espectrofotometría, permanganato, fármacos.
Introduction
continue to the methods of choice in laboratories of developing and under developed nations. Despite its long history and versatility, titrimetry has not found a place among the techniques used in the assay of PPS. There are three reports on
Pantoprazole, 5-(Difluoromethoxy)-2–[(3,4-dimethoxy-2pyridinyl)methyl]-1H-benzimidazole (Fig. 1), is used as an antiulcerative agent [1] in the form of pantoprazole sodium (PPS) sesquihydrate. PPS is pharmaceutically formulated as gastro-resistant tablets containing 40.0, 20.0 mg pantoprazole. PPS is a non official drug and the literature is scanty on methods for its assay in dosage form. Few methods reported are based on techniques such as high-performance liquid chromatography [2-5], densitometric HPTLC [6], derivative UV-spectrophotometry [7] and difference UV-spectrophotometry [8]. Titrimetry and spectrophotometry, because their simplicity, speed, accuracy and precision, and cost effectiveness
F O F N
O O
S N
N
O
Fig. 1. Structure of pantoprazole sodium.
+
Na
35
Titrimetric and Spectrophotometric Assay of Pantoprazole in Pharmaceuticals Using Permanganate
Results and Discussion Potassium permanganate has been found to be a useful oxidimetric reagent in organic and inorganic analysis [16, 17]. In recent years, it has used in the assay of drugs such as thioxanthines [18], isoniazid [19], methyl thiouracil [20], chloramphenicol [21], amidopyrine [22], valdecoxib [23], nicotine [24], tramodol HCl [25], cefuroxime [26], diloxamide [27], and pentacozine [28], to name a few. In the present work, permanganate was found to react with PPS in acid medium, and the amount reacted was found to be in proportion to the amount of drug, thus offering new methods for the determination of PPS. The proposed methods are based on the oxidation of PPS by a measured excess of KMnO4 in acid medium followed by the determination of the unreacted oxidant either by back titration with iron(II) or by spectrophotometric measurement at 545 nm. In both the methods, the amount of KMnO4 reacted corresponded to the amount of drug which served as the basis of assay.
Method Development The experimental variables which provided accurate and precise results were optimized. In titrimetry, the reaction was found to be stoichiometric in H2SO4 medium. A constant reaction stoichiometry of 1:1 (PPS:KMnO4) was obtained when 0.4-0.6 M H 2SO 4 was maintained. Hence ~0.5 M H 2SO 4 was used as the optimum for the reaction between PPS and KMnO4, and for the latters’s back titration with iron(II). The reaction was complete in 10 min, and beyond this standing time and up to 30 min small amounts of permanganate were consumed but without yielding any definite reaction stoichiometry. Further, on standing for 15 min, the reaction mixture showed slight turbidity and this increased with the standing time. Hence, it is necessary to terminate the reaction at the end of the tenth min by back titrating the residual permanganate with iron(II). In spectrophotometry, it was difficult to fix a reasonable reaction time in H2SO4 medium; and H3PO4 was found to yield better results with respect to reaction time, sensitivity and stability of unreacted permanganate. Two ml of syrupy H3PO4 in a total volume of 8 mL was adequate. Even as a diluent it gave a better sensitivity compared to water. The reaction between PPS and KMnO4 was complete in 15 min, and the permanganate colour was stable for 10 min thereafter.
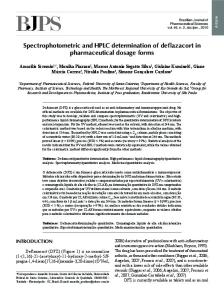
Method Validation Linear Range and Sensitivity Over the range investigated (1-7 mg), a fixed stoichiometry of 1:1 (PPS : KMnO4) was obtained in titrimetry which served as the basis for calculations. In spectrophotometry, the calibration was found to be linear from 15-150 µg mL-1 PPS. The measured absorbance values were plotted vs concentration (Fig. 2). The least square calibration equation was A = 0.78 + 0.005 C (where the concentration is measured in µg mL-1) with a regression coefficient of 0.9982 (n = 11). The calculated 0.8 0.7 0.6 Absorbance
the application of visible spectrophotometry in the assay of PPS in tablet dosage form. A method based on the formation of an ethanol-soluble coloured chelate with iron(III) has been reported by Salama et al [9, 10], Moustafa [11] has described three procedures for the assay of PPS in tablets. Two are based on charge transfere (CT) complex formation reaction using 2, 3-dichloro-5,6-dicyano-1,4-benzoquinone (DDBQ) and iodine as π-acceptor and s-acceptor, respectively. The third method is based on the formation of a ternary complex and involving Cu(II) and eosin as reagents. Two of the present authors [12, 13] have determined the drug bromatometrically based on the bleaching action of bromine on two dyes, methyl orange and indigo carmine [12] and on redox and complex formation reactions [13]. The same authors have used NBS as the oxidant for the assay of PPS based on similar reaction schemes, but NBS in solution is quite unstable and requires daily standardization. Further, the reported methods [12-14] involves too many steps which may introduce inaccuracy and imprecision in the assay. An inspection of the performance characteristics of the reported spectrophotometric methods [9-14] reveals that some of them suffer from such disadvantages as narrow linear range, lower sensitivity, lack of selectivity, use of liquid-liquid extraction step and/or use of expensive reagents and organic solvents as reaction medium or involving multi steps. This paper describes two rapid, simple and economical methods for the determination of PPS in pure and dosage forms. The methods rely on the oxidizing ability of permanganate in H2SO4 medium and the quantifications were achieved by titrimetry and spectrophotometry. In both the methods, PPS was reacted with a measured excess of permanganate in H2SO4 medium, and after a specified standing time, the unreacted oxidant was determined either by titrimetry or spectrophotometry and correlated to the drug amount (titrimetry) or concentration (spectrophotometry). The developed methods were validated according to the current ICH guidelines [15] for linearity, range of determination, selectivity, accuracy and precision, and robustness and ruggedness.
0.5 0.4 0.3 0.2 0.1 0 0
15
30
45
60
75
90
105 120 135 150
Concentration of drug (µg/m L)
Fig. 2. Calibration curve for spectrophotometric method.
36 J. Mex. Chem. Soc. 2009, 53(1)
Kanakapura Basavaiah et al.
Table 1. Comparison of the performance characteristic of the existing spectrophotometric methods with the proposed method. Sl. No.
Reagent/s used
Methodology
Linear range (µg ml-1)
Remarks
Ref.
1
Trivalent iron
1:2 chelated in EtOH medium measured at 455 nm.
30-300
Ethanolic medium used, less sensitive.
2
a) DDBQ
C-T complex measured at 457 nm.
10-60
Narrow linear range, use of organic solvent.
b) Iodine
C-T complex measured at 293 and 359 nm.
18-142
Measured at shorter wavelength, use of organic solvent.
c) Cu (II)-eosin
Ternary complex measured at 549 nm.
4-26
Narrow linear range, involves liquid-liquid extraction and use of organic solvent medium.
3
BrO3--Br‑/MO, IC
Unbleached colour of MO/IC measured at 510/ 610 nm.
0.12-1.5 (Є = 1.8 × 10⁵) 0.5-6.0 (Є = 4.1 × 10⁴)
Less selective, accurate concentration of bromate and dyes to be known.
12
4
BrO3--Br - / Fe(II)-SCNor Fe(II)-tiron
Fe(II)-SCN- complex or Fe(II)-tiron complex measured at 470 or 670 nm.
0.12-1.25 (Є = 2.2 × 10⁵) 0.25-2.5 (Є = 1.2 × 10⁵)
Less selective
13
5
NBS/Fe(II)-SCN- or Fe(II)-tiron
Fe(II)-SCN- complex or Fe(II)-tiron complex measured at 470 or 670 nm.
0.25-3.5 (Є = 1.4 × 10⁵) 1.0-15 (Є = 2.5 × 10⁴)
Involves use of an unstable oxidant and too many steps.
14
6
PPS-KMnO4 In orthophosphoric acid medium,
Unreacted KMnO4 measured at 545 nm
15-150 (Є = 2.226 × 10³ l mol-1cm-1)
9, 10
11
Involves a single step of measuring unreacted Present permanganate. No use of organic solvent, wide work linear dynamic range, robust and rugged, cost effective.
DDBQ. Dichloro dicyanobenzoquinone; MO. Methyl orange; IC. Indigo carmine.
molar absorptivity and Sandell sensitivity values are 2.213 × 10³ l mol-1cm-1 and 0.1954 µg cm-2, respectively. The limits of detection (LOD) and quantification (LOQ) were calculated according to the ICH guidelines [15] using the formulae: LOD = 3.3 SD/slope and LOQ = 10 SD/slope, (where SD is the standard deviation of of the absorbance of seven blank readings). The calculated LOD and LOQ are 0.73 and 2.21 µg mL-1, respectively. Selectivity The proposed methods were tested for selectivity by placebo blank and synthetic mixture analyses. A placebo blank containing talc (20 mg), starch (15 mg), lactose (5 mg), calcium carbonate (10 mg), calcium dihydrogenorthophosphate (10 mg), methyl cellulose (5 mg), sodium alginate (15 mg) and magnesium stearate (10 mg) was prepared, extracted with water and solution made as described under “procedure for tablets”. A convenient aliquot of solution was subjected to analysis by titrimetry and spectrophotometry according to the recom-
mended procedure. In both the case, there was no measurable consumption of permanganate suggesting the non-interference by the inactive ingredients. A separate experiment was performed with synthetic mixture. To the placebo blank of similar composition, 100 mg of PPS was added, homogenized and the solution of the synthetic mixture was prepared as done under “procedure for tablets”. Five mL of the resulting solution was assayed titrimetrically (n = 5) which yielded a % recovery of 102.3 ± 0.62. The same solution was diluted to yield 300 µg mL-1 with respect to PPS, and a 3 mL aliquot was subjected to analysis (n = 5) by spectrophotometry when a 101.7 % recovery with standard deviation of 0.86 was achieved for PPS added. These results complement the findings of the placebo blank analysis with respect to selectivity. Accuracy and Precision The repeatability of the proposed methods was determined by performing replicate determinations. The intra-day and interday variation in the analysis of PPS was measured at three different levels. The accuracy of an analytical method expresses
37
Titrimetric and Spectrophotometric Assay of Pantoprazole in Pharmaceuticals Using Permanganate
Application to Tablet Analysis
the closeness between the reference value and the found value. Accuracy was evaluated as percentage relative error between the measured and taken amounts/concentrations. The results of this study are compiled in Table. 2 and speak of the excellent intermediate precision (%RSD < 3.09) and accuracy (%RE < 3.43) of the results.
Commercial PPS tablets were analyzed using the developed methods and also a reference method [5]. The results obtained were compared statistically by the Student’s t-test and the variance-ratio F-test. The calculated t- and F- values did not exceed the tabulated values of 2.77 (t) and 6.39 (F) at the 95 % confidence level and for four degrees of freedom, indicating close similarity between the proposed methods and the reference method with respect to accuracy and precision. These results are summarized in Table. 4.
Robustness and Ruggedness To evaluate the robustness of the methods, reaction time and H2SO4 concentrations were slightly altered with reference to optimum values in titrimetry. However, in spectrophotometry, only the reaction time was altered. To check the ruggedness, analysis was performed by four different analysts; and on three different spectrophotometers by the same analyst. The robustness and the ruggedness were checked at three different drug levels. The intermediate precision, expressed as percent RSD, which is a measure of robustness and ruggedness was within the acceptable limits as shown in the Table. 3.
Recovery Study To further ascertain the accuracy and reliability of the methods, recovery experiments were performed via standard-addition procedure. Pre-analysed tablet powder was spiked with pure PPS at three different levels and the total was found by the proposed methods. Each determination was repeated three
Table 2. Intra-day and inter-day accuracy and precision. Intra-day accuracy and precision Method* Titrimetry
Spectrophotometry
Inter-day accuracy and precision
PPS taken
PPS found
RE %
RSD %
SE
PPS found
RE %
RSD %
SE
2.0 4.0 6.0
2.03 4.03 6.01
1.50 0.75 0.16
1.33 0.75 0.54
0.01 0.01 0.01
2.03 4.03 6.06
1.5 0.75 1.0
1.58 1.14 1.26
0.01 0.02 0.03
40.0 80.0 120.0
41.03 81.70 122.7
2.58 2.13 2.25
2.33 1.10 0.302
0.36 0.34 0.14
41.37 82.54 123.55
3.43 3.18 2.96
2.75 3.09 2.64
0.43 0.96 1.23
RE. relative error; RSD. Relative standard deviation and SE. standard error. *In titrimetry, PPS taken/found, and SE are in mg and they are µg mL-1 in spectrophotometry.
Table 3. Robustness and ruggedness. Titrimetry Robustness (RSD %) PPS studied mg
2.0 4.0 6.0 *In
Conditions altered* Acid concentration (n = 3)
Reaction time (n = 3)
1.56 1.38 1.74
2.24 1.85 1.47
Spectrophotometry Ruggedness (RSD %) Interanalysts (n = 4) 0.65 0.72 0.41
Robustness (RSD %) PPS studied µg mL-1
40 80 120
Conditions altered
Ruggedness (RSD %)
Reaction time (n = 3)
Interanalysts (n = 4)
Interinstruments (n = 3)
2.67 1.54 3.14
1.56 2.38 1.85
3.76 1.94 2.38
titrimetry, 0.4, 0.5 and 0.6 M H2SO4 concentrations, 8, 10 and 12 min reaction times used. In spectrophotometry, 13, 15 and 17 min reaction times employed.
38 J. Mex. Chem. Soc. 2009, 53(1)
Kanakapura Basavaiah et al.
Table 4. Results of analysis of tablets by the proposed methods. Found* (Percent label claim ±SD)
Tablets analysed**
Label claim, mg/tablet
Reference method
Titrimetry
Spectrophotometry
Pantodaca 20
20
98.84±0.66
97.64±0.76 t = 2.67 F = 1.33
98.12±1.58 t = 1.02 F = 5.73
Pantopb 40
40
103.6±0.46
102.7±0.84 t = 2.19 F = 3.33
104.5±0.85 t = 2.17 F = 3.41
Pantosacc 40
40
101.3±0.72
100.6±0.42 t = 1.94 F = 2.94
102.6±1.34 t = 1.99 F = 3.46
*Mean
value of five determinations. by : aZy. Alidac, Mumbai, India. bAristo Pharmaceuticals Ltd., Mumbai, India. c Cipla Ltd, Mumbai, India. The value of t (tabulated) at 95 % confidence level and for four degrees of freedom is 2.77. The value of F (tabulated) at 95 % confidence level and for four degrees of freedom is 6.39. **Marketed
Table 5. Accuracy assessment by recovery experiments. Titrimetry Tablets studied
Spectrophotometry
PPS in tablet, mg
Pure PPS added, mg
Total found, mg
Pure PPS recovered*, Percent±SD
PPS in tablet, µg mL-1
Pure PPS added, µg mL-1
Total found, µg mL-1
Pure PPS recovered*, Percent±SD
Pantodac 20
1.95 1.95 1.95
1.0 2.0 3.0
2.94 3.93 4.99
98.66±0.86 99.07±1.13 101.3±0.65
39.25 39.25 39.25
20.0 40.0 60.0
59.49 79.08 101.23
101.2±1.67 99.57±1.15 103.3±0.83
Pantop 40
2.05 2.05 2.05
1.0 2.0 3.0
3.11 4.12 5.10
106.2±1.26 103.7±0.84 101.6±0.53
41.8 41.8 41.8
20.0 40.0 60.0
61.72 81.72 102.64
99.61±1.46 104.3±0.74 101.4±0.66
*Mean value of three measurments.
times. The percent recovery of pure PPS added (Table. 5) was within the permissible limits indicating the absence of inactive ingredients in the assay.
Conclusion One titrimetric and one spectrophotometric methods were developed for the determination of pantoprazole using permanganate as the oxidimetric reagent and the methods were validated as per the current ICH guidelines. The developed methods have been demonstrated to be simple, rapid, economical and accurate and precise; and were successfully applied for the determination of PPS in tablets. In particular, the titrimetry is much simpler in technique, more rapid than all the methods reported so far for pantoprazole. It is applicable over a micro range (1-7 mg), requires inexpensive chemicals, yet provides very accurate and precise results. The proposed
spectrophotometric method has the advantages of wide linear dynamic range, moderate sensitivity and fair accuracy and precision. The method of Salama et al [9,10] is less sensitive, requires ethanolic medium and prone to interference by certain tablet excipients like alginate and stearate since they are likely to form complexes with the trivalent iron used as the reagent. The use of DDBQ as the chromogenic agent and organic solvent as the reaction medium makes the methods of Moustafa [11] expensive, besides less selective since any amino group moity might react with DDBQ. The reported methods [12, 14] though highly sensitive, lack selectivity in addition to requiring two reagent solutions of precisely known concentrations (bromate-bromide, and dyes). Compared to many existing instrumental methods for pantoprazole, the proposed spectrophotometric method has two additional advantages of simplicity of operations and the possibility of carrying them out with the common laboratory instrument. Since the method requires only one reagent (KMnO4) that too at very low concentration
Titrimetric and Spectrophotometric Assay of Pantoprazole in Pharmaceuticals Using Permanganate
(600 µg mL-1), it certainly is the most cost-effective of all the existing spectrophotometric methods.
Experimental Apparatus Absorbance measurements were made with a Systronics model 106 digital spectrophotometer equipped with 1 cm matched quartz cells.
Reagents and Standards Pantoprazole sodium (PPS) sesquihydrate was provided by Cipla India Ltd, Mumbai, India, as gift and was used as received. Tablets of PPS such as Pantodac 20 (Zy. Alidac, Mumbai, India), Pantop 40 (Aristo Pharmaceuticals Ltd., Mumbai, India) and Pantosac 40 (Cipla Ltd, Mumbai, India) were purchased from local market. All other chemicals used were of analytical reagent grade and solutions were made in distilled water. A stock standard solution (0.05 M) KMnO4 was prepared in water and standardized using pure arseneous oxide [29]. It was subsequently diluted to obtain working concentrations of 0.002 M and 600 µg mL-1 for use in titrimetry and spectrophotometry, respectively. A 0.01 M iron(II)ammonium sulphate (S.D. Fine Chem, Mumbai, India) was prepared in the usual manner. Sulphuric acid (2 M) was prepared by appropriate dilution of the concentrated sulphuric acid (S.D. Fine Chem, Mumbai, India, sp. gr. 1.18). The standard solution of PPS (1 mg mL-1) was prepared in water and used in titrimetric work; and diluted to 300 µg mL-1 PPS for spectrophotometric work. A stock solution of 200 µg mL-1 PPS was also prepared by appropriate dilution of the standard PPS solution (1 mg mL-1) for use in recovery study.
39
Amount (mg) = VMwS/n where V = ml of KMnO4 reacted Mw = relative molecular mass of drug S = strength of KMnO4, moles/L n = number of moles of KMnO4 reacting with per mole of PPS. Spectrophotometry Into a series of 10 mL calibrated flasks were added 0.0, 0.5, 1.0,1.5, 2.0, 2.5, 3.0, 3.5, 4.0, 4.5 and 5.0 mL of 300 µg mL-1 PPS solution from a micro burette, and the total volume was brought to 5 mL with water. To each flask was added, 2 mL of syrupy phosphoric acid followed by 1 mL of 600 µg mL-1 KMnO4 solution were added. The content was mixed well and flasks were kept aside for 15 min with occasional shaking. The volume was brought to the mark with phosphoric acid, mixed well and absorbance of each solution was measured at 545 nm against a water blank within next ten min. A standard graph was prepared by plotting the measured absorbance values vs concentration of PPS (Fig. 2). The concentration of the unknown was read from the standard graph or deduced from the regression equation derived using the Beer’s law data. Procedure for Tablets Twenty tablets were weighed accurately and ground into a fine powder. A portion of the powder equivalent to 100 mg of PPS was accurately weighed into a 100 mL volumetric flask, 60 mL of water was added and content shaken for 15 min; then, the volume was diluted to the mark with water, mixed well and filtered using a Whatman No. 42 filter paper. First 10 mL portion was discarded and 5 mL of the subsequent portion was assayed titrimetrically. The filtrate (1 mg mL-1) was diluted with water to get 300 µg mL-1 solution and a suitable aliquot (3.0 or 4.0 mL) was subjected to analysis following the procedure described earlier.
Procedure Titrimetry Different aliquots of pure drug solution containing 1.0-7.0 mg of PPS was measured accurately and transferred into a 100 mL titration flask. The solution was acidified by adding 6 mL of 2 M H2SO4 and the total volume was adjusted to 15 mL with water before adding 10 mL 0.002 M KMnO4 by means of a pipette. The content mixed, and kept aside for 10 minutes with occasional shaking. The unreacted permanganate was back titrated with 0.01 M iron(II)ammonium sulphate. A blank titration was performed, using distilled water in place of PPS. Using the sample titre volume and blank titre volume, the volume of KMnO4 reacted was arrived at. The amount of PPS in the aliquot was computed from the following formula:
Acknowledgement Authors thank M/S. Cipla India Ltd, for gifting pure pantoprazole. Four of the authors (N.R.P, K.T, U.R.A and S.G.H) gratefully thank the authorities of the University of Mysore, Mysore, for permission and facilities.
References 1. Budavari, S., Ed., The Merck Index, 12th Edition, New Jersey, 1996, 1205. 2. Mansour, A. M.; Sorour, O. M. Chromatographia Supplement 2001, 53, S478-S479. 3. Patel, B. H.; Suhagia, B. N.; Patel, M. M.; Patel, J. R. Chromatographia 2007, 65,743-748.
40 J. Mex. Chem. Soc. 2009, 53(1) 4. Xue-Hui, H.; Fu- Sheng, P. Zhongguo Yiyao Gongye Zazhi 2000, 31, 502-503. 5. Basavaiah, K.; Anilkumar, U. R.; Tharpa, K. Int. J. Chem. Sci. 2008, 6, 579-586. 6. Agbaba, D.; Novovic, D.; Karljikovic-Rajic, K.; Marinkovic, V. J. Planar Chromatogr. Modern TLC. 2004, 17, 169-172. 7. Karljikovic-Rajic, K.; Novovic, D.; Marinkovic, D.; Agbaba, D. J. Pharm. Biomed. Anal. 2003, 32, 1019-1027. 8. Wahbi, A. M.; Abdel-Razak, O.; Gazy, A. A.; Mahgoub, H.; Moneeb, M. S. J. Pharm. Biomed. Anal. 2002, 30, 1133-1142. 9. Salama, F.; El-Abasawy, N.; Razeq, S. A. A.; Ismail, M. F.; Fouad, M. M. Bull. Fac. Pharm. (Cairo Univ) 2003, 41, 185-196. 10. Salama, F.; El-Abasawy, N.; Razeq, S. A. A.; Ismail, M. F.; Fouad, M. M. J. Pharm. Biomed. Anal. 2003, 33, 411-421. 11. Moustafa, A. A. M. J. Pharm. Biomed. Anal. 2000, 22, 45-48. 12. Basavaiah, K.; Anilkumar, U. R. Indian J. Chem. Technol. 2007, 14, 611-615. 13. Basavaiah, K.; Anilkumar, U. R. Bulg. Chem. Commun. 2007, 39, 159-164. 14. Basavaiah, K.; Anilkumar, U. R. Bull. Chem. Soc. Ethiop. 2008, 22, 135-141. 15. International Conference On Hormonisation of Technical Requirements for Registration of Pharmaceuticals for Human Use, ICH Harmonised Tripartite Guideline, Validation of Analytical Procedures: Text and Methodology Q2(R 1), Complementary Guideline on Methodology dated 06 November 1996, incorporated in November 2005, London.
Kanakapura Basavaiah et al. 16. Ashworth, MRF. Titrimetric Organic Analysis. Part-I: Direct Methods, Interscience Publications, John-Wiley & Sons, New York, 1964, 368-374 17. Kolthoff, I. M.; Belchov, R. Volumetric Analysis. Vol. III, Interscience Publications. Inc., New York, 1957, 33-119. 18. Tammilehto, S. A. J. Pharm. Pharmacol. 1980, 32, 524. 19. Murugesan, A.; Venkappayya, D. Curr. Sci. 1983, 52, 249. 20. Kucharski, M.; Sikorska-Tomicka, H. Chem. Anal (Warsaw). 1982, 27, 491. 21. Fedchenko, S. B. Farmatsiya (Moscow). 1985, 34, 65. 22. Stepnayuk, S. N.; Balagorazumnya, N. V. Farmatsiya (Moscow). 1989, 38, 67. 23. Suganthi, A.; Shivakumar, H. B.; Vijaykumar, S. C.; Ravimathi, P.; Ravi, T. K. Indian J. Pharm. Sci. 2006, 68, 373. 24. Al-Tamrah, S. A. Anal. Chim. Acta 1999, 379, 75. 25. Abdellatef, H. E. J. Pharm. Biomed. Anal. 2002, 29, 835. 26. Reddy, M. N.; Reddy, V. P. N.; Reddy, P. J. C.; Murthy, T. K.; Srinivasa Rao, Y. The Antiseptic 2002, 99, 88. 27. Al-Ghanman, S. M.; Belal, F. Farmaco 2001, 56, 677-681. 28. Sastry, C. S. P.; Vijaya, R. T.; Satyanarayana, A. Indian. J. Pharma. Sci, 1998, 60, 55-58. 29. Vogel. A. I. Text-Book of Inorganic Analysis, Including Elementary Instrumental Analysis, Longsman, London, 1962, 280.