University of Warsaw Faculty of Physics
Tomasz Karda´s
Time-resolved studies of vibronic and vibrational transitions in complex media PhD thesis in Physics performed in Department of Chemistry, University of Warsaw
Supervisor dr hab. Bo˙zena Gadomska Laboratory of Physicochemistry of Dielectrics and Magnetics Department of Chemistry University of Warsaw
Warsaw, July 2014
Project operated within the Foundation for Polish Science MPD Programme MPD/2008/1 ”International Scholarship Program for Graduate Studies in the Faculty of Chemistry University of Warsaw” co-financed by the EU European Regional Development Fund. Financial support from the PhD grant number N N204 116539 is gratefully acknowledged.
Abstract The subject of the present dissertation concerns the vibronic and vibrational transitions, generated in complex media by interaction with the ultrashort light pulses. The phenomenon, which always accompanies this interaction is the Impulsive Stimulated Raman Scattering. Two experiments, visualizing this process in different media, have been designed and performed. Herewith their results along with the interpretation are presented. The first experiment depends on the supercontiuum generation in diamond crystal. The sample is subjected to highly intense off-resonant light pulses. It is known that the self-phase modulation, self-steepening and interaction with photoionized free carriers are processes, which play the main role in the supercontinuum generation. In the present thesis the influence of the intrapulse stimulated Raman scattering on the evolution of the pulse in time and space is investigated. It has been found that the crystal lattice vibrations only weekly affect the pulse spectrum, yet the change is observed and discussed in dependence of the pulse fluence. It manifests itself mainly by a peak lying apart from the central pulse frequency at a distance equal to the vibrational frequency of the diamond crystal. The interpretation of the experimental results is supported by numerical simulation. For this purpose the three dimensional nonlinear envelope equation is solved with the split-step Fourier method. The model includes the effects of refractive index dispersion, diffraction, self-phase modulation and its saturation, self-steepening, photoionization, interaction with free-carriers and stimulated Raman scattering. The results of modeling agree well with the experimental observations. The second experiment concerns the Time-Resolved Femtosecond Stimulated Raman Scattering studies of the trans-β-apo-8’-carotenal molecule. The experimental setup has been constructed for this purpose. The time resolution of the setup is better than 100 fs and the frequency resolution is about 25 cm−1 . The trans-β-apo-8’-carotenal molecule was excited electronically to the S2 state and its relaxation, through S1 state to the ground state was observed by measuring the FSRS spectra of the C=C symmetrical stretching vibration. The Raman line corresponding to S2 state decays within 120 fs after excitation, then a long living line at the frequency corresponding to the optically forbidden S1 state appears. During the first 500 fs this line is negative, which is attributed to the transient vibrational inversion of population in S1 electronic level. Later the line becomes positive and then it decays with the lifetime of S1 level. At the same time the frequency of the 3
line up-shifts. The theoretical model, describing the dynamics of the molecular system, has been created in quantum mechanical approach based on the formalism of projection operators. The results of the experiment are analyzed by comparison with the time resolved signal obtained from theoretical calculations. It is shown that the predictions of the numerical model agree well with the experimental results. The main conclusion of the present thesis is, that no additional electronic level (apart of S0 , S1 and S2 ) is required for explanation of the experimentally observed decay of the excited S2 state, instead the existence of a set of vibrational sublevels of the S1 state has been proposed to take part in its energy redistribution.
4
Streszczenie W niniejszej dysertacji zostaly przedstawione wyniki bada´ n nad przej´sciami miedzy stanami wibracyjnymi i wibracyjno-elektronowymi ֒ (wibronowymi) w materii skondensowanej, wywolanymi oddzialywaniem z ultrakr´otkimi impulsami ´swiatla. Procesem nierozerwalnie towarzyszacym tym ֒ oddzialywaniom jest Impulsowe Wymuszone Rozpraszanie Ramana. W celu zilustrowania r´oz˙ nych aspekt´ow tego procesu zaprojektowano i przeprowadzono dwa eksperymenty oraz zaprezentowano dyskusje֒ ich wynik´ow. Pierwszy eksperyment dotyczy generacji superkontinuum w krysztale diamentu, na kt´ory pada ciag impuls´ow laserowych o du˙zej energii. Wiadomo, z˙ e ֒ gl´ownymi procesami odpowiedzialnymi za to zjawisko w krysztalach sa֒ samomodulacja fazy, samostromienie impulsu oraz oddzialywanie z ladunkami powstalymi w wyniku fotojonizacji. Celem pierwszego eksperymentu jest zbadanie wplywu Impulsowego Wymuszonego Rozpraszania Ramana na ewolucje֒ impulsu w czasie i przestrzeni w trakcie propagacji w silnie nieliniowym krysztale. Zaobserwowano, z˙ e wplyw drga´ n sieci krystalicznej na widmo impulsu jest niewielki, niemniej wystepuje i silnie zale˙zy od energii ֒ impulsu. W widmie impulsu pojawia sie֒ pik odlegly od centralnej czesto´ sci ֒ impulsu o czesto´ s ´ c r´ o wn a cz esto´ s ci drga´ n w lasnych diamentu. Interpretacja ֒ ֒ ֒ wynik´ow eksperymentalnych jest wsparta wynikami symulacji numerycznej. Rozwiazano tr´ojwymiarowe “nieliniowe r´ownanie obwiedni” przy pomocy ֒ Fourierowskiej metody malych krok´ow. Model uwzglednia efekty dysper֒ sji wsp´olczynnika zalamania, dyfrakcje, ֒ samomodulacje֒ oraz jej nasycenie, samostromienie impulsu, fotojonizacje, snikami oraz ֒ interakcje֒ z wolnymi no´ wymuszone rozpraszanie Ramana. Wyniki modelowania zgadzaja֒ sie֒ dobrze z wynikami pomiar´ow. Drugi eksperyment dotyczyl badania przej´s´c wibronowych w czasteczce ֒ trans-β-apo-8’-karotenu przy pomocy czasowo-rozdzielczego, femtosekundowego, wymuszonego rozpraszania Ramana (CR-FWRR). Do tego celu zbudowano uklad pomiarowy o rozdzielczo´sci czasowej 100 fs i rozdzielczo´sci spektralnej okolo 25 cm−1 . Czasteczka trans-β-apo-8’-karotenu byla ֒ wzbudzana do elektronowego stanu S2 a jej relaksacje֒ poprzez stan S1 do stanu podstawowego obserwowano rejestrujac ֒ widma FWRR symetrycznych, rozciagaj acych drga´ n wiazania C=C. Linia ramanowska odpowiadajaca dr֒ ֒ ֒ ֒ ganiom czasteczki, b ed acej we wzbudzonym stanie elektronowym S , zanika 2 ֒ ֒ ֒ w czasie 120 fs po wzbudzeniu, nastepnie pojawia si e linia d lugo z˙ yjacego ֒ ֒ ֒ stanu S1 . Zaobserwowano, z˙ e podczas pierwszych 500 fs linia ta jest 5
ujemna, co zinterpretowano jako przejaw przej´sciowej inwersji obsadze´ n stan´ow wibracyjnych w elektronowym stanie S1 . Nastepnie linia staje sie֒ ֒ dodatnia i dalej zanika w czasie r´ownym czasowi z˙ ycia poziomu S1 . Jednocze´snie czesto´ s´c linii wzrasta. Aby opisa´c dynamike֒ tego procesu stwor֒ zono model teoretyczny, przy czym czasteczk e֒ opisano w obrazie kwantowym ֒ za pomoca֒ r´owna´ n Heisenberga-Langevina, u˙zywajac ow ֒ formalizmu operator´ rzutowych. Wyniki do´swiadczenia przeanalizowano poprzez por´ownanie z wynikami oblicze´ n teoretycznych. Pokazano, z˙ e przewidywania modeli numerycznych sa֒ w zgodno´sci z wynikami pomiar´ow. Wykazano, z˙ e do wyja´snienia wynik´ow do´swiadczalnych nie bylo potrzebne wprowadzenie dodatkowych poziom´ow elektronowych (innych ni˙z S0 , S1 i S2 ). Udowodniono, z˙ e istnienie podpoziom´ow wibracyjnych stanu elektronowego S1 jest konieczne do wyja´snienia redystrybucji energii ze wzbudzonego stanu S2 .
6
Contents 1 Introduction 1.1 Motivation . . . . . . . . . . . . . . . . . . . . . . . . . . . . . 1.2 Thesis outline . . . . . . . . . . . . . . . . . . . . . . . . . . . 1.3 Classical theory of coupling of light with molecular vibrations 1.3.1 The force due to the electric field . . . . . . . . . . . . 1.3.2 Equation of pulse driven motion . . . . . . . . . . . . . 1.3.3 Polarization . . . . . . . . . . . . . . . . . . . . . . . . 1.3.4 Examples . . . . . . . . . . . . . . . . . . . . . . . . . 2 Stimulated Raman Scattering in supercontinuum generation in diamond 2.1 Experimental arrangement . . . . . . . . . . . . . . . . . . . . 2.2 Experimental Results . . . . . . . . . . . . . . . . . . . . . . . 2.3 Model . . . . . . . . . . . . . . . . . . . . . . . . . . . . . . . 2.3.1 Master equation . . . . . . . . . . . . . . . . . . . . . . 2.3.2 Dispersion . . . . . . . . . . . . . . . . . . . . . . . . . 2.3.3 Nonlinear Polarization . . . . . . . . . . . . . . . . . . 2.3.4 Free current contribution . . . . . . . . . . . . . . . . . 2.3.5 Plasma density . . . . . . . . . . . . . . . . . . . . . . 2.3.6 The input pulse . . . . . . . . . . . . . . . . . . . . . . 2.4 Simulation details . . . . . . . . . . . . . . . . . . . . . . . . . 2.4.1 Discretization . . . . . . . . . . . . . . . . . . . . . . . ˆ – pseudospectral 2.4.2 Evaluation of the linear operator L method . . . . . . . . . . . . . . . . . . . . . . . . . . 2.4.3 Method accuracy, error estimation and the marching scheme . . . . . . . . . . . . . . . . . . . . . . . . . . . 2.4.4 The ordinary differential equation of plasma density . . 2.4.5 Implementation . . . . . . . . . . . . . . . . . . . . . . 7
12 12 15 19 20 22 24 26 34 37 39 42 44 50 51 53 59 59 61 63 63 66 70 72
2.5
2.6
2.4.6 Model testing . . . . . . . . . . . . . . . . . . Modeling results . . . . . . . . . . . . . . . . . . . . . 2.5.1 Correspondence with experiment results . . . 2.5.2 The pulse evolution during the propagation – tance of self-focusing saturation . . . . . . . . 2.5.3 Chirp and the intensity dependent fringes . . Conclusion . . . . . . . . . . . . . . . . . . . . . . . .
. . . . . . . . . . . . impor. . . . . . . . . . . .
. 72 . 77 . 77 . 79 . 82 . 85
3 Intramolecular vibrational relaxation and transient vibrational inversion of population in trans-β-apo-8′ -carotenal 86 3.1 Time-Resolved Femtosecond Stimulated Raman Scattering technique . . . . . . . . . . . . . . . . . . . . . . . . . . . . . 90 3.2 Setup . . . . . . . . . . . . . . . . . . . . . . . . . . . . . . . . 95 3.2.1 Probe and reference beams . . . . . . . . . . . . . . . . 96 3.2.2 Actinic pump . . . . . . . . . . . . . . . . . . . . . . . 99 3.2.3 Raman pump . . . . . . . . . . . . . . . . . . . . . . . 104 3.2.4 Detection and data acquisition . . . . . . . . . . . . . . 105 3.3 Data analysis . . . . . . . . . . . . . . . . . . . . . . . . . . . 109 3.3.1 Setup calibration . . . . . . . . . . . . . . . . . . . . . 112 3.4 Trans-β-apo-8′ -carotenal molecule . . . . . . . . . . . . . . . . 113 3.4.1 Experimental results . . . . . . . . . . . . . . . . . . . 119 3.5 Quantum mechanical theory of coupling of light with molecular vibrations . . . . . . . . . . . . . . . . . . . . . . . . . . . 129 3.5.1 The unperturbed molecule Hamiltonian and perturbed Hamiltonian of the system . . . . . . . . . . . . . . . . 131 3.5.2 Time dependent operators in the Heisenberg picture . . 133 3.5.3 Heisenberg-Langevin equations of the two-level system 135 3.5.4 Influence on the electric field . . . . . . . . . . . . . . . 138 3.5.5 Discussion of the two-level system’s model . . . . . . . 139 3.5.6 Discussion of the three-level system’s model . . . . . . 140 3.6 Model for trans-β-apo-8′ -carotenal molecule . . . . . . . . . . 149 3.7 Numerical aspects of model fitting . . . . . . . . . . . . . . . . 155 3.8 Modeling results and discussion . . . . . . . . . . . . . . . . . 156 3.9 Conclusion . . . . . . . . . . . . . . . . . . . . . . . . . . . . . 161 4 Conclusions
163
Appendices
167 8
A Parallel Implicit Ordinary Differential Equations Solver B Derivation of equations for a two vibrational level B.1 Creation and annihilation operators for fermions . . B.2 Heisenberg-Langevin equations . . . . . . . . . . . B.3 Polarization . . . . . . . . . . . . . . . . . . . . . . B.4 Wave equation . . . . . . . . . . . . . . . . . . . . . Bibliography
system . . . . . . . . . . . . . . . . . . . .
168 175 . 175 . 176 . 188 . 189 192
9
Acknowledgments I direct many thanks to the Foundation for Polish Science and prof. Renata Bilewicz, the supervisor of the MPD Programme, for the great opportunity of conducting this interesting studies. I would like to express my sincere appreciation to all those who have assisted me during preparing and writing this thesis. First, I would like to thank my supervisor, dr hab. Bo˙zena Gadomska, who was supportive, trusted in my abilities and has given me the freedom to pursue various projects. Her enthusiastic support, in particular suggesting the line of work and fruitful discussions were very helpful during my studies. Especially the theoretical part of this work could not have been created without the help of my supervisor. The experiments discussed in this thesis were performed in Italy, however during my studies I constructed a time-resolved reflection/transmission setup, and I studied the dynamics of the extended cavity Ti:sapphire oscillator. During those experiments the help of the head of the laboratory Prof. Wojciech Gadomski was essential. I would like to thank him for his constructive suggestions and for the sense of humor which could lighten the atmosphere in moments of experimental crises. I want to extend my gratitude to prof. Roberto Righini, the head of the laboratory and my supervisor at LENS in Florence, who enabled me to realize experimental part of the thesis. He was always ready to help with solving the experimental and theoretical problems. The contribution of my Italian Laboratory colleague doctor Andrea Lapini cannot be underestimated. He was very helpful at the stage of development of the TR-FSRS setup and with interpretation of the first experimental 10
results. Andrea was always ready to help on the scientific and engineering field and also, with sometimes very prosaic, administrative problems. I also extend my acknowledge to other members of LENS group: Elena Ragnoni, who has taken over the TR-FSRS setup after the end of my apprenticeship and who has confirmed my experimental results, professor Paolo Foggi and doctor Mariangela Di Donato for their valuable comments on the interpretation of the results of the TR-FSRS data of analyzed molecule. I could always count on support of Kamil Polok and Piotr Piatkowski, my ֒ laboratory mates in the Chemistry department. I will always remember the great atmosphere created by them within this group. I also thank Jadwiga Konarska who took over my freshly created time-resolved reflection/transmission setup. The detector for the TR-FSRS setup in Florence was constructed by Prof. Marco Prevederli. The chopper system for the TR-FSRS setup benefited from the work of the electronic (Marco De Pas and Alessio Montori) and mechanical (Riccardo Ballerini) workshop at LENS. I also thank Paulina Matuszewska and Anna Lapi´ nska for MPD Programme administration on the University side, there was never a problem which could not be easily solved.
11
Chapter 1 Introduction 1.1
Motivation
Molecules and atoms in crystal latices oscillate and their particular characteristic vibrations depend on the structure of crystals or molecules. Light of ultrashort, spectrally broad pulses propagating in such media can be coupled with molecular and crystal lattice vibrations. In presence of light with two frequency components, if the frequency difference of these two components is equal to the vibrational frequency of the medium, the energy can flow from one of the frequency components to another, with simultaneous excitation of the appropriate vibration. This is the Stimulated Raman Scattering (SRS), observed [1] and described theoretically [2] for the first time more than 50 years ago. In the case when short pulses with broad spectra are used, many pairs of such components exist in the pulse spectrum and thus the whole spectrum of the pulse evolves during propagation in the medium. This phenomenon is the Impulsive Stimulated Raman Scattering 12
(ISRS). ISRS has been demonstrated [3] and described theoretically [4] in 1985. There is no laser intensity threshold for ISRS [4], thus, modification of spectrum of broadband pulses, due to ISRS, is inevitable. Therefore, it has to be considered along with other processes occurring in complex media whenever short pulses are used. The motivation of the present dissertation is to study the role of ISRS process in the interaction of ultrashort light pulses with complex media. Two experiments along with interpretation of their results will be presented. In the first experiment the simple crystal of high third order nonlinearity, subjected to highly intense off-resonant light pulses, is considered in order to estimate the influence of ISRS on the evolution of the pulse shape propagating in the medium. The second experiment concerns the resonant interaction of two ultrashort pulses, with frequency difference close to the vibrational frequency of the medium, with a complex molecular liquid. In this case the ISRS process becomes the tool for time-resolved technique to get the information on vibrational population dynamics in molecules. Evolution of the pulse in time and space and the way, in which the medium shapes the pulse spectrum through ISRS, is the subject of the first experiment. It is the generation of supercontinuum by focusing of intense utrashort pulses in a bulk diamond crystal. The interaction of light with the medium vibrations is only one of many phenomena involved in this extreme process and it is certainly not a dominating one. During the supercontinuum generation the strong and short laser pulse is shaped by nonlinear effects due to almost instantaneous electronic response of the medium. This leads to a class of effects known as self-phase modulation and its spatial manifestation – self-focusing; self-steepening and saturation of self-phase modulation. As 13
the intensity of the self-focused beam becomes high, the photoionization of the medium occurs. Some part of the light is absorbed and the rest interacts with newly created free currents. As the effect the spectrum of the pulse becomes extremely broad. A pulse with a broad spectrum can enhance crystal vibrations efficiently by means of ISRS and in return the vibrations can influence the shape of the pulse. In studies of such a complex phenomenon it is difficult to say what is the contribution of the particular process. Moreover, a few processes can cause similar effects and thus it is difficult to distinguish which one is more important. Thus a question arises: do the crystal vibrations influence the supercontinuum generation process significantly? It might seem that this influence is small and, in fact, the ISRS is often neglected in simulations of the supercontinuum generation. The study presented here is aimed to check the validity of this assumption. Therefore, a supercontinuum generation in a special medium: diamond, with its extreme Raman gain is performed. It is shown that the vibrations influence the generation process weakly, yet, in the case of diamond this influence, can be observed. The second experiment discussed in the present dissertation applies pump-probe technique, a typical time-resolved spectroscopy scheme, to study the vibrational spectra after vibronic excitation of complex molecules of trans-β-apo-8′ -carotenal. The technique is the Time-Resolved Femtosecond Stimulated Raman Scattering (TR-FSRS). The lifetimes and vibrational frequencies corresponding to particular electronic levels can be obtained with this technique with a great time and frequency resolution. Moreover, the information on paths of excitation energy redistribution within the system 14
can be gained. A TR-FSRS setup was constructed for the purpose of this thesis. Trans-β-apo-8′ -carotenal is one of carotenoids, a family of molecules which take important part in photosynthesis process. Carotenoids are quite complex, during last 40 years the presence of two so called “dark states”, optical excitation of which is strongly forbidden, were discovered in between the ground and the first optically allowed state. One of them is known to take part in the relaxation process of the molecule, the role of the other is not obvious for trans-β-apo-8′ -carotenal. At least one additional, yet not confirmed, “dark state”, together with a triplet state awaits in a line to complicate the picture. Thus, TR-FSRS seems to be a perfect tool for solving carotenoid mysteries and it’s application for this purpose is described here. Moreover, to explain the experimental results obtained for trans-β-apo-8′ carotenal with the TR-FSRS setup, a quantum mechanical model was constructed and solved numerically. The involvement of only one of the “dark” electronic states with a set of its vibrational sublevels is proved here to be sufficient for explanation of the energy transfer in the molecule. An interesting phenomenon of transient vibrational inversion of population, which is believed to be present during the excited molecule relaxation, is also discussed.
1.2
Thesis outline
The dissertation is organized as follows. In the present introductory chapter a basic classical theory of Impulsive Stimulated Raman Scattering is pre15
sented in the section “Classical theory of coupling of light with molecular vibrations”. First the problem of interaction of a single molecule with the electric field of light pulse is formulated in terms of a harmonic oscillator picture. The general solution for arbitrary light intensity time profile is expressed by use of Green’s function. Next the formula for nonlinear polarization due to light interaction with vibrating medium is presented. Finally some simple examples of ISRS are discussed. The Stimulated Raman Scattering in supercontinuum generation in diamond is described in chapter 2. In the introductory part the history of studies on supercontinuum generation in different media is briefly described and the motivation for the current study is argued. Next, the simple experimental arrangement for supercontinuum generation studies is described. Experimental results for a range of input pulse energies are presented, together with a peak emerging at a frequency shifted from the main spectral feature of the supercontinuum by the vibrational frequency of diamond. Next, a model of supercontinuum generation is described. First a brief review of master equations used in models of propagation of short laser pulses is presented. Next the derivation of Nonlinear Envelope Equation used herewith as a master equation and the assumptions validating it are described. The terms corresponding to different effects: material refractive index dispersion, self-phase modulation and it’s saturation, ISRS and interaction with the free current are described. Next the symmetrical split step Fourier method with adaptive step size controle used for solution of the master equation is explained. The details on discretization of the pulse envelope, evaluation of linear and nonlinear parts of the master equation and error estimation are described to16
gether with the way, in which the equation of free current density is solved, the implementation details and model testing. Finally the results of modeling of supercontinuum generation in diamond crystal are presented. The good correspondence with experiment results is emphasized. The Raman feature is reproduced in the model. Next the pulse evolution during the propagation, the value of self-focusing saturation and the presence of chirp and intensity dependent fringes in supercontinuum spectrum are discussed. The chapter ends with “Conclusions” section. Intramolecular vibrational relaxation and transient vibrational inversion of population in trans-β-apo-8’-carotenal is the subject of the third chapter. The history of studies and current state of knowledge on carotenoid molecules is briefly discussed in the introductory part of the chapter. It is followed by the description of the Time-Resolved Femtosecond Stimulated Raman Scattering technique, used in present thesis. Next the TR-FSRS setup constructed by the author in European Laboratory for Nonlinear Spectroscopy is described. The probe and reference, actinic and Raman pump pulse paths through the setup are presented together with the method of detection and data acquisition, the problem of data analysis is analyzed. Next more details on the structure of particular carotenoid: trans-β-apo-8’-carotenal are presented. The results of the TR-FSRS experiment in trans-β-apo-8’-carotenal are discussed next. Following the excitation of the sample a Raman line corresponding to the C=C symmetrical stretching vibration of the molecule is observed. Due to vibronic coupling of the electronic states, the frequency of this vibration differs significantly in ground and excited states. Therefore 17
it is easy to observe the dynamics of three states which, as it is postulated, take part in the transition. Most interesting is the behavior of the line corresponding to S1 state of the molecule. The frequency of this line changes suggesting vibrational cooling but at the same time it appears that the line is first negative (Raman losses) within first 500 fs. This second fact suggests that transient vibrational inversion of population is present in the molecule. In order to describe the above phenomenon a model of the molecule in a quantum mechanical approach was created. To explain it the quantum mechanical theory of coupling of light with molecular vibrations is discussed in the next section. First a simple 2 vibrational level system is described. The unperturbed molecular Hamiltonian and the perturbed Hamiltonian of the system are presented. Later, the time dependent operators in the Heisenberg picture, Heisenberg-Langevin equations of the two-level system are introduced. Many basic calculations supporting those sections are presented in the appendix. Discussion of the two-level model and the three-level model created by analogy to the first one is presented next. Finally the model of trans-β-apo-8’-carotenal molecule is constructed and some numerical aspects of model fitting are discussed. The results of modeling, confirming the possibility of involvement of only two electronically excited states and of presence of transient vibrational inversion of population are then discussed. The chapter ends with the “Conclusions” section. In the last chapter the conclusions of the thesis are presented.
18
1.3
Classical theory of coupling of light with molecular vibrations
In this section a classical theory of coupling of molecular and crystal vibrations with light pulses is revised. The goal is to model a propagation of the light pulse in the medium disturbed by the very same pulse. The shape of the pulse has to be assumed arbitrary as it will change in a priori unknown way during the propagation. In the next chapter the partial differential equation for propagation of the electric field pulse will be presented. This equation will have to be solved numerically. Fortunately some analytical simplifications can be done to avoid numerical solution of the matter equation,what will be presented in the present section. Within the BornOppenheimer approximation [5, 6] the electronic and nuclear motion of a molecule or a crystal lattice can be separated. The normal coordinates and corresponding normal vibrations can than be introduced. In such a case the classical harmonic oscillator model can be used for description of the dynamics of these normal modes. In particular case of diamond it is easy to describe the medium by a harmonic oscillator model with a single resonant frequency. The harmonic oscillator model can be solved analytically with the Green’s function approach and the convolution of such a Green’s function (or Raman response function) with the pulse intensity can be included in the equation for the electric field. This way no differential equation for the medium has to be solved numerically and all the information about it is kept in the Raman response function. The solution of the matter equation of motion will be also discussed in this section for a number of example pulses. 19
In this section, first, the induction of the electric dipole in a molecule by electric field and the force due to the electric field acting on this dipole is discussed. The useful expression for this force for the envelope of the electric field is derived. Second, the equation of motion of matter in the form of the forced and damped harmonic oscillator is introduced and its general solution for arbitrary force with use of Green’s function is presented. The dependence of the normal mode vibrational amplitude on the spectrum of the light pulse is also discussed. Finally the results of the two first subsections are combined to formulate the expression for the nonlinear medium polarization resulting from stimulated Raman scattering. The section is concluded with several examples of pulse induced vibrations.
1.3.1
The force due to the electric field
~ is the induced dipole moment, where E ~ is the electric field If p~i = α ˆE and α ˆ is the medium polarizability tensor, then the potential energy of the ~E ~ 1 [7]. Here the dynamics of molecules and crystals ˆE molecule is EP = − 12 α is described in terms of normal mode amplitudes q(t). Therefore, the driving force for a given normal mode can be obtained from the potential energy by taking its gradient [8]: 1 F~ = 2
�
∂α ˆ ∂q
�
~ E. ~ E
(1.1)
q=0
Here the assumption is made that the light wavelength is much longer than the normal mode amplitude and thus its gradient can be neglected [9]. If an electric field has nonzero component along only one axis of the coordinate 1
The permanent dipole moment and resulting infrared absorption phenomenon will be disused later in this section.
20
system at which the polarizability tensor is diagonal, the Eq. 1.1. takes the following form [10]: 1 F (t) = 2
�
∂α ∂q
�
E 2 (t).
(1.2)
q=0
It is convenient to introduce the slowly varying amplitude of the pulse. In such a case the electric field is presented as a product of the term oscillating with pulse central (optical) frequency eiωt and the slowly varying amplitude of the pulse A(t): 1 E(t) = (A(t)eiωt + A∗ (t)e−iωt ), 2
(1.3)
1 E(t) = |A(t)|(ei(ωt+ϕ(t)) + e−i(ωt+ϕ(t)) ), 2
(1.4)
or
where ϕ(t) is the slowly varying phase of the pulse.
If the relation 1.4. is used the Eq. 1.2. becomes: 1 F (t) = 4
�
∂α ∂q
�
|A(t)|2 (1 + cos(2ωt + 2ϕ(t))).
(1.5)
0
The molecular vibrations (1012 – 1014 Hz) can be forced at frequencies being the difference of those contained within the ultrashort pulse spectrum rather than directly by the light pulses carrier frequency (1014 – 1015 Hz). Thus, as the vibrational transitions are considered, the cos(2ωt + 2ϕ(t)) can be omitted [4, 8] in Eq. 1.5. giving: 1 F (t) = 4
�
∂α ∂q
21
�
|A(t)|2 . 0
(1.6)
As can be seen from Eq. 1.6. in presence of the ultrashort pulse the force that excites the vibrations, is proportional to the pulse intensity.
1.3.2
Equation of pulse driven motion
In the classical approach, in harmonic approximation, the equation of motion for a chosen normal vibrational mode in a molecule or a crystal takes the following form: q¨ + 2γ q˙ + Ω2 q = F (t),
(1.7)
where q(t) is the normal mode amplitude, F~ (t) is the driving force (Eq. 1.1.), γ is the vibrational damping coefficient and Ω is the angular frequency of the mode. To solve this equation efficiently for forces described by Eq. 1.6. the approach of Green’s function is preferable [11, 12]. The retarded Green’s function for the harmonic oscillator is [13]: G(t) = where ω ¯ =
1 −γt e sin ω ¯ t Θ(t), ω ¯
(1.8)
p Ω2 − γ 2 is the resonance frequency of damped oscillator and
Θ(t) is the Heviside function. This retarded function is used in situations when there were no vibrations before appearance of the force. Now Eq. 1.7. can be solved by convolution of the Green’s function with the force: q(t) =
Z
∞
G (t − t′ ) F (t′ )dt′ = G ∗ F
−∞
22
(1.9)
(here G ∗ F is the convolution of G and F ) or for the force defined by Eq. 1.6: q(t) =
Z
∞
1 G (t − t ) 4 −∞ ′
�
∂α ∂q
�
2
|A (t′ )| dt′ .
(1.10)
It is interesting to examine the frequency dependence of the vibrational amplitude q(t) by performing its Fourier transform: 1 FT {q(t)} = 4
�
∂α ∂q
�
� FT G ∗ |A|2
(1.11)
where FT stands for Fourier transform. The equation 1.11. is solved with use of the convolution theorem: FT {G ∗ F } = FT {G} FT {F } ,
(1.12)
therefore: 1 FT {q(t)} = 4
�
∂α ∂q
�
� FT {G} FT |A|2 .
(1.13)
The Fourier transform of the Green’s function is: 1 FT {G} = ω ¯
�
1 1 − i(ω + ω ¯ ) − γ i(ω − ω ¯) − γ
�
,
(1.14)
and a convolution theorem can be used for calculation of FT {|A|2 }: n oo n o n � ˆ = Aˆ∗ ∗ A, FT |A|2 = FT {A∗ A} = FT FT−1 Aˆ∗ FT−1 Aˆ 23
(1.15)
where Aˆ and Aˆ∗ are Fourier transforms of A and A∗ , respectively. Finally, the Fourier transform of q(t) is: 1 qˆ(ω) = 2
�
∂α ∂q
�
1 ω ¯
Z
∞ −∞
�
A∗ (ω ′ )A(ω − ω ′ ) A∗ (ω ′ )A(ω − ω ′ ) − i(ω + ω ¯) − γ i(ω − ω ¯) − γ
�
dω ′ . (1.16)
Obviously the denominators in the above equation are the smallest in the case of resonance: ω = ±¯ ω . Anyway the value of the convolution: Z
∞
A∗ (ω ′ )A(¯ ω − ω ′ )dω ′ .
(1.17)
−∞
also has to be significant if the vibrational amplitude is supposed to be high. This happens when a pair or pairs of spectral components with spectral separation close to ω ¯ are present in the spectrum of the pulse envelope [4].
1.3.3
Polarization
The electric dipoles, induced in the material, become a source of a new wave. Therefore to study the deformation of the laser pulse further investigation of the medium polarization is required. The total dipole moment of a molecule or a crystal unit cell contains both: the induced dipole moment ~ and the permanent dipole moment ~µ [7, 9]: p~i = α ˆE ~ p~ = ~µ + α ˆ E, 24
(1.18)
or in present simplified consideration when all vectors have the same direction parallel to an axis of the coordinate system in which α ˆ is diagonal: p = µ + αE,
(1.19)
In the case when the frequency of electric field is far from the electronic resonance [8], both µ and α can be expanded into Taylor series with respect to small vibrational amplitudes [10, 14]: µ = µ (0) +
α = α (0) +
�
∂µ ∂q
�
�
∂α ∂q
�
q + ...,
(1.20)
q + ...,
(1.21)
0
0
where for simplicity only one vibrational mode q is considered. If the third and higher order terms of the Taylor series in equations 1.20. 1.21. are neglected the equation 1.19. takes the following form [8]: p = µ(0) +
�
∂µ ∂q
�
q(t) + α(0)E(t) + 0
�
∂α ∂q
�
q(t)E(t),
(1.22)
0
the second and third terms in the above equation are the “infrared absorption” (absorption of light of frequency close to that of the vibrations) and the Rayleigh scattering (where no change of frequency of incoming light is present), respectively. The last term in equation 1.22. is responsible for the Raman scattering. In the case of interaction with ultrashort pulse q(t), given in the form defined by Eq. 1.10, has to be substituted to Eq. 1.22. Together with the 25
slowly varying amplitude, the Raman part of the dipole moment becomes: 1 pR = 4
�
∂α ∂q
�2
A(t)e
iωt
∗
+ A (t)e
−iωt
0
�
Z
∞
2
G (t − t′ ) |A (t′ )| dt′ .
(1.23)
−∞
And thus the nonlinear polarization of light in this case is: 1 PR = N 4
�
∂α ∂q
�2
A(t)e
iωt
∗
+ A (t)e
−iωt
0
�
Z
∞
2
G (t − t′ ) |A (t′ )| dt′ , (1.24)
−∞
where N is the density of molecules (or unit cells in a crystal).
1.3.4
Examples
Several simple examples on the subject of vibrations of crystal driven by light pulse will be presented in this section. In the later simulation, a Green’s function will be used for description of the vibrational amplitudes behavior, however, it is instructive to leave a normal mode amplitude as a variable for a moment. In the section 2.3.1. the pulse propagation equation (Eq. 2.3.) will be introduced in details. Here a simplified equation is presented: ∂A = iC1 p+ + . . . , ∂z
(1.25)
for propagation of the envelope A(z, t) in the unrealistic medium, where the nonlinear polarization is just due to stimulated Raman scattering (from Eq. 1.23.), wheras: p+ = C2 q(t)A(z, t), 26
(1.26)
a)
-200
0 Time [fs]
200
Intensity [a. u.] Change of pulse spectrum [a. u.]
Ion position [a. u.] 0 -400
b)
1
0.5
-4
0 400
40 THz 1
0.5
0 0.5
Spectral intensity [a. u.]
x 10
-0.5
-50
0 Frequency [THz]
0 50
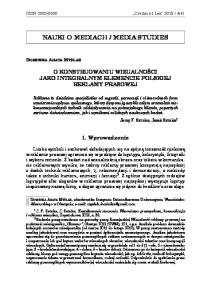
Figure 1.1: The time profile of the normalized pulse intensity (red dashed curve), and the normalized vibrational amplitude (black curve) (a) and the spectral intensity of the pulse (red dashed curve) and the relative change of the spectrum due to propagation in the Raman medium (black curve) (b) for the case of 200 fs long pulse.
and C1 and C2 are constants. The equation of motion 1.7. with the light intensity dependent force given by Eq. 1.6. is used to obtain q(t), which is required in Eq. 1.26. After solution of Eq. 1.25. the relative change of the pulse spectrum: |FT {A(z + ∆z, t)}|2 − |FT {A(z, t)}|2 |FT {A(z, t)}|2
(1.27)
where A(z + ∆z, t) is the solution of Eq. 1.25. and FT stands for Fourier transform can be calculated. A few examples for different pulse amplitudes A(z, t) are given below, in all of them the diamond with its frequency 1332 cm−1 and decay time 5.7 ps is used as a medium and Fourier limited Gaussian pulses are used. 27
x 10
-21
40 THz
1
4
0.5 2
0 -50
0 Frequency [THz]
Spectral intensity [a. u.]
Change of pulse spectrum [a. u.]
40 THz
0 50
Figure 1.2: Enlarged Fig. 1.1. The relative change of the spectrum due to propagation in the Raman medium for the case of 200 fs long pulse.
The first example is calculated for a 200 fs pulse. The time profile of a pulse intensity together with the time dependance of the normal mode amplitude are presented in Fig. 1.1. (a). As the pulse is long the material system has enough time to follow the envelope of the light intensity and no significant vibrations are induced. The spectrum of the pulse together with it’s relative change (Eq. 1.27.) are presented in Fig. 1.1. (b). The spectrum of the pulse is narrow and fits in between the two vertical lines separated by vibrational frequency of diamond. It broadens slightly but, as discussed in section 1.3.2, the vibrations can’t be forced efficiently [15]. The pairs of spectral components with spectral separation close to resonant frequency are very weak in the spectrum of A. Still, small peaks separated by 40 THz from the central frequency appear in the spectrum which is visible in Fig. 1.2. 28
0.5
-1
0 0
200
400 600 Time [fs]
800
1000
1
0.8
0.6 0 0.4
Spectral intensity [a. u.]
0
40 THz
b) 0.1
1
Intensity [a. u.] Change of pulse spectrum [a. u.]
Ion position [a. u.]
a) 1
0.2 -0.1 -50
0 Frequency [THz]
50
0
Figure 1.3: The time profile of the normalized pulse intensity (red dashed curve), and the normalized vibrational amplitude (black curve) (a) and the spectral intensity of the pulse (red dashed curve) and the relative change of the spectrum due to propagation in the Raman medium (black curve) (b) for the case of short, 10 fs pulse.
29
Extremely short, 10 fs, pulse displaces the system from the equilibrium position and leaves the sample. Thus, the system comes back to the equilibrium position performing relaxation oscillations with its eigen frequency. In fact, it was only in the year 2006 that the coherent optical phonons in diamond, induced by ISRS with sub-10fs pulses were observed experimentally [16]. This situation is presented in Figure. 1.3. (a). The spectrum of a short pulse is broad (see Fig. 1.3. (b)), thus it contains a frequency components that give a difference frequency equal to the resonant frequency of the normal mode in a crystal. In such a case the stimulated Raman gain is significant and the red shift of the pulse spectrum occurs [4, 17]. The spectrum is modified in quite homogenous way [18] and no spectral features, like for example Raman lines, are present. This is because there are many frequency pairs that give a difference of frequency equal to the resonance frequency in the pulse spectrum and those pairs have similar intensities. In fact the transformation of Eq. 1.26. gives: FT {C2 q(t)A(z, t)} = C2
Z
∞
qˆ(ω)A(z, ω ′ − ω)dω ′ ,
(1.28)
−∞
which is the convolution of the two spectra: qˆ(ω) and A(z, ω ′ − ω). The next example is for two overlapped in time 100 fs pulses of different frequencies. The difference of frequencies was chosen to be equal to the resonance frequency of the material system. The result is presented in Figure 1.4. The two pulses interfere and an interference pattern can be observed in the time profile of the pulse intensity (Fig. 1.4 (a)). The period of the fringes is equal to the resonance frequency thus every next fringe drives the normal vibrations of atoms. In such a situation the energy flows from one pulse 30
a)
1
0.1
0.6
Ion position [a. u.]
0.5 0.4 0.2 0
0
-0.5
Intensity [a. u.] Change of pulse spectrum [a. u.]
0.8
-1 -200
b)
40 THz
1
0 0.5
Spectral intensity [a. u.]
1
-0.1 0
200 400 Time [fs]
600
-50
0 Frequency [THz]
0 50
Figure 1.4: The time profile of the normalized pulse intensity (red dashed curve), and the normalized vibrational amplitude (black curve) (a) and the spectral intensity of the pulse (red dashed curve) and the relative change of the spectrum due to propagation in the Raman medium (black curve) (b) for the case of two 100 fs pulses with different frequencies.
31
a)
b)
0
0.5
-1
Change of pulse spectrum [a. u.]
1
Intensity [a. u.]
Ion position [a. u.]
1
-3
40 THz
1
1
0.8
0.6 0 0.4
Spectral intensity [a. u.]
x 10
-1 0.2
0 -200
0
200 400 600 Time [fs]
800 1000
-50
0 Frequency [THz]
0 50
Figure 1.5: The time profile of the normalized pulse intensity (red dashed curve), and the normalized vibrational amplitude (black curve) (a) and the spectral intensity of the pulse (red dashed curve) and the relative change of the spectrum due to propagation in the Raman medium (black curve) (b) for the case of two (200 and 10 fs) overlapped pulses.
to another through the coupling with atomic vibrations (Fig. 1.4 (b)). A higher frequency pulse experiences losses while the lower frequency pulse is amplified. The final interesting example is presented in Figure 1.5. Here a narrowband pulse is overlapped with a broadband, the first one is 200 fs while the second one is 10 fs long. The slope of the long pulse reaches the system first but it is the short pulse that initiates the vibrations (Fig. 1.5 (a)). It is visible in the spectrum (Fig. 1.5 (b)) that it is the long, narrow-band pulse that experiences losses in favor of a spectral region of the short, broad-band pulse separated by resonance frequency from the frequency of the long pulse. 32
Therefore a presence of a Raman line in this region is expected after long propagation. The conclusion from the examples given above is that a broad-band spectrum is required to initiate vibrations of a diamond. Moreover, in such a case, the energy can flow in between the spectrum features of the pulse. As will be discussed later, in the case of supercontinuum generation the initial spectrum of the pulse entering the diamond will be to narrow to force the vibrations efficiently. This is a situation similar to that of the first example. This spectrum will however evolve due to self-phase modulation, and the interaction with free carriers, and its shape will become similar to that of the last example. The time profile of the pulse will differ significantly from the one presented in the last example, but, still, the Raman gain on the long wavelength side of the main spectral peak will be expected, as is presented in Fig. 1.5. The last example presents also the idea behind the construction of the probe pulse in the Time-Resolved Femtosecond Stimulated Raman Scattering experiment. Here the broadband pulse is combined with strong narrow band pulse, and the presence of Raman lines is expected in the spectrum of such a pulse after propagation in the sample.
33
Chapter 2 Stimulated Raman Scattering in supercontinuum generation in diamond In this chapter the supercontinuum generation process in bulk diamond is studied experimentally and by means of numerical simulation. In particular the question of the influence of diamond vibrations, excited through stimulated Raman scattering, on the supercontinuum generation is considered. The broadening of the spectrum of intense laser light in media was first observed in 1960’ [19–23]. Broadening as high as of 100 cm−1 was found for pulses from Q-switched lasers in liquids [23] and later supercontinuum of 10 000 cm-1 for ps pulses in transparent media was observed [24, 25]. First and most important effect, which was found responsible for broadening, was self-phase modulation (SPM) [19, 21, 23, 26, 27] and its spatial manifestation – self-focusing [28, 29]. 34
The theoretical problem of light propagation in a medium with selffocusing together with SPM and dispersion is complex, thus first experiments were aiming at SPM studies in absence of the self-focusing. Therefore, studies on generation in fibers [30–33] were performed. Here a beam with intensity below self-focusing threshold could be propagated through several meters of the medium and acquire the nonlinear phase due to SPM. In addition to SPM the presence of features attributed to stimulated Raman scattering were observed in those studies [31]. An alternative was to study light propagation in thin films where self-focusing can be neglected. The effect of “self-steepening” has been revealed by those studies [34–37]. From the beginning of the studies on supercontinuum generation it was suggested that the ionization takes part in the process [38], however, experiments in gasses suggested that this aspect is negligible [33]. Anyway, only in 1990’ when the advance of computer technology made multidimensional numerical studies of the topic possible, it was found that all processes: SPM, self-focusing, self-steepening, photoionization and interaction with free charges and, in case of gasses, stimulated Raman scattering [39] have to be included in simulations to obtain results comparable with experiments [39–41]. It is obvious that SRS plays a significant role in supercontinuum generation in long media, like for example fibers [31–33,42], where intensity of light pulse is moderate and the nonlinear effects slowly buildup during the propagation. It is also included in the simulations of generation in gasses [39]. But it has been argued in many recent works on supercontinuum generation, that in thin solid samples the Raman response of the medium might be neglected [40, 43–46]. The question arises whether this assumption is 35
valid. To answer this question, herewith the diamond crystal is put under study. Diamond seems to be a perfect material for SRS study. The Raman response of diamond is orders of magnitude higher than that of fused silica and other solids [47]. It is thus used in Raman lasers [48] and in four wave mixing sources [49]. Moreover, its Raman response can be easily resolved as diamond has a single first order Raman line at 1332 cm−1 . The presence of free-current causes defocusing of the beam [40] and thus can stop the self-focusing process. Recently the 5th order nonlinear processes (self-phase modulation saturation) has been shown to play a significant role in supercontinuum generation in gases [50, 51] and that the defocusing due to free-current was overestimated. Therefore, it is currently unclear whether free-current or 5th order non-linearity affects the self-focusing more significantly. The self-phase modulation saturation was included in the simulation presented in the present dissertation. This additional term has improved the resamblance of the simulation results with the experimental ones. The main results of studies described in this chapter were published [52]. The chapter is constructed as follows. In first section the setup for supercontinuum generation experiment constructed in European Laboratory for Nonlinear Spectroscopy in Florence is described. Second, the experimental results from measurements in the diamond crystal are presented. In section 2.3. the model of supercontinuum generation based on the nonlinear envelope equation along with contributions corresponding to different phenomena is discussed. Next details on the implementation of the model are presented. Finally the results of the simulation and the experiment are compared and discussed. 36
2.1
Experimental arrangement
The usual way of generation of supercontinuum for spectroscopic purposes is first to filter the light intensity and then to filter the beam spatially with the iris of variable diameter and finally focusing it with a lens on the bulk medium. The light intensity, the diameter of iris and the position of lens or the medium in the direction of propagation are controlled in order to achieve most stable and broad supercontinuum spectrum. The experimental setup in the present study (see Figure. 2.1) was simplified to make a comparison of modeling results with the experiment more direct. So the aperture was not placed in order to avoid the difficulty of determining its actual diameter and position. The position of the crystal was the same for the whole set of measurements for various intensities. The beam was attenuated with neutral density filters. The supercontinuum generation experiment was performed in European Laboratory for Nonlinear Spectroscopy in Florence. The light source was a Ti:sapphire regenerative amplifier (Coherent Inc. Legend Elite) with repetition rate of 1 kHz. The spectrum of the pulses was centered at 800 nm and its full width at half maximum was close to 25 nm and the pulse length was close to 40 fs. The beam with waist of 4.8 mm was focused on the sample with 125 mm lens. The sample was illuminated with relatively intense pulses with easily measurable energies from 8 to 30 µJ (10 - 40 GW/cm2 ). For such high energies multiple filamentation and damage of the sample placed in the focus could occur. Therefore, the sample was displaced from the focus by 3.7 mm 37
diffuser
sample
spectrometer
Figure 2.1: The setup for studying the generation supercontinuum in diamond.
towards the lens, so that the beam size at the entrance of the sample was about 150 µm. The sample was a 2 mm thick diamond crystal of type IIa. The outgoing beam was imaged on the ground glass plate and diffused light was gathered by a spectrometer. The spectrometer was Ocean Optics USB2000 with useful spectral range from 340 to 1020 nm. The spectrometer sensitivity was calibrated with a black body spectrum. The spectra of outgoing light were acquired for different input pulses energy.
38
Light Intensity [a.u.]
10
0
10
-1
10
-2
23.1 µJ 20.1 µJ 16.9 µJ 14.1 µJ 10 µJ 7 µJ
-3
10 550
600
650
700 750 800 Wavelength [nm]
850
900
Figure 2.2: Selection of spectra of supercontinua generated in diamond for different input energies.
2.2
Experimental Results
A selection of supercontinua spectra, generated in the experiment for different input energies, are presented in Fig. 2.2. and all acquired spectra are presented on the map in Fig. 2.3. For energies below 8 µJ only slight broadening of the spectrum is observed. The spectrum broadening becomes significant for energies close to 15 µJ. For energies over 30 µJ the interference fringes appear in the supercontinuum beam pattern. The interference fringes may be caused by multiple filamentation or multiple beam refocusing in the sample. The spectra obtained at energies higher than 10 µJ contain fringe-like features. The period and position of those features are intensity dependent, what suggests that their origin results from self-phase modulation [32]. As shown by Brodeur and Chin [53] the energy difference between the blue edge of the supercontinuum and the pump central frequency is a mono39
0
24
10
22
Input energy [µJ]
18
-2
16
10
14
Output Intensity [a.u]
10-1
20
-3
12
10
10
8
-4
600
650
700 750 800 Wavelength [nm]
850
900
10
Figure 2.3: Spectra of generated supercontinua as a function of input energy measured in experiment.
tonicaly growing function of the material band gap energy. This observation was confirmed by studies of supercontinuum generation in laser host crystals [54]. The blue edge of the supercontinuum generated in diamond was found to be close to 600 nm. Although this value is high, it does not stand out from the set of accumulated data for different media [54, 55]. For input energies over 17 µJ a growing peak at wavelength of 720 nm can be observed. Fig. 2.4 presents close-up on this peak in several spectra acquired for different input intensities. The wavelength of the peak does not depend on the input intensity and therefore is not alike the features described before. The frequency separation between the peak and the central frequency 40
Wavenumber [cm-1] 1500 1300
1700
23.7 µJ 22.5 µJ 21.8 µJ 19 µJ 18.4 µJ 17.9 µJ
9
Light Intensity [a.u.]
1100
8
7
6 700
710
720 730 Wavelength [nm]
740
Figure 2.4: and peak in supercontinua spectra in vicinity of expected anti-Stokes Raman line (b)
of the input light is close to frequency of the only diamond vibration at 1332 cm−1 . Therefore, the peak was attributed to the consequence of stimulated Ramman scattering.
41
2.3
Model
The propagation of light is governed by Maxwell equations, thus all models of pulse propagation are based on the Maxwell equations and the wave equation resulting from them [32, 33, 39, 40, 46, 56–61]. Numerical solution of the complete wave equation which is of the second order in, both, time and space require finite difference or finite element methods [62]. In those methods the whole spatial domain in which the propagation occurs has to be represented. With the current advance of computer technology, it is possible to perform simulations of ultrashort pulse propagation in dispersive and even nonlinear media with those methods [63]. However, the problem becomes extremely complicated when the memory of the medium has to be considered [63, 64]. This is the case when stimulated Raman scattering or free current dynamics is considered. The problem is significantly simplified when the wave equation is transformed into the equation of the first order with respect to the propagation direction. This can be done by assumption that the pulse envelope varies slowly [57] or that the electric field component along the direction of propagation is negligible and by considering only one direction of wave propagation [59]. First models of nonlinear propagation were created with intention of analytical solution, they were, therefore, as simple as possible. They form a class of single dimensional models based on the, so called, Nonlinear Shr¨odinger equation (NLSE) [32, 33]. These are still very useful for simulations of light propagation in fiber optics. The NLSE extended by diffraction was later 42
introduced to study the effects of self-focusing with the unrealistic result of “catastrophic collapse” of the beam into a singularity [33]. The NLSE requires the pulse amplitude to be slowly varying in both space and time. In the case of ultrashort pulses this second approximation has to be relaxed. This was done by Brabec and Krausz in 1997 [57] when they proposed the nonlinear envelope equation (NEE), which is the equation used for simulations in the present dissertation. Other equations, very similar to NEE are: the Partially Corrected Nonlinear Shr¨odinger equation [50, 58] with diffraction frequency dependence included in the approximated way and modified Kadomtsev–Petviashvilli equation of type 1 [46], which differs from NEE by the form of dispersion presentation. In the NEE the “catastrophic collapse” of the beam can be blocked by 5’th order non-linearity and interaction with the free-current [40, 61]. However a class of equations where the the “catastrophic collapse” is arrested by higher orders of diffraction exists. These are the unidirectional pulse propagation equation (UPPE) [59], forward Maxwell equation [58] and others [60, 65]. In this section the model for supercontinuum generation based on the nonlinear envelope equation [57] will be presented. The consecutive terms corresponding to dispersion, diffraction, SPM, self-steepening, SRS, multiphoton ionization and interaction with free current will be discussed for the case of diamond crystal.
43
2.3.1
Master equation
The phenomenon of supercontinuum generation is modeled in this thesis with use of nonlinear envelope equation. In this section the process of derivation of this equation will be briefly described. First, the original derivation by T. Brabec and F. Krausz expanded by J. R. Gulley and W. M. Dennis to include free charge carriers will be explained. Then the derivation from more general unidirectional pulse propagation equation done by M. Kolesik and J. V. Moloney will be summarized in order to explain the main approximations and resulting advantages and disadvantages of the nonlinear envelope equation approach.
The nonlinear envelope equation was derived by T. Brabec and F. Krausz in 1997 [57] for simulation of propagation of single-cycle pulses. This derivation was later revised by J. R. Gulley and W. M. Dennis [41] to include free-carrier effects. The derivation starts with wave equation obtained from Maxwell laws: 1 ∇ E(~r, τ ) − 2 ∂τ2 c 2~
Z
τ
~ r, τ ′ )dτ ′ = µ0 ∂ 2 P~nl (~r, τ ) + µ0 ∂τ J(~ ~ r, τ ), ǫ(τ − τ ′ )E(~ τ
−∞
(2.1)
~ r, τ )) part of the polarization was already where the linear in electric field (E(~ included into the absolute permittivity ǫ(τ ), µ0 is the magnetic constant, ~ r, τ ) is the current density and τ is P~nl (~r, τ ) is the nonlinear polarization, J(~ the real time. The envelopes of the electric field, nonlinear polarization and 44
current density are then introduced: � ~ r, τ ) = ~e 1 A(~r⊥ , ζ, τ )ei(k0 z−ω0 τ ) + c.c , E(~ 2 � P~nl (~r, τ ) = ~e 12 pnl (~r⊥ , ζ, τ )ei(k0 z−ω0 τ ) + c.c , � ~ r, τ ) = ~e 1 jf c (~r⊥ , ζ, τ )ei(k0 z−ω0 τ ) + c.c , J(~ 2
(2.2)
where A, pnl and jf c are the appropriate complex envelopes, ~e is the direction of the electric field polarization, ω0 is the reference frequency, usually chosen to be the central frequency, k0 = Re {k(ω0 )} is the real part of the p propagation constant taken at reference frequency (k(ω) = ω/c ǫ(ω), ζ is the coordinate along the propagation axis. The integral in Eq. 2.1. is Fourier transformed into frequency space, where the complex propagation constant k is expanded in Taylor series in the frequency domain, and then Fourier transformed back into time space. Additionally the change of variables: z = ζ, t = τ − ζ/vg is performed to introduce the reference frame moving with the pulse group velocity vg . Finally the slowly-varying-envelope approximation is used to omit some higher order and mixed envelope derivatives and other terms (which physical meaning will be explained later) and the nonlinear envelope equation is obtained as follows: dA dz
� ˆ+ = iD
i ˆ −1 2 T ∇⊥ 2k0
�
ˆ
A + i 2nω00ǫT0 c pnl −
1 j , 2n0 ǫ0 c f c
(2.3)
ˆ is the dispersion operator coming from Taylor series expansion of the here D � � i ∂ ˆ propagation constant, T = 1 + ω0 ∂t is, so called, steepening operator, ∇2⊥ is the transverse Laplace operator, n0 is the value of the refractive index at
reference frequency, ǫ0 is the vacuum permittivity, and c is the speed of light.
45
This equation can be derived with slowly-varying-envelope approximation, but as shown by Brabec and Krauszmit can also be derived with weaker assumptions – so called slowly-evolving-wave approximation. The slowlyvarying-envelope approximation requires the pulse envelope not to change significantly after passing distances as small as the optical wavelength: |∂z A| > 1 and γ