PATIENT SAFETY A. Korn M. Fenchel B. Bender S. Danz T.K. Hauser D. Ketelsen T. Flohr C.D. Claussen M. Heuschmid U. Ernemann H. Brodoefel
Iterative Reconstruction in Head CT: Image Quality of Routine and Low-Dose Protocols in Comparison with Standard Filtered Back-Projection BACKGROUND AND PURPOSE: IR has recently demonstrated its capacity to reduce noise and permit dose reduction in abdominal and thoracic CT applications. The purpose of our study was to assess the potential benefit of IR in head CT by comparing objective and subjective image quality with standard FBP at various dose levels. MATERIALS AND METHODS: Ninety consecutive patients were randomly assigned to undergo nonenhanced and contrast-enhanced head CT at a standard dose (320 mAs; CTDI, 60.1) or 15% (275 mAs; CTDI, 51.8) and 30% (225 mAs; CTDI, 42.3) dose reduction. All acquisitions were reconstructed with IR in image space, and FBP and images were assessed in terms of quantitative and qualitative IQ. RESULTS: Compared with FBP, IR resulted in lower image noise (P ⱕ .02), higher CNR (P ⱕ .03), and
improved subjective image quality (P ⱕ .002) at all dose levels. While degradation of objective and subjective IQ at 15% dose reduction was fully compensated by IR (CNR, 1.98 ⫾ 0.4 at 320 mAs with FBP versus 2.05 ⫾ 0.4 at 275 mAs with IR; IQ, 1.8 versus 1.7), IQ was considerably poorer at 70% standard dose despite using the iterative approach (CNR, 1.98 ⫾ 0.3 at 320 mAs with FBP versus 1.85 ⫾ 0.4 at 225 mAs with IR, P ⫽ .18; IQ, 1.8 versus 2.2, P ⫽ .03). Linear regression analysis of CNR against tube current suggests that standard CNR may be obtained until approximately 20.4% dose reduction when IR is used. CONCLUSIONS: Compared with conventional FBP, IR of head CT is associated with significant improvement of objective and subjective IQ and may allow dose reductions in the range of 20% without compromising standard image quality. ABBREVIATIONS: CNR ⫽ contrast-to-noise ratio; CTDI ⫽ CT dose index; CTDIvol ⫽ volume CT dose
index; DLP ⫽ dose-length product; FBP ⫽ filtered back-projection; GM ⫽ gray matter; IQ ⫽ image quality; IR ⫽ iterative reconstruction; IRIS ⫽ iterative reconstruction in image space; MDCT ⫽ multidetector row CT
T
he technical evolution of MDCT has not only revolutionized image quality and scanning speed but has also dramatically increased the number of CT examinations in the industrialized world. As a result, there is a growing concern regarding the associated radiation dose.1 Today, ⬎70 million annual CT scans are obtained in the United States and may be responsible for about 2% of all incident cancer cases.1,2 As head CT has evolved as the technique of choice to assess traumatic and nontraumatic neurologic conditions, its use has become particularly frequent in both the adult and pediatric populations.3 In the past decade, various dose-reduction strategies, such as automated tube current modulation, low voltage scanning, and noise-reduction filters, have been explored but could not prevent a steady increase of average effective dose with advanced scanner technology.4-9 Unfortunately, the most straightforward technique in lowering dose, notably the reReceived April 11, 2011; accepted after revision May 13. From the Departments of Diagnostic und Interventional Neuroradiology (A.K., M.F., B.B., S.D., T.K.H., U.E.) and Diagnostic and Interventional Radiology (D.K., C.D.C., M.H., H.B.), Eberhard-Karls-University, Tu¨bingen, Germany; and Computed Tomography Division (T.F.), Siemens HealthCare, Forchheim, Germany. Please address correspondence to Harald Brodoefel, MD, Department of Diagnostic Radiology, Eberhard-Karls-University, Hoppe-Seyler-Str. 3, 72076 Tu¨bingen, Germany; email:
[email protected] http://dx.doi.org/10.3174/ajnr.A2749
218
Korn 兩 AJNR 33 兩 Feb 2012 兩 www.ajnr.org
duction of tube current, is associated with unacceptable increase of image noise. This effect is partly due to limitations in the current standard reconstruction method of FBP. With FBP, increased spatial resolution is directly correlated with increased image noise and is traded against noise by application of different reconstruction kernels. Only recently, an alternative mathematic algorithm, IR, was introduced to CT. To a certain extent, IR allows decoupling of spatial resolution and image noise and may thus be used to lower noise at standard or improved resolution of images.10,11 In IR, a correction loop is introduced in the image reconstruction process. Once an image has been reconstructed from the measured projection data, a ray-tracing in the image is performed to calculate new projections that exactly represent the reconstructed image, as if the reconstructed image had been the measurement object of a CT scan. This step, called forward projection, simulates the CT measurement. If the image reconstruction were perfect, no deviation between measured and calculated projections would be observed. In reality, due to the approximate nature of FBP reconstruction typically used for image reconstruction, there is a deviation between measured and calculated projections. This is used to derive correction projections, reconstruct a correction image, and update the original image. This loop is continued until the deviation between measured and calculated projections is
Materials and Methods Patient Groups The study was approved by the local institutional review board. Because unpublished customer and vendor experience suggests preservation of diagnostic image quality at all dose levels used in our study, informed consent of patients was waived and all examinations were performed as standard of care. The participants were 90 consecutive patients who were scheduled for both nonenhanced and contrast-enhanced head CT and who were randomly assigned to 1 standard and 2 low-dose CT protocols. Reasons to perform the examination were manifold and included tumor staging, exclusion of septic emboli, and ischemia.
Data Acquisition and Reconstruction All CT examinations were performed by using a 128-section dualsource CT scanner (Somatom Definition Flash; Siemens, Forchheim, Germany). Image-acquisition parameters of the standard protocol included a collimation of 40 ⫻ 0.6 mm, pitch of 0.55, rotation time of 1.0 second, tube voltage of 120 kV, and tube current of 320 mAs. Scan parameters for low-dose studies were identical except for tube current, which was reduced to 275 or 225 mAs, respectively. Contrast-
enhanced examinations were performed 180 seconds postadministration of 65 mL of iodinated contrast medium (Imeron 400 [iomeprol], 400 mg I/mL; Bracco Altana Pharma, Konstanz, Germany). Raw data of all CT examinations were reconstructed by using both mathematic algorithms, FBP and IR. Reconstruction parameters included an H30s⫹ medium smooth convolution kernel for FBP and the equivalent J30 medium smooth kernel for IR, a section-thickness of 4.5 mm with a 4.5-mm increment, and an FOV appropriate to head size. The time for reconstruction was recorded in 10 patients. For a subset analysis of image sharpness, additional reconstructions were performed in 15 patients with bone window kernels, notably the H70 for FBP and the equivalent J70 for IR. Section-thickness and increment in these reconstructions were 2 mm.
Dose Measurements The CTDIvol and DLP were recorded for every CT examination. Effective dose (millisievert) was estimated by multiplying DLP with a constant region-specific conversion coefficient of 0.0023 mSv/ (mGy ⫻ cm).20
Quantitative Image Analysis Assessment of quantitative image parameters was done by a boardcertified, not subspecialty-certified, reader with 1 year of training in neuroradiology (H.B.). For each pair of FBP and IR reconstructions, 4 mm2 regions of interest were placed in identical infra- and supratentorial WM and GM locations, the ventricle, and air, 5 mm outside the skull at its widest circumference. Measurements from infra- and supratentorial WM and GM regions were averaged for further analysis. Signal intensity was defined as CT attenuation in Hounsfield units; image noise, as the SD of attenuation within a region of interest. SNRs and CNRs were calculated by using the following standard equations: SNR ⫽ Mean HU of Tissue in Region of Interest/ SD of HU in Region of Interest CNR ⫽ (Mean GM HU ⫺ Mean WM HU)/ [(SD GM HU)2 ⫹ (SD WM HU)2]1/2. For a subset analysis of image sharpness, FBP and IR bone window reconstructions of 15 patients were assessed by a Matlab tool (MathWorks, Natick, Massachusetts) on a separate workstation. The program measures CT attenuation values in Hounsfield units across pixels that are lined perpendicular to the skull circumference. Sharpness is quantified as maximal slope (Change in HU/Pixel).
Qualitative Image Analysis Qualitative analysis of images was independently performed by 2 board-certified, subspecialty-certified readers (A.K.) and (M.F.) with 3 and 4 years of training in neuroradiology. Before the grading of study images, the reading radiologists were trained for consensus regarding our image-quality scoring system on 20 routine head CT examinations. For randomized and anonymous analysis of study patients, subjects were randomly selected by 1 of our authors (B.B.) and FBP and IR reconstructions of nonenhanced and contrast-enhanced scans were simultaneously displayed to the readers, by using two 325 ⫻ 433 mm screen-size monitors with a 160 ⫻ 372 mm image size per individual series. The order of display for FBP and IR series was changed in a random fashion, and information on the type of reconstruction or dose level was masked. All images were reviewed at a PACS workstation (Centricity; GE Healthcare, Milwaukee, WisconAJNR Am J Neuroradiol 33:218 –24 兩 Feb 2012 兩 www.ajnr.org
219
PATIENT SAFETY
smaller than a predefined limit. Each time the original image is updated, nonlinear image processing algorithms, so called “regularizations,” are used to stabilize the resolution. While the repeated calculation of correction projections removes artifacts introduced by the approximate nature of FBP, it is this regularization procedure that is essential for the noise-reduction properties of an IR.12 With proper regularization, image noise can be lowered without loss of detail resolution, which—as a consequence—allows reduction of radiation exposure to the patient. IRIS is 1 variant of IR that applies the regularization procedure to the image data in an iterative loop without forward projection and calculation of correction projections.12 As a consequence, IRIS aims at reduction of image noise and not at reduction of potential image artifacts, such as conebeam artifacts, which are not a severe problem anyway in CT systems with relatively small detector width in the z-direction. In the IRIS approach, an iterative series of 3D nonlinear image-filtering steps, corresponding to the regularization in a standard IR, is performed after reconstruction of an initial high-resolution image by means of the FBP technique. This high-resolution image contains all measured information that is otherwise partially suppressed in a standard CT reconstruction to obtain acceptable image-noise levels. Depending on the clinical task, 3–5 iterations of regularizations are performed. They aim at maintaining or even enhancing spatial resolution, while reducing image noise without degrading the image texture. The primary asset to all forms of IR is that they are consistently associated with significant reduction of image noise and may thus be used to perform CT examinations at lower dose, yet robust, image quality. Until now, this concept has been demonstrated for thoracic, abdominal, and cardiac CT examinations.13-19 The aim of our study was to systematically assess IR at various tube currents in head CT and thereby determine the practicability of reducing dose without compromising standard image quality.
Table 1: Patient characteristics and radiation dose in CT protocols with various tube currents Characteristic Age Sex (male/female) CTDIvol (mGy) DLP (mGy.cm) Effective dose (mSv)
320 mAs 63 ⫾ 14 12/18 60.1 1043 ⫾ 53 2.2 ⫾ 0.1
275 mAs 67 ⫾ 13 14/16 51.8 890 ⫾ 34 1.8 ⫾ 0.07
225 mAs 66 ⫾ 12 19/11 42.3 733 ⫾ 52 1.5 ⫾ 1.0
P .54 .17 — ⬍.0001 ⬍.0001
sin) with use of standard display settings (window level, 36; width, 80). Subjective image quality was assessed in terms of noise, GM-WM differentiation, sharpness of subarachnoid space margins, distinctness of posterior fossa contents, and overall diagnostic acceptability. Noise was graded as the following: 1, very low; 2, low; 3, considerable with preserved diagnostic image quality; 4, high, causing nondiagnostic image quality. All other parameters were scored as the following: 1, excellent; 2, good; 3, suboptimal, but still diagnostic; and 4, unacceptable and nondiagnostic. Grades for image quality were averaged across both readers for further analysis.
Statistical Analysis Statistical analysis was performed with software (JMP, Version 6, SAS Institute, Cary, North Carolina; Prism, Version 4.00, GraphPad Software, San Diego, California). A P value ⬍ .05 indicated statistical significance. An unpaired t test and 2 test were used to compare continuous and proportional patient characteristics between subgroups. Regarding objective imaging parameters, intraprotocol comparisons between FBP and IR were done by paired t tests. For comparisons between various tube currents or CT protocols, an unpaired t test or 1-way analysis of variance with a subsequent Tukey multiple comparison test was used. The Wilcoxon signed rank test, Mann-Whitney U test, or KruskalWallis with the Dunn multiple comparison test was used for analysis of subjective image-quality scores. Inter-rater agreement in the assessment of image quality was quantified by weighted statistics.
Results Noncontrast and contrast-enhanced imaging was performed in 90 patients; the characteristics of subjects within the distinct study groups are shown in Table 1. Median time for reconstruction was substantially longer with use of the iterative algorithm, notably 68 seconds (range, 61–74 seconds) versus 25 seconds (range 22–27 seconds). Radiation Dose Dose-related parameters are summarized in Table 1. While the CTDIvol was 60.1 mGy in the 320-mAs reference group, it was reduced to 85.5% in the low-dose group 1 (275 mAs) or 70.3% in low-dose group 2 (225 mAs). Accordingly, compared with 1043 mGy.cm and 2.2 mSv in standard head CT, DLP and effective dose were cut down to 85.3% with use of 275 mAs and 70.2% when applying 225 mAs. Quantitative Analysis A 15-patient subset analysis of image sharpness at bone window kernels demonstrated an insignificant 3% decrease with the use of IR (396.9 ⫾ 111.3 versus 386.3 ⫾ 117 change in HU/Pixel; P ⫽ .55). By contrast, analysis of attenuation values did not reveal 220
Korn 兩 AJNR 33 兩 Feb 2012 兩 www.ajnr.org
any difference between tube currents and reconstruction algorithms used. Accordingly, the reduction of noise in WM and GM, liquor, and background for all of the 3 CT protocols resulted in significant enhancement of SNR (Table 2) and CNR (Fig 1) with IR postprocessing. The average improvement of CNR by using IR versus FBP was 13% (1.82 ⫾ 0.4 versus 2.06 ⫾ 0.4; P ⬍ .0001). Conversely, in both IR and FBP reconstruction, reduction of tube current was associated with a significant increase of image noise or degradation of SNR (Table 2) and CNR (Fig 1). In detail, with FBP, the decrease of CNR was 10% (1.98 ⫾ 0.4 versus 1.78 ⫾ 0.4; P ⫽ .016) in a 275-mAs and 17% (1.98 ⫾ 0.4 versus 1.65 ⫾ 0.4; P ⫽ .0008) in a 225-mAs low-dose protocol. Hence, compared with the standard 320-mAs CT with FBP, quantitative degradation of image quality by lowering the tube current to 275 mAs was fully compensated when applying IR (1.98 ⫾ 0.4 versus 2.05 ⫾ 0.4, Fig 1). CNR in 225mAs datasets with IR was approximately 7% below the average of a standard 320-mAs FBP protocol (1.98 ⫾ 0.3 versus 1.85 ⫾ 0.4; P ⫽ .18, Fig 1). Linear regression analysis of CNR against tube current suggests that standard CNR may be obtained until about 20.4% dose reduction (255 mAs) when IR is used (Fig 2). Qualitative Analysis With all tube currents, use of an iterative algorithm was associated with significant improvement of scores for noise, GM-WM differentiation, sharpness of subarachnoid space, and overall diagnostic acceptability (Table 3 and Fig 3). The benefit of IR was less consistent with regard to the visualization of posterior fossa contents. When compared with the 320-mAs FBP standard protocol, lowering the tube current to 225 mAs resulted in considerable deterioration of overall diagnostic acceptability with both reconstruction algorithms (1.8 versus 2.7 for FBP, P ⬍ .0001; 1.8 versus 2.2 for IR, P ⫽ .03). No difference was observed between 320 mAs with FBP and 275 mAs with IR reconstruction (1.8 versus 1.7, P ⫽ .63; Fig 4). The interobserver agreement in the assessment of various image-quality parameters was good (weighted , 0.68). Discussion The increasing use of MDCT has fueled a heightened concern regarding potential hazards and has evoked an extensive interest in minimizing radiation exposure. Unfortunately, many traditional dose-reduction strategies (eg, low tube current and voltage scanning or specific noise reduction kernels) come at the price of degraded image quality. While for many applications of conventional body CT, a mild increase of noise may not limit diagnostic accuracy, classic neuroradiologic issues such as detection of acute ischemia, edema, or hemorrhage require exceptional image quality and leave little room for compromise. The reason lies with minute attenuation differences between WM and GM, the shielding of tissue by the skull, and the inherently unfavorable SNR. IR has long been discussed as a highly promising reconstruction concept to achieve considerable dose reduction without losing image quality. Unlike traditional FBP, the method is based on a correction loop within the image-generation process, which leads to significant reduction of noise
Table 2: Mean and SD of SNR in various CT protocols with either IR or FBPa Tube Current 320 mAs Non-Enhanced WM GM LQ BG Contrast-Enhanced WM GM LQ BG
Tube Current 275 mAs
Tube Current 225 mAs
IR
FBP
IR
FBP
IR
FBP
8.8 ⫾ 2.1 10.9 ⫾ 2 1.4 ⫾ 0.5 ⫺448
7.9 ⫾ 1, P ⫽ 0.01 9.4 ⫾ 1.4, P ⬍ .0001 1.2 ⫾ 0.4, P ⬍ .0001 ⫺302, P ⬍ .0001
8.0 ⫾ 1.7 9.8 ⫾ 1.4 1.3 ⫾ 0.4 ⫺385
7.0 ⫾ 1.3, P ⬍ .0001 8.3 ⫾ 1.3, P ⬍ .0001 1.0 ⫾ 0.3, P ⬍ .0001 ⫺210, P ⬍ .0001
7.6 ⫾ 1.5 9.7 ⫾ 1.8 1.2 ⫾ 0.3 ⫺295
6.7 ⫾ 1.4, P ⫽ .006 8.4 ⫾ 1.6, P ⬍ .0001 1.0 ⫾ 0.3, P ⬍ .0006 ⫺244, P ⬍ .0001
8.9 ⫾ 1.8 11.2 ⫾ 1.7 1.3 ⫾ 0.6 ⫺385
7.6 ⫾ 1.4, P ⬍ .0001 10.2 ⫾ 1.6, P ⫽ .001 1.0 ⫾ 0.4, P ⬍ .0001 ⫺328, P ⬍ .0001
7.9 ⫾ 1.5 10.2 ⫾ 1.7 1.2 ⫾ 0.5 ⫺222
6.8 ⫾ 1.1, P ⬍ .0001 9.0 ⫾ 1.4, P ⫽ .0008 1.0 ⫾ 0.4, P ⫽ 0.004 ⫺192, P ⬍ .008
7.8 ⫾ 1.4 9.4 ⫾ 2.1 1.1 ⫾ 0.3 ⫺221
6.5 ⫾ 1.0, P ⬍ .0001 8.6 ⫾ 1.7, P ⫽ .02 0.9 ⫾ 0.4, P ⬍ .001 ⫺191, P ⬍ .0001
Note:—LQ indicates liquor; BG, background. a Data are shown for WM, GM, LQ, and BG measurements in air outside the skull. P values refer to differences between IR and FBP.
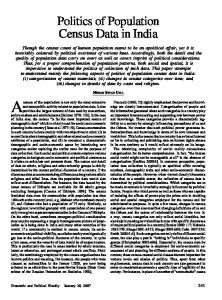
Fig 2. Regression plot of CNR against tube current with IR and FBP. According to linear regression equation, the x-intercept is at a tube current of 255 mAs when y is at a standard 1.98 CNR (320-mAs FBP).
Fig 1. CNR in nonenhanced (A) and contrast-enhanced (B) head CT with the use of various tube currents and reconstruction of data by FBP or IR. In the boxplot diagrams, the line across the middle of the box identifies the median sample value; boxes extend from the 25th to the 75th quartile, and whiskers, down to the lowest and highest values.
with maintenance of image resolution.11 However, for a long time, the required computational power for everyday use has not been available and variations of the algorithm have only recently been introduced into clinical routine. At this stage, several studies have confirmed the capability of IR to achieve robust image quality in low-dose abdominal, thoracic, and cardiovascular CT examinations.13-19,21 Our study is the first to assess the iterative approach in head CT. We find that IR achieves a significant reduction of image noise, which is robust among various dose protocols and nonenhanced and contrast-enhanced studies. Image sharpness is decreased by approximately 3%, yet this difference proved insignificant in a smaller subset analysis and does not translate into deterioration of subjective image quality. In fact, the latter
is improved by lower noise levels that correlate with increased SNR and CNR due to the preservation of attenuation values. While IR achieves robust objective and subjective image quality in an 85% low-dose protocol, a 30% dose reduction is associated with noticeable degradation of quality. In terms of quantitative imaging parameters, a linear regression equation suggests that standard quality may be preserved until approximately 20% dose reduction whenever IR is used. Due to the computational complexity, time for reconstruction was substantially increased with use of the iterative algorithm. However, with a median reconstruction interval of 68 seconds, clinical efficiency was not affected. Also, as both the method and computational power continue to evolve, a further decrease of processing time is expected in the near future. When compared with dose savings of 33%–50% or 36%– 75% in abdominal and thoracic applications, our findings for head CT may appear somewhat modest.15-17,19,21 Apart from conceivable variations in different vendors or products, the most likely explanation for such discrepancies is the critical CNR in the GM-WM differentiation and a more marked increase of noise with the reduction of tube current in head CT. Nonetheless, maintaining standard image quality at dose savings in the range of 20% still represents a considerable step in terms of patient dose reduction and may particularly benefit the large number of patients with serial follow-up examinations. In this context, the standards for image quality in our study were derived from a relatively high-dose protocol, designed for applications that require an exceptional CNR. AccordAJNR Am J Neuroradiol 33:218 –24 兩 Feb 2012 兩 www.ajnr.org
221
Table 3: Mean and median of qualitative image scores in various CT protocols with either IR or FBPa Tube Current 320 mAs Non-Enhanced Noise GM/WM SS PF DA Contrast-Enhanced Noise GM/WM SS PF DA
IR
FBP
1.2 (1) 1.4 (1) 1.4 (1) 1.6 (2) 1.3 (1)
1.6 (1.5), P ⫽ .003 1.8 (2), P ⫽ .002 1.7 (2), P ⫽ .007 2.0 (2), P ⫽ .1 1.7 (2), P ⫽ .002
1.2 (1) 1.3 (1) 1.3 (1) 1.6 (2) 1.2 (1)
1.4 (1.5), P ⫽ .02 1.6 (2), P ⫽ .002 1.6 (2), P ⫽ .004 2.0 (2), P ⫽ .01 1.8 (2), P ⫽ .007
Tube Current 275 mAs IR
Tube Current 225 mAs
FBP
IR
FBP
1.6 (2) 1.6 (1.5) 1.6 (2) 2.0 (2) 1.7 (2)
1.9 (1.75), P ⫽ .001 2.2 (2.25), P ⫽ .009 2.0 (2), P ⫽ .01 2.7 (2.5), P ⫽ .001 2.2 (2), P ⫽ .0005
2.0 (2) 2.2 (2) 2.1 (2) 2.8 (3) 2.2 (2)
2.5 (2.5), P ⬍ .0001 2.9 (3.0), P ⬍ .0001 2.7 (3), P ⫽ .0006 3.4 (3), P ⫽ .0002 2.8 (2.5), P ⬍ .0001
1.4 (1) 1.6 (1.5) 1.5 (1.75) 2.2 (2) 1.6 (2)
1.8 (1.75), P ⫽ .003 2.1 (2), P ⫽ .001 1.9 (2), P ⫽ .008 2.5 (2.5), P ⫽ .09 2.0 (2), P ⫽ .008
2.1 (2) 2.1 (2) 2.0 (2) 2.8 (3) 2.1 (2)
2.5 (2.5), P ⫽ .0002 2.7 (3), P ⫽ .0004 2.6 (3), P ⬍ .0001 3.0 (3), P ⫽ .2 2.6 (2.5), P ⫽ .0003
Note:—SS indicates subarachnoid space margins; PF, distinctness of posterior fossa contents; DA, overall diagnostic acceptability. a Image-quality grading is provided for noise, GM-WM matter differentiation, sharpness of SS, PF, and overall DA. Median is in parentheses.
Fig 3. Subjective grading of WM-GM differentiation in nonenhanced (A) and contrast-enhanced (B) head CT with use of various tube currents and reconstruction of data by FBP or IR. Data are presented as means and ranges.
ingly, automatic tube current modulation was not applied and the collimation was set to 40 ⫻ 0.6 mm. The resultant CTDIvol and DLP of our routine protocol are in line with the European diagnostic reference levels.22 Whether the associated level of image quality always translates into a heightened accuracy or better diagnosis is debatable; however, this problem is beyond the scope of our current study. Notably, other institutions have different standards for diagnostic confidence, and systematic analyses of routine protocols have shown a considerable variability of radiation dose and image quality between institutions or scanners.23,24 Undoubtedly, many everyday applications such as follow-up examinations of hematoma, tumors, or the evaluation of ventricular shunts carry the potential for significant reduction of routine dose, which— independent of individual standards for diagnostic confidence—may be even more substantial when IR is used. Finally, because iterative processing is still a very young approach, it is likely that more advanced and powerful variations of the technique will emerge in the near future and, thereby, enable additional dose savings. 222
Korn 兩 AJNR 33 兩 Feb 2012 兩 www.ajnr.org
The first limitation of our study is the small sample size per group, requiring confirmation of our findings in a larger patient series. Different tube currents were applied to different patient cohorts so that a more accurate—yet practically almost impossible—intrapatient comparison of protocols could not be performed. As indicated above, the focus of our study was on subjective and objective image quality; we did not assess the diagnostic accuracy of IR low-dose acquisitions in comparison with standard protocols. Conclusions Our data support the use of IR in head CT as a valuable tool for significant dose reduction. The algorithm is robust in lowering image noise and improves quantitative and qualitative imaging parameters in both nonenhanced and contrast-enhanced scans at variable radiation doses. The potential of IR to maintain standard image quality at ⱕ20% dose reduction justifies larger clinical studies with a focus on diagnostic accuracy. Disclosures: Thomas Flohr, Unrelated: employment Siemens.
Fig 4. Example of image quality at 320 (A and D), 275 (B and E), and 225 (C and F) mAs. At all dose levels, use of IR (D⫺F) is associated with a considerable reduction of noise and enhancement of image quality. As demonstrated in our study, this is achieved without significant loss of image sharpness. While image quality at 85% dose and IR (E) is similar to the standard of reference (A), a 30% dose reduction results in substantial increase of noise despite using IR (F).
References 1. Brenner DJ, Hall EJ. Computed tomography: an increasing source of radiation exposure. N Engl J Med 2007;357:2277– 84 2. Brenner DJ. Slowing the increase in the population dose resulting from CT scans. Radiat Res 2010;174:809 –15 3. Mahesh M. NCRP report number 160: its significance to medical imaging. J Am Coll Radiol 2009;6:890 –92 4. Kalra MK, Maher MM, Blake MA, et al. Detection and characterization of lesions on low-radiation-dose abdominal CT images postprocessed with noise reduction filters. Radiology 2004;232:791–97 5. Kalra MK, Maher MM, Toth TL, et al. Techniques and applications of automatic tube current modulation for CT. Radiology 2004;233:649 –57 6. Mettler FA Jr, Wiest PW, Locken JA, et al. CT scanning: patterns of use and dose. J Radiol Prot 2000;20:353–59 7. Mullins ME, Lev MH, Bove P, et al. Comparison of image quality between conventional and low-dose nonenhanced head CT. AJNR Am J Neuroradiol 2004;25:533–38 8. Udayasankar UK, Braithwaite K, Arvaniti M, et al. Low-dose nonenhanced head CT protocol for follow-up evaluation of children with ventriculoperitoneal shunt: reduction of radiation and effect on image quality. AJNR Am J Neuroradiol 2008;29:802– 06 9. Vock P. CT dose reduction in children. Eur Radiol 2005;15:2330 – 40 10. Nuyts J, De Man B, Dupont P, et al. Iterative reconstruction for helical CT: a simulation study. Phys Med Biol 1998;43:729 –37 11. Thibault JB, Sauer KD, Bouman CA, et al. A three-dimensional statistical approach to improved image quality for multislice helical CT. Med Phys 2007;34:4526 – 44 12. Bruder H RR, Sunnegardh J, Stiersturter K, et al. Translation of statistical iterative reconstruction into non-linear image processing. In: Proceedings of the
13.
14.
15.
16.
17.
18.
19.
20.
Annual Meeting of the Radiological Society of North America, Chicago, Illinois. November 28-December 3, 2010 Bittencourt MS, Schmidt B, Seltmann M, et al. Iterative reconstruction in image space (IRIS) in cardiac computed tomography: initial experience. Int J Cardiovasc Imaging 2010;27:1081– 87 Gosling O, Loader R, Venables P, et al. A comparison of radiation doses between state-of-the-art multislice CT coronary angiography with iterative reconstruction, multislice CT coronary angiography with standard filtered back-projection and invasive diagnostic coronary angiography. Heart 2010;96:922–26 Leipsic J, Nguyen G, Brown J, et al. A prospective evaluation of dose reduction and image quality in chest CT using adaptive statistical iterative reconstruction. AJR Am J Roentgenol 2010;195:1095–99 Pontana F, Duhamel A, Pagniez J, et al. Chest computed tomography using iterative reconstruction vs filtered back projection. Part 2. Image quality of low-dose CT examinations in 80 patients. Eur Radiol 1011;21:636 – 43. Epub 2010 Nov 16 Sagara Y, Hara AK, Pavlicek W, et al. Abdominal CT: comparison of low-dose CT with adaptive statistical iterative reconstruction and routine-dose CT with filtered back projection in 53 patients. AJR Am J Roentgenol 2010;195:713–19 Silva AC, Lawder HJ, Hara A, et al. Innovations in CT dose reduction strategy: application of the adaptive statistical iterative reconstruction algorithm. AJR Am J Roentgenol 2010;194:191–99 Singh S, Kalra MK, Hsieh J, et al. Abdominal CT: comparison of adaptive statistical iterative and filtered back projection reconstruction techniques. Radiology 2010;257:373– 83. Epub 2010 Sep 9 Shrimpton PC, Hillier MC, Lewis MA, et al. National survey of doses from CT in the UK: 2003. Br J Radiol 2006;79:968 – 80
AJNR Am J Neuroradiol 33:218 –24 兩 Feb 2012 兩 www.ajnr.org
223
21. Singh S, Kalra MK, Gilman MD, et al. Adaptive statistical iterative reconstruction technique for radiation dose reduction in chest CT: a pilot study. Radiology 2011;259:565–73. Epub 2011 Mar 8 22. Bogartz G, Golding SJ, Jurik AG, et al, for the European Study Group of Radiologists and Physicists. European Guidelines on Quality Criteria for Computed Tomography. 1999. http://www.drs.dk/guidelines/ct/quality. Accessed May 15, 2011
224
Korn 兩 AJNR 33 兩 Feb 2012 兩 www.ajnr.org
23. Jaffe TA, Hoang JK, Yoshizumi TT, et al. Radiation dose for routine clinical adult brain CT: variability on different scanners at one institution. AJR Am J Roentgenol 2010;195:433–38 24. Tsapaki V, Aldrich JE, Sharma R, et al. Dose reduction in CT while maintaining diagnostic confidence: diagnostic reference levels at routine head, chest, and abdominal CT: IAEA-coordinated research project. Radiology 2006;240:828 – 34. Epub 2006 Jul 12