ITE Trans. on MTA Vol. 4, No. 3, pp. 269-276 (2016)
Copyright © 2016 by ITE Transactions on Media Technology and Applications (MTA)
The Specific Absorption Rate Evaluation of 1.2 GHz Band Wireless Camera by a Thermographic Method Tetsuya Yoshida †, Kazuyuki Saito †† (member), Koichi Ito ††, Masaharu Takahashi †† Abstract Until now, the 700 MHz band has been used for the field pickup unit (FPU), which is used for the live broadcasting of events, such as marathons and long-distance relay races. However, the frequency band is slated to migrate to 1.2 and 2.3 GHz bands based on an action plan for radio spectrum reallocation developed by the Ministry of Internal Affairs and Communications, Japan. With the frequency migration of the FPU, the size of transmitting antennas can be downsized. Therefore, 1.2 and 2.3 GHz band antennas can also be mounted on wireless cameras for professional-use. In this study, we measured the specific absorption rate (SAR) on the body of the operator exposed to electromagnetic waves radiated from the transmission antenna of the wireless camera via a 1.2 GHz band. We also calculated the SAR to confirm the validity of the measurement method, and we compared the measured results with the calculated ones. As the result, SAR distributions between the measured and the calculated results were nearly identical. It is thus possible to evaluate the SAR using the method suggested in this paper. Keywords: wireless camera, 1.2 GHz band, specific absorption rate, thermographic method, finite-difference time-domain method.
energy absorbed in the human body has a thermal effect
1. Introduction
in human tissue. As a wireless camera is used on the operator's shoulder, the thermal effect of the microwave
Currently, a 700 MHz band (770 – 806 MHz) is used 1) ,
which is used to
energy coming from the camera should be taken into
transmit video and audio in mobile signal relays, such as
consideration. Up until now, the specific absorption rate
marathons and long-distance relay races. However, the
(SAR) at the human head with mobile phones has been
frequency band is slated to migrate to a 1.2 GHz band
evaluated 4); however, little dosimetry has been found
(1.24 – 1.3 GHz) and a 2.3 GHz band (2.33 – 2.37 GHz)
with the wireless camera. The frequency band and the
by March 31, 2019, based on the action plan for radio
shape of the transmitting antenna mounted on the
spectrum reallocation developed by the Ministry of
wireless camera are different from those of the mobile
for the field pickup unit (FPU)
Internal Affairs and Communications,
Japan 2).
phone. Additionally, the output power of the wireless
After the migration, as the wavelength of the
camera is higher than that of the mobile phone. A total
frequency band will be shorter than that of the 700 MHz
of 25 W are required at a 1.2 GHz band and 40 W at a
band, it will be possible to downsize the transmitting
2.3 GHz band in order to secure the area equal to an
antennas and to save the power of the signal
FPU at a 700 MHz band, 5 W 5). For these reasons,
transmission. Therefore, in addition to FPU for mobile
considering the future use of the wireless camera, it is
relays, the 1.2 and 2.3 GHz band antennas will also be
necessary to evaluate its effect further. In addition, the
mounted on wireless cameras for professional-use. In
same situations have been investigated only via
fact, wireless cameras have already been used abroad.
numerical simulations 6) ; no experiments have been
For example, in the United Kingdom (UK), wireless
completed. Numerical simulations generally require a
GHz 3).
fairly large amount of computational resources (memory
These will also be used in Japan. However, microwave
and computational time) to calculate one particular
cameras are used for 2.5 GHz, 3.5 GHz, and 7.2
condition among many possible situations. Therefore, a Received November 30, 2015; Revised March 15, 2016; Accepted May 19, 2016 † Graduate School of Engineering, Chiba University
fast and easy experimental procedure with validated accuracy and repeatability is of particular interest when
(Chiba, Japan)
considering these various situations.
†† Center for Frontier Medical Engineering, Chiba University
In this paper, assuming that a 1.2 GHz band wireless
(Chiba, Japan)
269
ITE Trans. on MTA Vol. 4, No. 3 (2016)
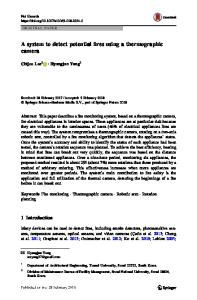
camera was being used, we measured the amount of electromagnetic (EM) exposure using a tissue-equivalent semi-hard phantom. A phantom is a model consisting of material that is electrically equivalent to tissue. As an evaluation index of the EM wave exposure when using the wireless device, the SAR [W/kg] was employed. It is defined by the following equation (1). (1) Fig. 1 Wireless camera model.
where σ, ρ, and E are the electrical conductivity [S/m], the density of the biological tissue [kg/m 3], and the electric field (r.m.s) [V/m], respectively. Three different indexes are defined by a whole-body average SAR, a local peak SAR, and a local average SAR. A whole-body average SAR and a local average SAR must be averaged over a defined period of time. In wireless devices at a high frequency band, the absorption predominantly affects parts of the body that are close to the device. Therefore, the most critical value is the local peak SAR. In the SAR measurement method, there are two primary ways of measuring the electric field: the probe method 7) and the thermographic method 8). The method used for the SAR measurement of the mobile phone is Fig. 2 Transmitting antenna model.
the former. However, in this paper, we used the thermographic method to measure the SAR distribution of the surface of the human head because this method
in the camera model, such as shown in as Fig. 2. The
can reproduce various situation of variously-shaped
transmitting antenna was not connected to the wireless
electromagnetic wave emission apparatuses.
camera electrically. The coaxial cable went through the
Moreover, we calculated the SAR to confirm the
cylinder inside; the top and middle cylinders were
measurement method's validity. Then, we compared the
connected to the inner conductor and outer conductor,
measured results with the calculated ones and
respectively, as shown in Fig. 2. The wireless camera model used in the measurement
confirmed the validity of the measured results.
and calculation are, respectively, shown in Figs. 3 and 4.
2. Material and method
The thickness of the metallic plate of the calculation
2.1 Wireless camera model
model was 2 mm. However, we placed a copper foil seal
In this study, we used the wireless camera model with
on the wireless camera surface, assuming a metal object
a transmitting antenna for a 1.2 GHz band, which is
in the measurement model. The transmitting antenna
shown in Fig. 1. We constructed this model with
was fed with a coaxial cable. In the measurement,
reference to the camera used in the broadcasting
coaxial feeding was carried out at the feeding point, as
Japan 9).
The wireless camera was modeled
shown in Fig. 2. However, in the calculation, we fed the
using a metallic plate, and the inside of the camera
transmitting antenna via gap feeding between the
model was hollow.
cylindrical elements, which is shown in Fig. 4, to save
industry in
computational resources (such as memory and
We employed the half-wavelength cylindrical dipole antenna 6) shown in Fig. 2 as a transmitting antenna for
computational time).
the 1.2 GHz band. The diameter of the cylindrical
2.2 Upper human body model
element is 12 mm, the distance between each cylindrical
We made the upper human body model for the
element is 3 mm, and the space between the cylindrical
measurement and calculation. As we expected that
element and balun is 10 mm. We put transmitting
electromagnetic waves have the greatest effect on the
antenna on the wireless camera, and the balun was put
head of the operator, we employed the electrical 270
Paper » The Specific Absorption Rate Evaluation of 1.2 GHz Band Wireless Camera by a Thermographic Method
Fig. 3 Wireless camera model (measurement).
Fig. 5 Upper-half body phantom.
Table 3 Composition of the phantom.
Fig. 4 Wireless camera model (calculation).
Table 1 Electrical properties of the human model. (@ 1.27 GHz)
Table 2 Thermal properties of the human model 10).
Fig. 6 Human model (calculation).
properties of the human brain
10) .
The electrical
properties of the human model are shown in Table 1.
calculation model and the measurement model were
Moreover, Table 2 shows the thermal properties
exactly the same and are shown in Fig. 6. In the measurement and calculation of this paper, the
explained in Sec. 2.4. The tissue-equivalent phantom of the upper human
models were not grounded. We consider this model to be
body, which was used in this study, is shown in Fig. 5.
valid because the ground electric current does not flow
Various types of phantoms exist, such as solid, liquid,
through the earth and into the body of the user with the
semi-hard, and gel. In this study, as we considered the
video camera. We consider this to be the same as the
SAR distribution of the model surface, we created the
real-world situation of someone using an actual wireless
semi-hard phantom of the human body (upper-half body
camera.
phantom) and used the thermographic method.
2.3 Experimental setup and method
Compositions of the phantom that correspond to the
As stated previously, in this study, we measured the
electrical properties of the brain are listed in Table
3 10).
SAR using the thermographic method.
The errors of the electric properties between the
The thermographic method was used to measure a
fabricated phantom and reference values of the brain
rise in temperature when a high-power EM wave was
were less than 10 %. Thus, we confirmed the validity of
radiated to the solid phantom, which is electrically
the phantom for this study.
equivalent to tissue, for a short period of time. Then, the
Figure 6 shows the human model used in the
temperature rise of the phantom was converted to the
calculation. We made the model by scanning the upper-
SAR using the following equation (2).
half body phantom. Therefore, the sizes of the 271
ITE Trans. on MTA Vol. 4, No. 3 (2016)
with an electromagnetic shield to prevent the influence
(2)
of the EM wave. where, c is the specific heat of the phantom [J/kg K], ∆T
The microwave signal from the transmitting 1.27 GHz
is the temperature rise [K], and ∆t is the time of the
band antenna was generated by the generator (8753E
radiating EM wave [s].
Hewlett Packard, Palo Alto, California), amplified by the
The experimental setup of the SAR measurement
power amplifier (AS0825-85 Milmega, Isle of Wight,
using the thermographic method is shown in Fig. 7.
U.K.), and input into the transmitting antenna.
Assuming that a 1.2 GHz band wireless camera was
Radiation power from the transmitting antenna, which
being used, we put a wireless camera model with a
was measured using a power meter (NRT Rohde &
transmitting antenna on the right shoulder of the upper-
Schwarz, Munich, Germany), was 79 W. The value of
half body model. The distance between the transmitting
this 79 W has nothing to do with the radiation power of
antenna and the surface of the phantom was 50 mm, as
the real wireless camera. When we use the
shown in Fig. 8. The thermographic camera was covered
thermographic method, we must raise the temperature of the measurement subject surface in a short time. Therefore, as a result of having maximized the radiation power from an amplifier, it became this value. The EM wave was exposed for two minutes, and then we measured the temperature distribution of the phantom surface using a thermographic camera (TVS-200 NEC Avio Infrared Technologies Corporation Ltd., Tokyo, Japan). Then, we set the emissivity of the thermographic camera to 0.84. The temperature rise due to the radiated EM wave was converted to the SAR from eq. (2). 2.4 Calculation model and method For the calculation method, we employed the finitedifference time-domain (FDTD) method. We used a program developed in our laboratory for the calculation of the FDTD method. The calculation conditions are listed in Table 4. In this calculation, we employed the non-uniform mesh model to recreate the details of the transmitting antenna. The minimum cell size was 0.20 × 0.20 × 0.20 mm near the feeding point, which is shown in Fig. 9. We calculated the electrical field distribution and converted it to the SAR with equation (1). The calculation model used in this study is shown in Fig. 9. The sizes, shapes, and positions of the wireless
Fig. 7 Experimental setup.
camera and transmitting antenna were the same as in the measurement setup.
3. Results 3.1 SAR distributions on surface of human body The measured and calculated SAR distributions on the
Table 4 Calculation conditions.
Fig. 8 The distance between transmitting antenna and surface of the phantom.
272
Paper » The Specific Absorption Rate Evaluation of 1.2 GHz Band Wireless Camera by a Thermographic Method
Fig. 9 Calculation model.
Fig. 11 SAR distributions of xz plane.
Fig. 10 SAR distributions of yz plane.
Fig. 12 Observation lines.
surface of the human model in view of the yz and xz planes are shown in Figs. 10 and 11. All distributions were normalized with the maximum value of the
compared the SAR values on the head surface at two
calculated result. These results show that the SAR
lines between the measurement and calculation
distributions between the measurement and calculation
quantitatively. As shown in Fig. 12, the lines pass
were fairly consistent, and the elevation of the SAR was
through the right occipital, which indicates a high SAR
observed at the right occipital of the phantom (around y
area. Figure 13 shows that the SAR values of the
= 0 mm and z = 350 mm in Fig. 10, around x = 120 mm
measured and calculated results on the head surface at
and z = 350 mm in Fig. 11). This region is close to the
the observation lines. These figures show that the SAR
transmitting antenna on the wireless camera.
values on both of the lines are nearly identical between
3.2 SAR profiles on the observation line
the measured and calculated results. However, the peak
To assess the validity of our measurement, we
value is different. We believe that the cause of this is the 273
ITE Trans. on MTA Vol. 4, No. 3 (2016)
Fig. 14 Differences of the observation point.
result. We consider that this is due to the position of the thermographic camera in the experimental setup of the SAR measurement. Upon measuring the whole upper body phantom from the just side, we defined the line which tied up both shoulders as the position of the just side of the upper body phantom, as shown in Fig. 14(a). Therefore, the camera looks from slightly behind the head. In addition, in the measurement by the thermographic camera, because of the short distance between the phantom and the camera, the position and the difference of the angle cause a gap of the observation side (Fig. 14(a)). In contrast, because we calculated the SAR distribution looking from the infinity of the x-axis
Fig. 13 SAR profiles on the observation lines.
direction of the calculation model, there is no difference difference in the SAR calculation method between the
of the calculation result by the difference of the
measurement and the calculation. In the calculation, all
observation position such as the measurement (Fig.
the
absorbed
14(b)). Therefore, it is considered that some differences
electromagnetic wave by the upper-half body phantom is
between the measurement result and the calculation
converted to the SAR. By contrast, in the measurement,
result occur.
electromagnetic
energy
of
the
the temperature rise value is converted to the SAR.
3.3 Discussion of SAR peak point
Even if the temperature rises locally, it is difficult to
We calculated the electric current distribution and
capture the sudden difference of the temperature
electric field distribution on the surface of the wireless
because of the thermal diffusion to the material of the
camera to discuss the cause of SAR elevation around the
circumference. Therefore, the peak SAR value of the
head of the operator. Figure 15 shows the observation
measurement is lower than the calculation value.
plane, which is the surface of the wireless camera model
Additionally, we believe that another cause is that the
on the side of the human body. The electric current
more locally SAR value was calculated by cell size being
distribution on the observation plane is shown in Fig.
subdivided in the calculation model near the
16, and the electric field (r.m.s) distribution on the same
transmitting antenna. As previously stated, we believe
plane is shown in Fig. 17(a). In Figs. 16 and 17, the
that the comparison of the rise range and the rise value
maximum levels of the electric current and electric field
of the SAR are more important in confirming the
are the value on the transmitting antenna and are 0 dB
validity of the measurement result than the comparison
points. Figure 16 shows an electric current that occurred
of the peak value. Therefore, the validity of this
via an EM wave emitted from the transmitting antenna
measured result was confirmed, and we found that it
near the right ear (around y = –30 mm and z = 350 mm
was possible to measure the SAR distribution and the
in Fig. 16). With this result, it is possible to say that the
SAR elevation areas using this measurement method.
wireless camera body was the ground plane for the
As shown in Fig. 13, there is a roughly 20 mm gap in
transmitting antenna. Comparing Figs. 16 and 17(a), the
the graph of the measurement result and the calculation
peak points of the electric field distribution and the 274
Paper » The Specific Absorption Rate Evaluation of 1.2 GHz Band Wireless Camera by a Thermographic Method
electric current distribution on the surface of the wireless camera model were almost at the same position. Moreover, Fig. 17(b) shows the electric field distribution on the same plane without the camera model. Comparing Figs. 17(a) and (b), both electric fields near the right ear (around y = –30 mm and z = 350 mm in Fig. 17(a)) were different whether or not the camera model was there. The electric field near the right ear of Fig. 17(a) is lower, about 6.4 dB, than Fig. 17(b). In this calculation model, the human body model and the
Fig. 15 Observation plane of calculation model.
wireless camera model were not connected, but the space between both models was very close to 1mm. Therefore, we ascertained that the SAR value near the right ear was elevated because of the influence of the electric field which occurred via the electric current on the surface of the camera model. However, the absolute value of this electric field was lower, by about 36.5 dB, than the electric field that occurred through the transmitting antenna was.
4. Conclusion In this paper, assuming that a 1.2 GHz band wireless Fig. 16 The electric current distribution on the wireless camera
camera was used, we evaluated the amount of
model.
electromagnetic exposure of operators when using the wireless camera. The measured and the calculated SAR distributions using the tissue-equivalent semi-hard phantom were nearly identical. Therefore, we found that it was possible to measure the SAR distribution and the SAR elevation areas using this measurement method. Regarding the results of the calculation of electric current and electric field distribution on the wireless camera model, a slight electric current was shown to be near the right ear, and the electric field occurred near this electric current. Therefore, it was ascertained that not only was the microwave energy emitted from the transmitting antenna but also the electric current on the surface of the wireless camera model was related to the SAR elevation.
References 1) "Portable OFDM digital transmission system for television program contribution," ARIB STD-B33, ver. 1.1 (Nov. 2005) 2) Frequency reorganization action plan by Ministry of Internal Affairs and Communications (Oct. 2013. revised ver) 3) Example of wireless camera: Sony HDC1500, http://broadcastrf. com/sony-hdc1500 4) Osamu Fujiwara, Takahiro Joukou, Jianqing Wang: "Dosimetry analysis and safety evaluation of realistic head models for portable telephones," IEICE Transactions on Communications, J83-B, 5, pp.720-725 (May 2000) Fig. 17 The electric field distributions.
275
ITE Trans. on MTA Vol. 4, No. 3 (2016)
Koichi Ito
5) Naohiko Iai, Hidekazu Murata, Hidenori Ishida, Masanobu Iwamoto, Toshiharu Morizumi, Masayoshi Onishi, Toshihiro Ishida, Kazuyuki Saito, Junichi Ota, Masanori Hattori, Minoru Okada, Hiroyuki Takesue, Hitoshi Yanagisawa, Shinichi Nishizawa, Tomomi Hukazawa, Yukihiro Koike, Tsukuru Kai: "Research and development trend of the broadcast technology (broadcasting format / radio, light transmitting technology / broadcast work-site operations)," ITE Technical Report, 69, 7, pp.733-751 (2015) 6) Naoto Kogo and Tetsuomi Ikeda: "Analysis of radiation pattern and SAR considering operation of wireless camera in 1.2 and 2.3 GHz Bands," ITE Technical Report, 37, 23, pp.29-32 (June 2013) 7) V. Hombach, K. Meier, M. Burkhardt, E. Kühn and N. Kuster, "The dependence of EM energy absorption upon human head modeling at 900 MHz," IEEE Trans. Microwave Theo. Tech., 44, 10, pp.18651873 (Oct. 1996) 8) A.W. Guy, "Analysis of electromagnetic fields induced in biological tissues by the thermographic studies on equivalent phantom models," IEEE Trans. Microwave Theory Tech., 34, 6, pp.671-680 (June 1986) 9) Specifications and figure of wireless camera: Sony HDW-650, http://www.sony.jp/products/catalog/SPC_HDW-650.pdf 10) Koichi Ito and Katsumi Furuya and Yoshinobu Okano and Lira Hamada: "Development and the characteristics of a biological tissue-equivalent phantom for microwaves," IEICE, J81-B-II, 12, pp.1126-1135 (Dec. 1998) (in Japanese)
received the B.S. and M.S. degrees from Chiba University, Japan, and the D.E. degree from the Tokyo Institute of Technology, Japan. From 1976 to 1979, he was a Research Associate at the Tokyo Institute of Technology. From 1979 to 1989, he was a Research Associate at Chiba University. From 1989 to 1997, he was an Associate Professor at Chiba University, and from 1997 to 2016, he was a Professor at Chiba University. He is currently a Visiting Professor at the Center for Frontier Medical Engineering, Chiba University. From 2005 to 2009, he was Deputy Vice-President for Research, Chiba University. From 2009 to 2015, he served as Director of the Center for Frontier Medical Engineering, Chiba University. In 1989, 1994, and 1998, he visited the University of Rennes I, France, as an Invited Professor. He has been appointed as Adjunct Professor to the University of Indonesia since 2010. His main research interests include small antennas for mobile communications, research on evaluation of the interaction between electromagnetic fields and the human body by use of phantoms, microwave antennas for medical applications, and antenna systems for body-centric wireless communications. Professor Ito is a Life Fellow of the IEEE, Fellow of the IEICE and a member of the Japanese Society for Thermal Medicine. He served as Chair of the Technical Committee on Human Phantoms for Electromagnetics, IEICE, from 1998 to 2006, Chair of the Technical Committee on Antennas and Propagation, IEICE, from 2009 to 2011, Chair of the IEEE AP-S Japan Chapter from 2001 to 2002, General Chair of iWAT2008, an AdCom member for the IEEE AP-S from 2007 to 2009, an Associate Editor for the IEEE Transactions on AP from 2004 to 2010, a Distinguished Lecturer for the IEEE AP-S from 2007 to 2011, General Chair of ISAP2012 and a member of the Board of Directors, BEMS, from 2010 to 2013. He currently serves as a Councilor to the Asian Society of Hyperthermic Oncology. He has been elected as a delegate to the European Association on Antennas and Propagation (EurAAP) since 2012 and Chair of Commission K, Japan National Committee of URSI since 2015.
Tetsuya Yoshida received the B.E. and M.E. degrees in medical system engineering from Chiba University, Chiba, Japan, in 2014 and 2016, respectively. He currently works for Sony Energy Devices Corporation. His research interests include interaction between electromagnetic wave and human body. He received the ITE Best Presentation Award in 2014. Kazuyuki Saito
received the B.E., M.E. and D.E. degrees all in electronic engineering from Chiba University, Chiba, Japan, in 1996, 1998 and 2001, respectively. He is currently an Associate Professor with the Center for Frontier Medical Engineering, Chiba University. His main interest is in the area of medical applications of the microwaves including the microwave hyperthermia. He received the IEICE AP-S Freshman Award, the Award for Young Scientist of URSI General Assembly, the IEEE AP-S Japan Chapter Young Engineer Award, the Young Researchers' Award of IEICE, the International Symposium on Antennas and Propagation (ISAP) Paper Award, and Young Investigator Award of the Japanese Society for Thermal Medicine in 1997, 1999, 2000, 2004, 2005, and 2012 respectively. Dr. Saito is a member of IEICE, IEEE, JSTM (Japanese Society for Thermal Medicine) and JSES (Japan Society for Endoscopic Surgery).
Masaharu Takahashi received the B.E. degree in electrical engineering from Tohoku University, Miyagi, Japan, in 1989, and the M.E. and D.E. degrees in electrical engineering from the Tokyo Institute of Technology, Tokyo, Japan, in 1991 and 1994, respectively. From 1994 to 1996, he was a Research Associate, and from 1996 to 2000, an Assistant Professor with the Musashi Institute of Technology, Tokyo, Japan. From 2000 to 2004, he was an Associate Professor with the Tokyo University of Agriculture and Technology, Tokyo, Japan. He is currently an Associate Professor with the Center for Frontier Medical Engineering, Chiba University, Chiba, Japan. His main interests are electrically small antennas, planar array antennas, and EM compatibility. He was the recipient of the 1994 IEEE Antennas and Propagation Society (IEEE AP-S) Tokyo Chapter Young Engineer Award.
276