The Smart Beta (R)evolution While of recent invention, the catch phrase “Smart Beta” represents an extension or evolution of “quantitative investment” techniques of decades-old lineage. The revolutionary movement lies in Smart Beta’s democratization of these techniques and making them transparent to investors.
Second Quarter 2016 DoubleLine Cross-Asset Allocation Team Jeffrey Sherman, CFA, Portfolio Manager Eric Dhall Samuel Lau Jeffrey Mayberry
333 S. Grand Ave., 18th Floor || Los Angeles, CA 90071 || (213) 633-8200
The Smart Beta (R)evolution While of recent invention, the catch phrase “Smart Beta” represents an extension or evolution of “quantitative investment” techniques of decades-old lineage. The revolutionary movement lies in Smart Beta’s democratization of these techniques and making them transparent to investors. By way of metaphor, consider the smart phone. When smart phones were introduced, they brought together pre-existing technologies. Rather than inventing the cellular telephone, the calculator, the digital music player, the digital camera, e-mail or GPS navigation, smart phones packaged these devices and applications together in one easy-to-use device. In a similar vein, Smart Beta repackaged known return sources and risk premia within the investment community. For decades under the guise of “quantitative asset management,” investment managers sold financial products based on these return sources and risk premia. However, these managers used black box techniques, keeping their investment strategies and methodologies opaque and unknown to those outside of their firms. This opacity allowed managers to charge high fees at investors’ expense. Smart Beta has revolutionized the industry by making investment methodologies transparent, providing investors a clear view into what risk factors they are accessing, and lowering investors’ costs.
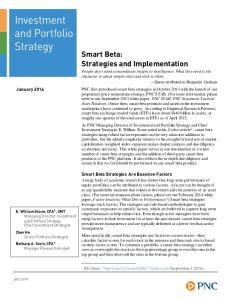
Figure 1: Total Assets in Smart Beta
The approach is threefold: to define Smart Beta, trace the history of its evolution and describe five investable Smart Beta indices that we believe merit close attention. The intention is to help explain how advisors and their clients can harness the Smart Beta “(R)evolution” in order to help achieve their investment objectives. What is Smart Beta? There are many different ways of defining Smart Beta, but let’s leave the theoretical distinction discussion to the Ph.D.s and focus on what may be more relevant to investors. Beta (β) is the degree to which the pricing of an asset or security moves in relation to a given market. Passive beta investing traditionally has been understood as sourcing exposure to a given market via a market capitalization-weighted strategy. Smart Beta is a passive weighting scheme that deviates from market capitalization. Smart Beta weighting schemes can vary from the simple – such as equal-weighting of each security in a given market – to more complex and mathematically intensive techniques such as minimum variance, risk parity or maximum diversification weighting. Whatever the chosen method, all Smart Beta strategies share a key characteristic: complete transparency to the risk factors in each strategy. In passing, some detractors have objected to the adjective “smart” in Smart Beta as a marketing gimmick with the potential to mislead investors into believing that Smart Beta products are better than “dumb beta” products such as index funds. We disagree with this assessment. In our view, each investor’s objectives are different and thus what is “smart” to one investor could be perceived as “dumb” to another. That said, rather than “Smart Beta,” we would prefer more labels describing the risk premia at issue in a given strategy or product. However, “Smart Beta” seems to have embedded itself as a durable convention in the financial lexicon. So we will continue to use the phrase, having established its meaning for purposes of this briefing. 2
Source: Johnson
6-2016 Smart Beta Revolution
The Smart Beta (R)evolution History of Smart Beta The origins of Smart Beta can be traced to academic foundations of Modern Portfolio Theory (MPT): three papers published in the 1950s and 1960s (see Figure 2). Reprising our metaphor, these papers were to Smart Beta what the car phone was to the smart phone. Introduced in the United States in 1946, the first car phones required huge batteries and long antennas. Some were even installed in cars’ center consoles. Equipment and service were expensive; for years, coverage was unavailable in most areas of the United States. Despite these limitations, car phones began to address the need for telecommunications mobility and convenience by post-war America’s increasingly mobile population. More than a half century later, that role would be fulfilled by today’s ubiquitous smart phones. The keystone for Smart Beta was “Portfolio Selection,” the seminal paper by Harry Markowitz in 1952. Markowitz showed that construction of an optimal portfolio meant balancing return and risk and Modern Portfolio Theory was born. This framework detailed how an efficient portfolio could be formed to maximize return for a given level of risk. In 1964, William Sharpe set the second major building block with his paper “Capital Asset Prices: A Theory of Market Equilibrium under Conditions of Risk,” the basis for the well-known capital asset pricing model (CAPM). The CAPM states that the expected return of an asset is proportional to its beta (β), the relation of the asset’s price movement with the movement of the market. Thus, beta is the concept of broad market risk. In 1968, Michael Jensen set the third major building block with his paper, “Problems in the Selection of Security Portfolios: The Performance of Mutual Funds in the period 1945-1964.” In empirical testing of the CAPM, Jensen found that mutual fund performance could not be fully explained by CAPM. He named this unexplained source of return alpha (α). Ever since, alpha has become the Holy Grail of asset management – or at least of active asset management.
Figure 2: Timeline of Major Smart Beta Milestones 1952 - Markowitz on Variance Mean Varian Optimization Maximize return for given level of risk 1964 - Sharpe on CAPM Capital Asset Pricing Model Concept of broad market risk—Beta 1968 - Jensen on Alpha and Beta Mutual fund performance was not wholly explained by CAPM Unexplainable return was called alpha 1992 - Fama/French on Additional Risk Premia Capitalization bias—Smaller companies outperform larger ones Valuation bias—Value stocks outperform richly valued stocks 1993 - Jegadeesh/Titman on Momentum Stocks that had outperformed over trailing twelve months tended to earn more that stocks that had less than stellar performance. 1900s to 2000s - More Risk Premia Introduced Liquidity Low Volatility Quality minus Junk Betting against Beta Source: DoubleLine Capital
Smart Beta took a leap forward in 1992 when Eugene Fama and Kenneth French amalgamated two decades of purported return anomalies as additional risk premia in excess to market beta in their paper, “The Cross-Section of Expected Stock Returns.” They isolated two factors which offered the greatest explanatory power of returns from 1941-1990: capitalization bias and valuation bias. The capitalization bias showed that smaller companies, as gauged by market capitalization, tended to outperform larger companies over the long term. The valuation bias showed that relatively cheap companies based on higher book-to-market value 3 6-2016 Smart Beta Revolution
The Smart Beta (R)evolution tended to outperform relatively expensive companies as indicated by lower book-to-market value. In 1993, Narasimhan Jegadeesh and Sheridan Titman identified momentum as a third persistent risk premium. Their paper, “Returns to Buying Winners and Selling Losers: Implications for Stock Market Efficiency,” showed that stocks which had outperformed over the previous 12 months tended to perform better over the next month than did stocks which had not performed as well over the previous 12 months. Thus in the case of an actively managed portfolio, the three risk premia of valuation, capitalization and momentum, plus the market factor (beta), can be used to decompose the sources of historical returns and isolate the “true alpha” – in other words, identify the manager’s skill after controlling for these known risk premia (see Figure 3). In subsequent studies, researchers have claimed to identify other risk premia, including liquidity, (low) volatility and quality. It remains to be seen whether these additional risk premia will gain wide acceptance in the investment community going forward. The jury is still out, pending evidence on whether these premia exhibit statistically significant outperformance out-of-sample. Why Smart Beta? Now that we have a basic understanding of the origins of Smart Beta, the pragmatic question is posed: “Why invest in Smart Beta?” Just like smart phones, Smart Beta can offer desirable attributes of portfolio management in a neat and tidy package. Smart phones package a multitude of applications together into a device that is greater than the sum of its parts. If packaged correctly, Smart Beta can combine investments in a way that is greater than the sum of the individual ideas. Using a systematic approach, Smart Beta is a way that investors can increase their expected return while maintaining similar levels of risk entailed in a market capitalization-weighted portfolio. Smart Beta strategies work best if they maintain the advantages
Figure 3: Portfolio Return Decomposition
Source: DoubleLine Capital
of investing in a market capitalization-weighted portfolio (market exposure coupled with lower management fees and lower trading costs than active management) while providing a benefit to investors (higher returns and/or lower risk than active management). Market capitalization-weighted portfolios are, by definition, the market. They are consistent in process, have virtually unlimited capacity to absorb client assets without hurting investment performance and have minimal turnover, all of which benefit buy-and-hold investors. Furthermore, market capitalization-weighted passive index funds, futures and ETFs*, or some mix of these instruments, provide some of the cheapest ways for investors to gain market exposure. Most active fund managers are not running market capitalization portfolios. Those that do certainly charge higher fees than required for their “active management.” This has led the investing public to be disappointed with active equity management. This is especially the case in the large-capitalization space where the quantity and quality of informed investors are the highest, making the market relatively efficient. Advisors and investors should understand whether their active manager is, intentionally or unwittingly, exposing the portfolio to the aforementioned known risk premia. Our view is that it makes sense to either a) invest in these known risk premia using a Smart 4
* ETFs = exchange-traded funds
6-2016 Smart Beta Revolution
The Smart Beta (R)evolution Beta product at a lower cost than an active product, or b) invest in a truly active product that provides “alpha” outside of these known risk premia. Which Smart Beta? As every consumer today knows, not all smart phones are equal. Consumers have to research carefully which operating system and combination of functions are best suited for their needs before buying a phone or they risk being stuck with a nonoptimal experience based on marketing hype. The same holds true for Smart Beta products. Advisors and investors need to research carefully which offerings best suit their needs before investing. The process can be arduous because Smart Beta products span the risk premia universe and can employ multiple exposures. To assist in this process, we believe evaluating Smart Beta strategies on three key attributes: differentiation, scalability and implementation. Differentiation: A valuable Smart Beta strategy should have an incremental source of alpha that is in excess of widely identified risk premia such as value, market capitalization, momentum and market factor (beta). A Smart Beta strategy with exposure to multiple factors should be beneficial as investors are able to collect the risk premia over a full market cycle. Scalability: As any strategy increases assets, the opportunity set shrinks as more dollars chase the same available alpha pool. It is important to identify and understand the opportunity set targeted by each Smart Beta strategy. Strategies that invest in less liquid or smaller capitalization portions of markets could see alpha fall or disappear as assets increase. Implementation: Not all ideas that appear attractive in academia are economically viable in the real world. Transaction costs, liquidity, market access, bid-ask spread and taxation are among the mundane realities that can impair
performance of a strategy that heretofore has lived only in a financial model. DoubleLine has analyzed dozens of Smart Beta indices, five of which we have singled out for further analysis based on a combination of return and risk metrics along with total assets invested in each strategy: Shiller Barclays CAPE® US Sector Index, S&P 500 Equal Weighted Index, S&P 500 Low Volatility Index, FTSE RAFI US 1000 Index and Russell 1000 Equal Weight Index. The analysis of these indices compared to the widely used risk factors is on the following page (Figure 4). Each of the indices in Figure 4 generated alpha in excess of what would be expected given the risk factors over the 13-year period ended June 30, 2016, albeit not all are statistically significant. Each index’s coefficients for these risk factors can help serve as guides to help differentiate among the indices and form ideas on the suitability of this set or subset with respect to meeting investor needs. Given the aforementioned discussion, most investors would desire an index with the following attributes: Beta: β close to 1 to reduce tracking error to the market; Scalability: exposure to large-capitalization stocks as these trade in the heavy volumes required for scalability (a size (SMB) factor as seen in figure 4 of less than zero denotes exposure to largercapitalization stocks while an SMB factor of greater than zero denotes exposure to smallercapitalization stocks); Alpha: α in excess of the market (β), size (SMB), value (HML) and momentum (UMD) premia. Using the above criteria one can eliminate some of the indices and arrive at a straightforward conclusion. For example, applying beta as a screening criterion, an advisor or investor seeking broad exposure to the stock market would eliminate the S&P 500 Low 5 6-2016 Smart Beta Revolution
The Smart Beta (R)evolution Volatility Index due to its beta being significantly lower than 1. Further, equal weighting the holdings in an index will necessarily overweight the smaller capitalization stocks while underweighting the larger capitalization stocks compared to a market capitalization-weighted index. Therefore under the scalability test, the same investor would eliminate both the S&P 500 Equal Weighted Index and the Russell 1000 Equal Weighted Index due to their small capitalization bias and therefore liquidity. Recall that the liquidity of an equally weighted index is determined by the smallest market capitalization stock in the index since all receive the same amount of capital. Investors would also likely eliminate the FTSE RAFI U.S. 1000 Index given its high exposure to the value premium (with a HML factor of 0.28), which an investor can access at a lower price via an index product for the same premium. The FTSE RAFI U.S. 1000 also has the lowest factor adjusted alpha
of the five Smart Beta products in the comparison. The one Smart Beta index which meets all three key attributes is the Shiller Barclays CAPE® US Sector Index. In addition to having provided the highest alpha in excess of the risk premia among the five indices in the sample below over the 13-year period ended March 31, 2016, the Shiller Barclays CAPE® US Sector Index has a beta close to 1 (β=0.94), a bias toward largecapitalization stocks (SMB=-0.14) and no value premium exposure (HML=-0.01). The index also exhibited a positive momentum bias (UMD=0.04) over the study period, whereas most traditional value strategies exhibit negative price momentum.
Figure 4: Most Smart Beta Indices Provide Exposure to Risk Factors Regression Coefficient using Fama-French and Momentum Framework September 30, 2002— June 30, 2016 Shiller Barclays CAPE U.S. Sector TR Index
Russell 1000 S&P 500 Equal S&P 500 Low FTSE RAFI Equal Weight S&P 500 TR Weighted TR Volatility TR U.S. 1000 TR Total Return Index Index Index Index Index
3.82%**
1.59%*
3.29%*
0.85%
3.03%**
NA
Market - Risk Free (Classic β)
0.94**
1.05**
0.73**
1.00**
1.01**
1.00**
Size (SMB)
-0.14**
0.07**
-0.19**
-0.04**
0.18**
-0.15**
-0.01
0.09**
-0.04**
0.28**
0.08**
0.00
0.04**
-0.10**
0.09**
-0.07**
-0.07**
0.00**
Intercept (α)
Value (HML)
Momentum (UMD)
* = t-stat significant at 95% level ** = t-stat significant at 99% level, Daily Data, Alpha Annualized using 252 Day Year Source: DoubleLine Capital, Kenneth French http://mba.tuck.dartmouth.edu/pages/faculty/ken.french/data_library.html Mkt-RF “Market minus Risk-Free Rate” – The return on a region's value-weight market portfolio minus the U.S. 1-month T-bill rate. SMB “Small minus Big” – The equal-weight average of the returns on the three small stock portfolios for the region minus the average of the returns on the three big stock portfolios HML “High Book Value minus Low Book Value” – The equal-weight average of the returns for the two high B/M portfolios for a region minus the average of the returns for the two low B/M portfolios. UMD “Up minus Down” – Average return of the highest return large cap sextile and small cap sextile minus average return of the lowest return large cap sextile and small cap sextile. Momentum - The rate of acceleration of a security's price or volume. The idea of momentum in securities is that their price is more likely to keep moving in the same 6 direction than to change directions. 6-2016 Smart Beta Revolution Regression analysis performed in excess return space.
The Smart Beta (R)evolution Conclusion Smart phones have revolutionized the way people communicate while offering a simple, accessible package that gives people a device that is greater than the sum of its parts. In a similar way, the evolution of Smart Beta has the potential to revolutionize the way investors gain exposure to equity markets. Following in the wave of academic research and empirical findings over the last six decades, assets continue to flow into Smart Beta products. The investment management industry is expected to roll out more competing choices in the space. Caveat emptor: not all Smart Beta is created equal. It makes sense for advisors to develop frameworks for evaluating these strategies. Professional intermediaries need to understand whether indices or products under consideration truly add incremental sources of return or merely expose clients to the aforementioned, widely known risk premia. It is also important to understand the scalability of such investment options to ensure performance does not suffer as a chosen strategy increases assets under management. While we at DoubleLine believe the Shiller Barclays CAPE® US Sector Index is an attractive option in the Smart Beta universe, we are happy to run comparative analyses on other Smart Beta indices as part of our conversations with advisors and their clients. If you have any questions, our team can be reached at
[email protected].
7 6-2016 Smart Beta Revolution
The Smart Beta (R)evolution Authors Jeffrey J. Sherman, CFA Portfolio Manager, Macro-Asset Allocation Mr. Sherman joined DoubleLine in 2009. He is also a member of the Fixed Income Asset Allocation Committee and a portfolio manager for derivative-based and multi-asset strategies. Prior to DoubleLine, he was a Senior Vice President at TCW where he worked as a portfolio manager and quantitative analyst focused on fixed income and real-asset portfolios. Mr. Sherman assisted in developing real-asset strategies for TCW and was a portfolio manager overseeing several commodity funds. Prior to TCW, he was a statistics and mathematics instructor at both the University of the Pacific and Florida State University. Mr. Sherman holds a BS in Applied Mathematics from the University of the Pacific and a MS in Financial Engineering from the Claremont Graduate University. He is a CFA charterholder.
Eric S. Dhall Quantitative Analyst, Macro-Asset Allocation Mr. Dhall joined DoubleLine in 2013 as an analyst specializing in macro themes. In 2012 he was an intern at DoubleLine and also worked previously at the Capital Group. Prior to this he worked in international finance at Gulf Machinery Company. Mr. Dhall graduated from the University of California, Berkeley where he majored in Physics and achieved a secondary emphasis in business. He also holds a Masters of Financial Engineering from the UCLA Anderson School of Management, where he was an instructor in Finance. He attended the University of California, Los Angeles as a PhD candidate in Applied Physics/Engineering Physics.
Samuel C.Y. Lau Macro-Asset Allocation Mr. Lau joined DoubleLine in 2009. He works in portfolio management and trading for derivatives-based and multi-asset strategies. Prior to DoubleLine, he was a Vice President at TCW where he worked as a research analyst in the Mortgage Group. Mr. Lau holds a BS from the University of Wisconsin, Madison as well as an MBA from the Marshall School of Business at the University of Southern California.
Jeffrey M. Mayberry Macro-Asset Allocation Mr. Mayberry works in portfolio management and trading for derivatives-based and multi-asset strategies. He joined DoubleLine in 2009 where he oversaw portfolio analytics, risk management and the development of portfolio management systems. Prior to DoubleLine, he was a Senior Vice President at TCW where he worked for nine years. Mr. Mayberry worked in the Mortgage Group, specializing in systems monitoring and development. He developed “real-time” asset and liability valuations for the Mortgage Group’s portfolio and fund monitoring systems, and was responsible for all day-to-day operations of the Mortgage Group’s database systems and analytics. Mr. Mayberry holds a BS in Engineering from Harvey Mudd College and an MS in Financial Engineering from the Peter F. Drucker Graduate School of Management at Claremont Graduate University.
8 6-2016 Smart Beta Revolution
Disclaimers Bibliography Bunn, Oliver and Robert Shiller. "Changing Times, Changing Values: A Historical Analysis of Sectors within the US Stock Market 1872 - 2013." Yale University Working Paper (2012). Bunn, Oliver, et al. "Es-cape-ing from Overvalued Sectors: Sector Selection Based on the Cyclically Adjusted Price-Earnings (CAPE) Ratio." Journal of Portfolio Management (2014): 16-33. Fama, Eugene F. and Kenneth R. French. "The Cross Section of Expected Stock Returns." The Journal of Finance (1992): 427465.
Jegadeesh, Narasimhan and Sheridan Titman. "Returns to Buying Winners and Selling Losers: Implications for Stock Market Efficiency." The Journal of Finance (1993): 65-91. Jensen, Michael C. "The Performance of Mutual Funds in the Period 1945-1964." The Journal of Finance (1968): 389-416. Johnson, Ben. "A Sensible Approach to 'Smart Beta'." Morningstar Magazine (2014). Markowitz, Harry. "Portfolio Selection." The Journal of Finance (1952): 77-91. Sharpe, William F. "Capital Asset Prices: A Theory of Market Equilibrium under Conditions of Risk." The Journal of Finance (1964): 425-442.
Definitions FTSE RAFI U.S. 1000 Index - An index designed to track the performance of the largest U.S. equities, selected based on the following four fundamental measures of firm size: book value, cash flow, sales and dividends. The 1000 equities with the highest fundamental strength are weighted by their fundamental scores. Shiller Barclays CAPE® US Sector Index - An index that takes a long position in 4 favored sectors that are undervalued and possess relatively stronger price momentum over the past 12 months. Each month, the index ranks the 10 U.S. sectors based on modified CAPE® ratio and 12-month price momentum, equally allocating across the top 4 ranked sectors. S&P 500 Equal Weighted Index - The equal-weighted version of the S&P 500. Each company included in the index is allocated a fixed weight—or 0.2% of the index total at each quarterly rebalance. S&P 500 Low Volatility Index - An index that measures performance of the 100 least volatile stocks in the S&P 500. The index benchmarks low volatility or low variance strategies for the U.S. Stock Market. Russell 1000 Equal Weight Index - An index that measures the performance of the U.S. large cap equity market. Tracking Error - A divergence between the price behavior of a position or a portfolio and the price behavior of a benchmark. This is often in the context of a hedge or mutual fund that did not work as effectively as intended, creating an unexpected profit or loss instead.
9 6-2016 Smart Beta Revolution
Disclaimers Important Information Regarding This Report This report was prepared as a private communication and was not intended for public circulation. Clients or prospects may authorize distribution to their consultants or other agents. Issue selection processes and tools illustrated throughout this presentation are samples and may be modified periodically. Such charts are not the only tools used by the investment teams, are extremely sophisticated, may not always produce the intended results and are not intended for use by nonprofessionals. DoubleLine has no obligation to provide revised assessments in the event of changed circumstances. While we have gathered this information from sources believed to be reliable, DoubleLine cannot guarantee the accuracy of the information provided. Securities discussed are not recommendations and are presented as examples of issue selection or portfolio management processes. They have been picked for comparison or illustration purposes only. No security presented within is either offered for sale or purchase. DoubleLine reserves the right to change its investment perspective and outlook without notice as market conditions dictate or as additional information becomes available. This material may include statements that constitute “forward-looking statements” under the U.S. securities laws. Forward-looking statements include, among other things, projections, estimates, and information about possible or future results related to a client’s account, or market or regulatory developments. Important Information Regarding Risk Factors Investment strategies may not achieve the desired results due to implementation lag, other timing factors, portfolio management decision-making, economic or market conditions or other unanticipated factors. The views and forecasts expressed in this material are as of the date indicated, are subject to change without notice, may not come to pass and do not represent a recommendation or offer of any particular security, strategy, or investment. All investments involve risks. Please request a copy of DoubleLine’s Form ADV Part 2A to review the material risks involved in DoubleLine’s strategies. Past performance is no guarantee of future results. Important Information Regarding DoubleLine In preparing the client reports (and in managing the portfolios), DoubleLine and its vendors price separate account portfolio securities using various sources, including independent pricing services and fair value processes such as benchmarking. To receive a complimentary copy of DoubleLine Capital’s current Form ADV (which contains important additional disclosure information, including risk disclosures), a copy of the DoubleLine’s proxy voting policies and procedures, or to obtain additional information on DoubleLine’s proxy voting decisions, please contact DoubleLine’s Client Services. Important Information Regarding DoubleLine’s Investment Style DoubleLine seeks to maximize investment results consistent with our interpretation of client guidelines and investment mandate. While DoubleLine seeks to maximize returns for our clients consistent with guidelines, DoubleLine cannot guarantee that DoubleLine will outperform a client's specified benchmark or the market or that DoubleLine’s risk management techniques will successfully mitigate losses. Additionally, the nature of portfolio diversification implies that certain holdings and sectors in a client's portfolio may be rising in price while others are falling; or, that some issues and sectors are outperforming while others are underperforming. Such out or underperformance can be the result of many factors, such as but not limited to duration/interest rate exposure, yield curve exposure, bond sector exposure, or news or rumors specific to a single name. DoubleLine is an active manager and will adjust the composition of client’s portfolios consistent with our investment team’s judgment concerning market conditions and any particular sector or security. The construction of DoubleLine portfolios may differ substantially from the construction of any of a variety of market indices. As such, a DoubleLine portfolio has the potential to underperform or outperform a bond market index. Since markets can remain inefficiently priced for long periods, DoubleLine’s performance is properly assessed over a full multi-year market cycle. Important Information Regarding Client Responsibilities Clients are requested to carefully review all portfolio holdings and strategies, including by comparing the custodial statement to any statements received from DoubleLine. Clients should promptly inform DoubleLine of any potential or perceived policy or guideline inconsistencies. In particular, DoubleLine understands that guideline enabling language is subject to interpretation and DoubleLine strongly encourages clients to express any contrasting interpretation as soon as practical. Clients are also requested to notify DoubleLine of any updates to Client’s organization, such as (but not limited to) adding affiliates (including broker dealer affiliates), issuing additional securities, name changes, mergers or other alterations to Client’s legal structure. DoubleLine Group is not a registered investment adviser with the Securities Exchange Commission (SEC). DoubleLine® is a registered trademark of DoubleLine Capital LP. © 2015 DoubleLine Capital LP
10 6-2016 Smart Beta Revolution