The Role of Automation in Undergraduate Computer Science Education Chris Wilcox Computer Science Colorado State University 1873 Campus Delivery Fort Collins, Colorado 80523
[email protected] 300
ABSTRACT
Categories and Subject Descriptors K.3.2 [Computers and Education]: Computer and Information Science Education; K.3.1 [Computer Uses in Education]: Computer-assisted instruction
Keywords automated assessment; automated grading; peer instruction
1.
INTRODUCTION
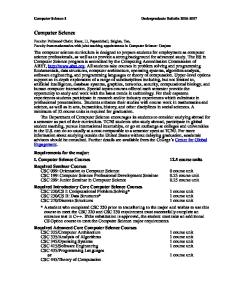
The number of students choosing a computer science major is growing rapidly, boosting enrollments at colleges and universities throughout North America. A report from the Computing Research Association shows that from 2009 to 2014 the number of bachelors degrees (combined computer science and computer engineering) awarded increased from fewer than 9,000 to more than 16,000 [1]. Figure 1 shows the enrollment in our introductory programming course, which mirrors this trend with 55% growth in students (157 to 243) that are majoring or taking the course over approximately the same period. The number of high school students comPermission to make digital or hard copies of all or part of this work for personal or classroom use is granted without fee provided that copies are not made or distributed for profit or commercial advantage and that copies bear this notice and the full citation on the first page. Copyrights for components of this work owned by others than ACM must be honored. Abstracting with credit is permitted. To copy otherwise, or republish, to post on servers or to redistribute to lists, requires prior specific permission and/or a fee. Request permissions from
[email protected]. SIGCSE’15, March 4–7, 2015, Kansas City, MO, USA. c 2015 ACM 978-1-4503-2966-8/15/03 ...$15.00. Copyright http://dx.doi.org/10.1145/2676723.2677226.
250 Enrollment
Increasing enrollments in undergraduate computer science courses are overloading faculty, teaching assistants, labs, and other resources. To cope with resource problems, many universities have automated key processes such as program grading. Before replacing a manual process with an automated tool, we believe that two questions should be answered. First and most importantly, does the proposed automation contribute to or detract from student learning? Second, do the benefits outweigh the costs of the automation? In this paper we present results from an introductory programming course in which we have incorporated high levels of automation. We find that carefully designed and managed automation can improve student performance while realizing a significant savings of scarce teaching resources.
200 150 100 50 0 Spring 2010
Fall 2010
Spring 2011
Fall 2011
Spring 2012
Fall 2012
Spring 2013
Fall 2013
Spring 2014
Figure 1: Introductory Enrollment (2010-2014). pleting an advanced placement course in CS is also growing quickly, further increasing the number of students that are expected to enter into the CS major [1]. Unfortunately, higher enrollments do not always translate promptly to the growth of instructional resources. Faculty that teach introductory courses must therefore search for innovative solutions to handle the higher workloads. The use of automated tools is a common solution to the problem of limited resources, especially for institutions with large class size. Automated grading has been discussed and generally accepted as beneficial [6] and tools such as WebCAT [2] are used widely. At our institution, we use a variety of tools in our introductory programming course to automate grading and give feedback to students. In this paper we evaluate the effectiveness of these tools, which include a web-based system for automated grading, peer instruction quizzes, and an online programming tutorial. The key questions for this research are as follows: 1. How do automated tools negatively or positively influence student learning? 2. Do the benefits of automation, such as resource savings, outweigh the costs? To answer these questions we performed a study over the semesters from Fall 2012 to Spring 2014. The author had primary responsibility for our introductory course during this period, thus allowing tight control over course content and processes. To assess the impact on learning we monitored student performance by examining diverse metrics that include exam scores, total points, withdrawal rates, assignment submission frequency and timeliness, and lecture attendance. Resource savings were estimated by comparing the time spent on grading tasks with and without automation. No significant changes to the curriculum were made during the study.
During the study we introduced several pedagogic changes that are supported by automated tools. In Spring 2013 we incorporated an online tutorial associated with our textbook. In Fall 2012 we began weekly quizzes that were subsequently turned into peer instruction sessions in Fall 2013. Also in Fall 2013 we revised how student programs were evaluated by introducing a web-based automated grading system that provides 24/7 feedback on their student submissions. A minor modification to the course format accompanied these changes. Until Spring 2012 the course had three lectures, no peer instruction, and a 100-minute lab. The current format consists of two lectures, a peer instruction session, and two 50-minute labs. We have continued the new practices until present, with the exception of the tutorial which we dropped after Fall 2013 and are presently re-evaluating. A body of related work exists that evaluates the pedagogic techniques discussed in this paper [8], including automated testing [2, 4, 6, 11], peer instruction [3, 7], and online tutorials [5]. In this paper we focus on the use and efficacy of automation to replace time-consuming, manual tasks. Section 4.6 discusses some benefits and drawbacks of automation. However, in this paper we present evidence that the effects are generally positive, as shown by an improvement in academic performance over the study period. Section 4 shows the study results, which are summarized here. Average scores on our final exam improved from 66.1% in Spring 2013 to 70.3% in Fall 2013, the semester in which we began automated grading and peer instruction. Scores on the final exam continued to improve through Spring 2014 to 73.9%, despite an almost identical exam. Figure 2 presents the withdrawal rate from 2010 to 2014, showing that withdrawals decreased during the same period that exam scores increased. Before Fall 2012 the rate averaged 10.4% and was never less than 8.1%. Since then the rate has averaged 4.9% and has not exceeded 5.3%. Other results include an improvement in the quantity and timeliness of program submissions (Section 4.2), which we attribute to automated grading, and better overall performance (Section 4.4) for students that were assigned an online tutorial. Over the same period we have achieved considerable resource savings from automation (Section 4.5).
2.
AUTOMATED TOOLS
Withdrawal Rate (%)
In this section we describe tools and processes, including automated grading, peer instruction, and online tutorials. We forgo a discussion of the Blackboard system we use for some additional grading automation, because we consider the underlying grade repository to be unimportant. We also omit a discussion of our use of MediaComp assignments [10], which has been unchanged through the study period. 16% 14% 12% 10% 8% 6% 4% 2% 0%
2.1
In an ideal world, instructors carefully review and grade all program submissions to provide feedback to students and identify coding problems. However, the real world requires us to grade large numbers of student programs. Even assignments that can be manually graded in 5-10 minutes are resource intensive. With our current class sizes of 250 or more, such assignments can easily consume 20 hours of manual grading weekly. Allowing multiple submissions per assignment to encourage students to fix defects and improve their code further increases this workload. To meet these requirements within our resource limitations we have adopted automated grading. An informal poll by the author at a BOF session on automated grading at SIGCSE 2013 revealed that a large number of other departments do the same. A complete description of our grading framework is beyond the scope of this paper; instead we summarize the important features here. The back-end consists of shell scripts that run student programs (individually or batched) through test suites supplied by the instructor. Test suites are defined by configuration files that specify command line and grading parameters for each test. Instructors supply test code, input data, and a solution that is used to generate master output against which student output is compared. Our framework is very flexible, allowing us to implement a wide variety of test strategies as well as testing programs in different languages. For Java programs, strategies range from simply executing the student program and filtering the output with shell commands, to running sophisticated test programs that control input and output streams. We have long since moved beyond simple comparison of student program output to the use of advanced language features such as Java reflection that allow us to systematically verify the definition and function of student classes, member variables, and methods. We can also verify code structure and style, and testing produced by the students themselves. In Fall 2013 we added a front-end web interface and test server that support online submission of programs with ondemand grading. The user interface is a web page that lists the name of each assignment and an icon showing completion status. The web page shows the posting date, due date, late deadline, and most recent submission date. Students can examine the code they have submitted at any time. The test server waits for submissions and launches a grading script that posts the results to the web page immediately. Students can therefore receive feedback on their programs 24/7. Our strategy is to create a set of preliminary tests that run interactively and a further set of final tests that are run in batch mode after the due date. We currently use automated grading for programming assignments and quizzes, the latter of which we administer real-time during labs. Figure 3 shows a student view of automated grading.
2.2
Spring Fall Spring Fall Spring Fall Spring Fall Spring 2010 2010 2011 2011 2012 2012 2013 2013 2014
Figure 2: Withdrawal Rate (2010-2014).
Automated Grading
Peer Instruction
Peer instruction is a pedagogic technique that promotes student engagement to improve academic performance [3]. Our approach to peer instruction is to replace one lecture each week with an automated quiz on which students collaborate. For the quizzes we assign groups of 3-4 students to work together throughout the semester using iClicker [13] hardware and software adopted by our university in Spring 2007. The technology provides efficient automated grading and timely feedback to students. The peer instruction ses-
3.
Figure 3: Automated Program Grading Interface.
Figure 4: Peer Instruction Example Question. sions replace quizzes given during lectures in which students answered questions individually. Besides the group format, the newer quizzes differ in difficulty. Previously we asked simple questions that related to reading assignments, now we incorporate questions that require more detailed knowledge of the material. Newer quizzes account for the same 5% of the course grade as the older quizzes. Figure 4 shows a sample question from our of our peer instruction quizzes.
2.3
Online Tutorials
In addition to automated grading and peer instruction, we have recently evaluated the use of an online tutorial. Such tutorials give students a chance to practice programming outside the classroom. They are completely automated, so the instructor only has to select questions, setup dates, and download grades when the submission period is complete. During Spring and Fall 2013 we assigned 137 questions from MyProgrammingLab [9], an online tutorial associated with the textbook we use. In both semesters we gave the same questions from the six chapters covered in the course. In Spring 2013 we assigned the tutorial questions to all students. In Fall 2013 we assigned the tutorial questions to half of the students based on a random selection of lab sections. The purpose of the split was to allow a comparative study of the effectiveness of MyProgrammingLab.
EVALUATION METHODOLOGY
Evaluating tools and processes in the context of an ongoing course is challenging, yet we strongly support the need for formal validation in CS education [12]. Ideally, we would introduce new pedagogic techniques one at a time to allow us to isolate and quantify the associated impacts, but in practice this constrains the pace of adopting teaching improvements. We have chosen instead to concurrently evaluate the practices described in Section 2, thereby making it difficult to quantify the effectiveness of each practice individually. However, we believe that in some cases we are justified in linking performance improvements to specific practices because of obvious causal links. For example, we attribute the changes in the number and timeliness of submissions to automated grading. Our evaluation methodology measures academic performance before and after new processes are introduced, then analyzes the observed differences to see if they are statistically significant. We have chosen a a broad range of measures that include student attendance, withdrawal rates, assignment submission behavior, and the usual academic performance measures such as exam scores and overall grades. In statistical terms, the independent variables are teaching practices and the dependent variables are measures of academic performance. The validity of our work therefore depends on our ability to minimize extraneous variables. More details on threats to validity are presented in Section 5. The list below shows the alternative hypotheses we propose for our study: 1. HA1 : The combined adoption of new pedagogic techniques improves the average final exam scores. 2. HA2 : The combined adoption of new pedagogic techniques decreases the student withdrawal rate. 3. HA3 : The adoption of automated grading increases the number of submissions per student on assignments. 4. HA4 : The adoption of automated grading increases the timeliness of student submissions on assignments. 5. HA5 : The introduction of a weekly peer instruction quiz improves student attendance. 6. HA6 : The adoption of an online programming tutorial improves academic performance in the course.
The null hypothesis corresponding to each alternative hypothesis listed above is that the application of the pedagogic technique in question has no effect on academic performance. We assign to these the labels HO1 through HO6 . Our statistical analysis uses the two-tailed Student’s t-test to compare the means of performance statistics between semesters or Pearson’s chi-squared test for binomial variables. We use a p-value of 0.05 for all tests in accordance with the accepted standard. We use the same statistical analysis for the online tutorial evaluation, but the comparison of scores differs in that the students being compared were enrolled in the course in the same semester. During Fall 2013 we ran an experiment on the effectiveness of the online tutorial. For the experiment we divided students in the course into two groups based on a random selection of labs. Within each lab all students were either assigned the tutorial, or they were not. Both groups had identical labs except for a single training session on how to use the tutorial, and the course content and grading was identical in every other way. Participants in the study filled out consent forms approved by the compliance office at our institution.
Semester
Zeros Sample Statistical Mean Median Stddev Variance Increase Included Size Significance
Spring 2013
Yes
66.1
71.0
234
20.3
410.4
+0.0% base semester
Spring 2013
No
68.5
71.0
234
16.2
264.0
+0.0% base semester
Fall 2013
Yes
70.3
76.3
252
24.1
582.7
+6.4%
Fall 2013
No
75.7
79.0
252
14.7
216.3
+10.6%
Spring 2014
Yes
73.9
78.0
232
20.5
422.3
+11.8%
Spring 2014
No
77.6
78.0
232
12.5
156.8
+13.3%
t = 2.07 p = 0.0388 t = 5.04 p < 0.0001 t = 4.11 p < 0.0001 t = 6.63 p < 0.0001
Figure 5: Analysis of Exam Scores.
4. 4.1
RESULTS Performance Evaluation
We controlled the content of the final exam from Spring 2013 through Spring 2014 to allow semester-to-semester comparison of student performance. Figure 5 shows final exam statistics over the period. The leftmost columns report the mean, median, sample size, deviation, and variance of scores. The next column shows the percentage improvement in scores from the base semester, which is Spring 2013. The computations are performed with and without zero scores because the scores without zeros are very close to normally distributed, a condition of the Student’s t-test. However, we observe the same outcome in both cases. We find an increase in average scores of 6.4% from Spring 2013 to Fall 2013 or 10.6% without zero scores. The scores increase by 11.8% from Spring 2013 to Spring 2014 or 13.3% without zero scores. The differences are statistically significant, as shown by the Student’s t-test result in the rightmost column. Based on these results we reject the HO1 null hypothesis. Next we examine the withdrawal rate over the study period to show that under-performing students did not withdraw at higher rates, thereby biasing exam scores. The withdrawal rate is calculated by comparing the census two weeks into the semester to the list of students that complete the course and receive a final grade. Figure 6 shows the number of students enrolled, completion and withdrawal numbers, and the withdrawal percentage for each semester. We include data from several semesters before the study to show the trend. Note that the drop in withdrawal rates precedes the introduction of two of the treatments by one semester, possibly indicating an extraneous factor. For this reason we put the baseline at Fall 2012. We compare later semesters using Pearson’s chi-squared test for statistical significance. The comparison to Spring 2013 narrowly misses statistical significance, with a p-value of 0.0565. The comparison to Fall 2013 is significant, as is Spring 2014, with p-values of 0.0125 and 0.0409 successively. Despite the early start, the lower withdrawal rate is stable through the study period, confirming that the higher exam scores are not caused by an increase in withdrawals. Based on this result we reject the HO2 null hypothesis.
4.2
Assignment Submissions
Here, we evaluate the effects of automated grading on the behavior of students with respect to programming assignment submission. Our on-demand testing allows students to work on their programs and get feedback anytime. Be-
Withdrawal Semester Enrollment Completion Withdrawal Rate
Statistical Significance
Spring 2011
185
170
15
8.1%
precedes study
Fall 2011
215
190
25
11.6%
precedes study
Spring 2012
209
189
20
9.6%
precedes study
Fall 2012
243
219
24
9.9%
base semester
Spring 2013
245
232
13
5.3%
Fall 2013
261
250
11
4.2%
Spring 2014
256
243
13
5.1%
χ2 = 3.64 p = 0.0565 χ2 = 6.24 p = 0.0125 χ2 = 4.18 p = 0.0409
Figure 6: Analysis of Withdrawal Rates. Semester Spring 2013 Fall 2013 Spring 2014
Statistic
Average
Submissions
231
Per Student
1.11
Submissions
677
Per Student
2.95
Submissions
856
Per Student
4.11
Figure 7: Comparison of Submission Rates. fore automation, assignments were posted at the start of the week and due one week later. Because students lacked an incentive to submit earlier, almost all submissions were near to the deadline and the average number of submissions was very close to one per student. Final grading was posted a few days later and represented the first feedback received by the student. With automated grading, submissions are more timely, and we receive more submissions per student because an incentive now exists for the student to keep working on their program until tests pass. With the current system, preliminary grading feedback is immediate, and final grading is usually completed within 24 hours of the late deadline. Figure 7 shows the average submissions per assignment and student. The latter statistic includes only the students that submitted at least once. In Spring 2013, before automated testing, the average number of submissions per student for all assignments was 1.11. In Fall 2013, when automated grading was introduced, the average submissions per student increased to 2.95, and this number jumped to 4.11 in Spring 2014. We believe this result reflects mastery of the automated testing system by teaching staff (and students), and the new motivation that automated grading provides to continue working on an assignment until all tests pass. We omit a statistical evaluation because the disparity in the number of submissions is clearly significant and expected because of the difference in the reward structure, and we reject the HO3 null hypothesis. Our underlying assumption is that the number of submissions is coupled to student effort. Figure 8 shows the number of submissions for each day of the week in which the assignment is posted. The percentages are averages for all assignments within each semester. The last two semesters are from the automated grading system and the first semester from our grading repository. As with the number of submissions, we omit a statistical evaluation because the disparity is both obvious and expected, so we reject the HO4 null hypothesis. Without automated grading, students predominantly submit on the due date or during the late period, so the chart shows 90% of submissions for
Submissions (%)
100% 80% 60%
Spring 2013
40%
Fall 2013 Spring 2014
20% 0% Day 1 Day 2 Day 3 Day 4 Day 5 Day 6 Day 7
Sample Class Average Statistical Size Percentage Total Significance
Semester
Category
Fall 2013
Everyone
252
100%
78.02%
Fall 2013
Control
121
48%
76.60% base population
Fall 2013
Treatment
110
44%
80.09%
t = 1.73 p = 0.0421
Fall 2013
Self Unassigned
8
3%
68.20%
t = 2.34 p = 0.0212
Figure 8: Comparison of Submission Timeliness. Figure 10: Online Tutorial Comparative Study. Semester
Sample Average A2endance A2endance Size Score (Absolute) (Percentage)
Statistical Significance
Spring 2013
234
91.36%
191
81.62%
base semester
Fall 2013
252
91.48%
214
84.92%
χ2 = 0.96 p = 0.327
Spring 2014
232
90.39%
196
84.05%
χ2 = 0.25 p = 0.619
Figure 9: Comparison of Attendance Rates. Spring 2013 on the last day. With automated grading, submissions for Fall 2013 and Spring 2014 are more spread out. Thus 24/7 automated grading has ameliorated at least one of the problems associated with last minute submissions – lab overcrowding, and this has been confirmed by our lab staff. A benefit of this research is that we now have a baseline for comparison of future submission statistics.
4.3
Peer Instruction
We have observed that peer instruction has both improved attendance and allowed us to give more difficult quizzes. Figure 9 displays the average student scores and attendance. In Spring 2013 we gave quizzes that were taken individually; by Fall 2013 we had converted to full peer instruction sessions. Both kinds of quizzes were administered with iClickers and graded automatically. The peer instruction quizzes were much harder, and we received some complaints from students as a result. Despite this, attendance increased from 81.62% in Spring 2013 to 84.92% in Fall 2013, falling back slightly to 84.05% in Spring 2014. However, the differences are not statistically significant as shown by the Pearson’s chi-squared test results in the rightmost column, so we cannot reject the HO5 null hypothesis. There is also no statistically significant difference in the scores between the older and newer quizzes, an interesting result given that the peer instruction quizzes are much harder. We attribute the similarity in performance to the collaboration inherent in peer instruction, and our view is bolstered by the large delta in scores that we observe when we first present questions individually and subsequently allow groups to answer them. We find percentage gains of 30-40% in the number of correct answers in this case, and other researchers report similar results [3].
4.4
Online Tutorial
A total of 252 students completed the course in Fall 2013, during which we ran a comparative study on online tutorials. Out of these, we required a treatment group of 110 (44%) to use MyProgrammingLab, and left the remaining 121 (48%) as a control group. Of these students, we dropped 21 (8%) from the study for not completing a consent, not writing their names legibly on the form, or because of withdrawals
from the course. The assignment of students was random, based on the lab in which they participated. Only 8 (3%) students did not complete the tutorial that they were assigned. The curriculum was otherwise identical for both groups, except for one lab in which we helped the treatment group learn how to use the online tool. Figure 10 shows the average points received by students in each category. We use total points to measure overall performance, since it includes all coursework and is used to assign letter grades. The entire class averaged 78.0%, whereas the control group averaged 76.6%, and the treatment group averaged 80.1%. Unsurprisingly, the group that failed to complete the tutorial averaged only 68.2% total points. Both differences are statistically significant, as shown in the rightmost column. The treatment group received 5% of the total points through the tutorial, and the control group received the same points by scaling the remaining grades from 95% to 100%. The average for the treatment group on the tutorial was 70%, so it is unlikely that the difference is caused by the tutorial being easier than other work. Based on the results shown, we reject the HO6 null hypothesis. We find that online resources are increasingly comprehensive and inexpensive, yet require very little management on the part of the instructor. For this reason, we expect that many instructors are (or will be shortly) using them to complement traditional classroom activities.
4.5
Resource Savings
We now compare the time for manual versus automated tasks. Grading time varies with complexity, at the introductory level assignments can often be graded in 5-10 minutes. For class sizes of 250 this still means 20 hours or more of grading. With automation we can write and configure tests and run grading scripts in a total of 3 hours or less. The savings in teaching resource is therefore at least 17 hours per week, or 204 hours per semester based on 12 assignments. We disregard assignment prep time, which is the same with or without automation. Quiz grading is less costly, but paper handling makes it difficult to spend less than a couple of minutes per student. For classes of 250 this is 500 minutes or more than 8 hours weekly. Automated grading of quizzes requires less than an hour per week of instructor time. Thus the savings is 7 hours per week, or 84 hours per semester based on 12 quizzes. We forgo an analysis of resource savings for online tutorials, which are inexpensive to manage and have no equivalent manual process. From the monetary standpoint, a TA at our institution earns around $20 an hour, so the savings per semester per class is at least $4000 for program grading and $1600 for quiz grading. However, we find that the main benefit of automation is not monetary savings, but the decrease in resource that can now be applied to teaching. Prior to the introduc-
tion of automation, the majority of TA time in introductory classes was spent grading. Now the instructor handles grading and assistants spend more time with students. We are also able to give weekly quizzes and tutorials that would be impractical without automation. The development costs of automation are significant, but can be amortized over many classes and semesters.
4.6
Analysis
As stated above, the primary benefit of automation is resource savings. However, we have identified other benefits. For example, the high availability of the grading system reduces lab overcrowding and improves student access. The repository component of the grading system is similarly convenient for students since it allows them to transfer code between lab and personal systems. Our most important finding is that automation does not impair and can actually benefit academic performance and increase student interest in our major, as measured by exit surveys and instructor evaluations. Based on verbal and written feedback, automated grading is also overwhelmingly popular among students. However, there are drawbacks to automation. One is the difficulty of replicating code reviews, which we believe are especially valuable to novice programmers. Automated grading has an unforgiving nature, and some students find it excessively strict. We also observe that some students work on assignments only until they pass preliminary tests, thereby missing some of the requirements. This raises the concern that students throw submissions at automated grading instead of learning to debug or test their code themselves.
5.
THREATS TO VALIDITY
Threats to validity are inherent in empirical studies performed on students in a university setting. Internal validity reflects the strength of evidence of a causal relationship between the independent and dependent variables. In this paper we show that improved academic performance coincides with the introduction of new pedagogic techniques. Threats to internal validity therefore consist primarily of extraneous factors that could account for these observed differences. Examples include semester-to-semester variation in student abilities, staff turnover, and changes in course content. However, we have tried to minimize these threats by keeping the same instructor and course format, and by maintaining consistency on curriculum, lecture and lab materials, programming assignments, and exams. External validity concerns the applicability of our results outside of our university. While there is no guarantee of identical results, we argue that the conditions at our university are substantially similar to those at other public institutions. Thus we argue that the techniques presented can be reasonably expected to improve academic performance if applied similarly, and many related research papers (as cited in the introduction) have shown success with the application of these techniques at other universities. Due to space limitations the description of our automated grading system is not complete in this paper, but we plan to publish more detail on our testing methodology in the near future.
6.
CONCLUSIONS
We conclude that automation of key processes such as program grading can save a significant amount of scarce re-
sources in introductory courses without negatively impacting academic performance. The benefits of automation are both tangible, such as higher exam scores, and intangible, such as increased student engagement and interest. We find this very encouraging, since expanding enrollments will inevitably provide incentive for even more automation.
7.
ACKNOWLEDGMENTS
The author would like to acknowledge Fritz Sieker for creating the automated grading framework, Debbie Bartlett and Russ Wakefield for mentoring me as an instructor, and Beth Simon for introducing me to peer instruction and other modern pedagogic practices
8.
REFERENCES
[1] 2013 Taulbee Survey. Computing Research News, 26(5):10–55, May 2014. [2] A. Allowatt and S. H. Edwards. IDE Support for Test-driven Development and Automated Grading in Both Java and C++. In Proc. of the 2005 OOPSLA Workshop on Eclipse Technology eXchange, Eclipse ’05, pages 100–104, New York, NY, USA, 2005. ACM. [3] C. G. Catherine H. Crouch and E. Mazur. Peer Instruction: Ten years of experience and results. American Journal of Physics, 69:970–977, 2001. [4] C. Douce, D. Livingstone, and J. Orwell. Automatic Test-based Assessment of Programming. Journal Educational Resources Computing, 5(3), Sept. 2005. [5] A. Edgcomb and F. Vahid. Effectiveness of Online Textbooks vs. Interactive Web-Native Content. In Proc. of 2001 ASEE Annual Conf. and Exposition, 2014. [6] S. Edwards. Using Test-Driven Development in the Classroom: Providing Students with Automatic, Concrete Feedback on Performance. In Proc. International Conf. on Education and Information Systems: Technologies and Applications (EISTA 03), pages 421–426, 2003. [7] L. Porter, C. Bailey Lee, B. Simon, Q. Cutts, and D. Zingaro. Experience report: A multi-classroom report on the value of peer instruction. In Proc. of the 16th Annual Joint Conf. on Innovation and Technology in Computer Science Education, ITiCSE ’11, pages 138–142, New York, NY, USA, 2011. ACM. [8] L. Porter and B. Simon. Retaining Nearly One-third More Majors with a Trio of Instructional Best Practices in CS1. In Proc. of the 44th ACM Technical Symposium on Computer Science Education, SIGCSE ’13, pages 165–170, New York, NY, USA, 2013. ACM. [9] W. Savitch. MyProgrammingLab with Pearson eText for Java: Intro to Problem Solving and Programming. Addison-Wesley Publishing, USA, 6th edition, 2011. [10] B. Simon, P. Kinnunen, L. Porter, and D. Zazkis. Experience Report: CS1 for Majors with Media Computation. In Proc. of the Fifteenth Annual Conf. on Innovation and Technology in Computer Science Education, ITiCSE ’10, pages 214–218, New York, NY, USA, 2010. ACM. [11] J. Spacco, D. Hovemeyer, W. Pugh, F. Emad, J. K. Hollingsworth, and N. Padua-Perez. Experiences with Marmoset: Designing and Using an Advanced Submission and Testing System for Programming Courses, 2006. [12] A. E. Tew and B. Dorn. The Case for Validated Tools in Computer Science Education Research. Computer, 46(9):60–66, 2013. [13] C. Whitehead and L. Ray. Using the iClicker Classroom Response System to Enhance Student Involvement and Learning. Journal of Education, Informatics and Cybernetics, 2(1):18–23, 2010.