The Quality of Time Spent with Children in Australian Households Charlene M. Kalenkoski Ohio University Department of Economics Bentley Annex 351 Athens, OH 45701 (740) 593-2022 (phone) (740) 593-0181 (fax) Gigi Foster University of South Australia School of Commerce Elton Mayo building, North Terrace Adelaide, South Australia 5001 +618-8302-0821 (phone) +618-8302-7001 (fax)
Abstract: Using data from the 1992 and 1997 Australian Time Use Surveys, we explore patterns in the quality of child care time spent by parents in Australia. Drawing on prior theory and results from multiple disciplines, we suggest and construct four alternative ways of defining child care quality. We estimate censored regression models of the time parents spend in high-quality child care, the time parents spend in lower-quality child care, and the time parents spend in market work according to these different definitions. We find that seemingly small changes in how the quality of time spent caring for children is conceptualized significantly affect the conclusions we draw about the associations of different household and personal characteristics with parental child care time. JEL Codes: D1, J13, J2 Acknowledgments We thank Deborah Cobb-Clark, Lyn Craig, Rachel Connelly, Kimberly Fischer, Nancy Folbre, Sabrina Pabilonia, David Ribar, Leslie Stratton, and Jean Yeung for their comments on previous versions of this paper. We also thank Matthew Giro, Adam Lucchesi, and Kweku Opoku-Agyem for research assistance. All errors are ours.
1
The Quality of Time Spent with Children in Australian Households
Introduction In the past twenty years there has been a renewed interest in time-use research by economists. This has partly been a function of the growth in the availability of time use data since the mid-1980s. One area of interest to applied researchers is the amount of time that parents spend caring for their children, as this time is thought to be an important investment in children’s well-being as well as an undocumented economic cost. Differences in the amount and fashion of this investment across households may account, in part, for the heterogeneity in future outcomes observed across children. For instance, Datcher-Loury (1988) shows that an increase in child care time by highly educated mothers raises children’s eventual years of schooling (although this is not true for lesseducated mothers). Muller (1995) provides evidence that unsupervised time after school reduces a child’s performance on eighth-grade math achievement tests. Amato and Rivera (1999) show that fathers’ involvement reduces behavior problems in children. Time diary data make possible the detailed exploration of patterns of parental child care time, providing us with the opportunity to enhance our understanding not only of parents’ investment choices, but of the potential origins of teen and adult inequality. In the absence of direct measures of child quality, most economic studies of parental child care time using time-diary data have focused on the total quantity of child care time spent by parents. However, if each hour spent by a parent with his/her child is not equally productive and/or not equally costly, then models of parental investment in children which do not capture this fact may be misleading to the extent that the heterogeneity of the quality of time spent is correlated with parental observables. Some
2
previous research has dealt with this fact to some extent by separately modeling total time spent in child care as a primary activity and total time spent in child care as a secondary activity (child care performed when another, non-child care activity is being performed as the primary activity). However, while readily implemented using most time-diary data sets, there is no a priori reason to believe that this is the only or the best way of capturing the quality dimension of parental time inputs to child production. The developmental psychology literature offers a number of theories (see Shaw and Bell (1993) for a review) regarding how parents’ behavior may affect children’s later emotional functionality, most of which suggest that it is not only aggregate time but the type of time parents spend with children that nurtures a child’s healthy development. Further, from a parent’s perspective, an hour with a child that is also spent doing something else will have a lower opportunity cost than an hour of time spent doing nothing but child care. These two hours should therefore be tallied differently in any accounting of parents’ non-market work, as is currently being attempted through the construction of “satellite” NIPA accounts of non-market production using time diary data (see Landefeld et al. 2005 for a review). Because most previous time-diary research has not focused on the quality of parents’ child care time, we do not have much guidance as to how the quality of such time should be measured. However, the economic and psychological considerations mentioned above, coupled with existing evidence of an association between parents’ commitment to child development and their investment in different types of care (Stafford and Yeung 2004), motivate our use in this paper of four different classifications of the quality of parental child care time that can be made with our data. Our first
3
classification uses parents’ reports of up to three different simultaneous uses of time (primary, secondary, and tertiary activities) to define a measure of quality based on whether or not child care is the only task being performed by the parent. With these reports we are able to tally separately a parent’s total observed minutes of child care time where child care is the sole task being performed (deemed to be high-quality care) and a parent’s total time spent in multi-tasked care (deemed lower-quality care). This measure is appealing from an economics perspective as quality is based on differential opportunity costs of care. Our second classification relies on whether or not a parent reports child care as the primary activity being performed. Separately tallying time in primary and secondary capacities is the most common way of addressing time quality heterogeneity in the literature, and our results using this measure are therefore the most comparable to existing studies that have accounted for different types of child care time. Our third classification tallies parental time spent with children according to whether or not an activity is considered to be development-oriented, without regard for whether the activity is sole- or multi-tasked or whether it is undertaken in a primary or other capacity. Activities that are oriented toward child development are deemed high-quality care under this approach, as in Stafford and Yeung (2004). The development-oriented activities we include are teaching or playing with children and engaging in physical or emotional care of children. All other child care activities are classified as being non-developmentoriented and are deemed lower-quality care. Our fourth and final classification tallies the time that parents spend with children aged 0 to 11 while reporting being primarily engaged in a child-related activity (deemed high-quality care) and the time that they spend in the company of children aged 0 to 11 without reporting being primarily engaged
4
in any child-related activity (deemed lower-quality care). This approach can be likened to the division of parental time into “engagement time” and “accessible time” used in Yeung and Stafford (2006) and is analogous to the classification of “primary” and “passive” child care used in other studies. We apply these four different classification schemes to detailed Australian timediary data from 1992 and 1997, first briefly documenting the overall patterns in child care time provision and noting differences with respect to how quality is conceptualized. Next, we explore the individual-level and household-level determinants of high- and lower-quality parental child care time and the time parents spend in market work for each classification separately. Given well-known gender differences in the amount of time mothers and fathers spend in child care, we provide estimates separately by gender. To account for the time constraint faced by every individual, we specify a model that allows for correlations in the individual-level error terms across the three uses of time (highquality child care, lower-quality child care, and market work). Our results show that, as expected, there are different patterns in and determinants of the time mothers and fathers spend in child care and the time they spend in market work. While we confirm some general patterns found in previous research, we find that the definition of quality used in our models is central to the conclusions we can draw regarding the distribution and determinants of high- and lower-quality child care by parents.
5
Existing Literature There are several existing studies of parental child care time that use time-diary data. These papers typically focus on describing the associations of time spent with or for children with demographic and other variables such as gender, household structure, and work-related characteristics. Some look at changes over time, focusing on how women’s increased labor force participation has influenced patterns of care in the home. Most focus on the total amount of child care time spent or on the tradeoff between time spent caring for children and time spent working. Most also rely on data from the United States and Europe. Economic studies typically motivate their analyses with Becker’s (1965) household production model. In this model, the household chooses time spent in market and household work to maximize its utility over household-produced commodities such as child quality that are produced with household members’ time, and goods and services purchased in the market. Only a handful of papers model variance in what may be considered the quality of time spent with children. Kooreman and Kapteyn (1987) use U.S. data on couples from a University of Michigan survey conducted in 1975-1976 to estimate a model of the allocation of time among different uses. They find a strong effect of the presence of young children on women’s child care time that decreases with the age of the children in the household. They also find that the presence of young children reduces women’s time spent on entertainment and social activities. However, they find that men’s time use in general is unaffected by the presence of children. Nock and Kingston (1988) use time-diary data from the 1981 Study of Time Use (STU) to examine the tradeoff American parents make between market work and time
6
with their children. They find that parents in single-earner families spend a substantially greater amount of time with children than parents in dual-earner families due to dualearner families spending more time working in the market, but that the difference is mostly in non-child-oriented activities, such as homemaking. It is thus what may be perceived as lower-quality child care that is sacrificed by dual-earner parents. Bianchi (2000) shows that mothers’ time with children in the U.S. has not decreased even as women’s labor force participation has increased. She separately investigates three measures of child care time: time spent in child care as a primary activity, time spent in child care as a secondary activity, and time spent with children present. She finds that, regardless of the measure used, mothers spent as much time in 1998 with their children as they did in 1965, if not more, and that if one adjusts for family size, mothers in 1998 may be spending more time per child than mothers in the 1960s. Sandberg and Hofferth (2001, 2005) use the 1981 and 1997 waves of the Panel Study of Income Dynamics Child Development Supplement (PSID-CDS) to examine changes in the total amount of time children in the U.S. spend with their parents given the increase in women’s labor force participation and the rise of single-parent families over this period. They find that children’s time with parents did not decrease over the period as expected given these demographic changes; rather, it substantially increased. Hallberg and Klevmarken (2003) use data from the 1984 and 1993 waves of the Swedish household panel study, Household Market and Nonmarket Activities (HUS), to analyze the tradeoff between parents’ time with children and time spent in market work, taking into consideration child care provided outside of the home and the process benefits, or utility, derived by parents from both activities. They find that economic
7
incentives affect child care mainly through market work, and also that a change in the fathers’ hours of work has a greater influence on parents’ time with their children than a change in the mothers’ hours of work. They also find that parents prefer joint activities with their children and that outside child care is not a substitute for parents’ own time with children. Kalenkoski, Ribar, and Stratton (2005) use time diary data from the United Kingdom Time Use Survey (UKTUS) to investigate how parents’ time spent in child care differs with their marital status and other characteristics. They focus on three uses of time: child care as a primary activity, child care as a secondary activity, and market work. They find that single, non-cohabiting parents of both genders spend more time in child care and less time in market work than married parents, and that there is no statistically significant difference in the time use of married and cohabiting parents. They also find that, for both men and women, minutes spent in child care increase with the number of young children. Finally, they also show that the number of children aged 12-17 in the household is negatively associated with primary child care, suggesting that these older siblings may be acting as caregiver substitutes for the parents. Kalenkoski, Ribar, and Stratton (2007) use both the UKTUS data and data from the 2003-2005 American Time Use Surveys (ATUS) to estimate the effect of family structure on the time parents spend on child care as a primary activity, passive child care (defined as any time spent with a child when doing some non-child care activity as the primary activity), and market work. They find that, in the U.S. and the U.K., single parents spend more time in both primary and passive child care than married or cohabiting parents. However, while in the U.K. single parents work less than married or
8
cohabiting parents, in the U.S. single parents work more than their married or cohabiting counterparts. Kimmel and Connelly (2007) also use data from the 2003 and 2004 ATUS to analyze the effect of wages on mothers’ child care time. They find a positive effect of both mothers’ wages and fathers’ earnings on mothers’ primary child care time. In one of the few detailed studies of child care time using Australian time diary data, Craig (2007) uses the 1997 Australian Time Use Survey to ask how employed mothers manage to avoid giving up child care hours on a one-for-one basis as their attachment to the labor force increases. Noting some prior evidence that child care quality may matter to child development outcomes and is disproportionately preserved by working mothers (Nock and Kingston 1988, Sandberg and Hofferth 2001), she finds that, compared to nonworking mothers, employed mothers re-adjust their weekly and daily activity schedules, spend less time on child-free non-market activities, and rely upon nonparental childcare at certain times in order to make time to be with their children. In two recent working papers using children’s time diary data from the PSIDCDS, Stafford and Yeung (2004, 2006) define and examine several different types of child care. Their classifications include development-oriented and non-developmentoriented care; time spent in achievement- and non-achievement-oriented activities; and engagement time and accessible time, as termed in Lamb et al. (1985). They find that high-quality child care time (as measured by time spent in development- or achievementoriented activities or engagement time) is spent disproportionately by couples in which each partner cares greatly about their children’s development and has high levels of human capital. Thus, positive assortative mating among parents leads to substantial
9
inequality in children’s receipt of development-oriented care. These results, coupled with prior evidence in Stafford (1987) that achievement-oriented activities have positive developmental results for children, provide further support for the notion that productive investments in child development are highly unequal across households. Folbre et al. (2005) note three problems with the child care literature. First, there is a focus on explicit activities that ignores passive care (including time the child is sleeping). Second, there is a focus on parents as the only potential caregivers, ignoring siblings and grandparents. Finally, there is a lack of attention to overlaps of time between parents and children. They propose three different measures of passive care, a measure of active care, and a measure of “care density” defined as the ratio of adults to children under 13 participating in a given activity. They also consider secondary child care as a measure of multi-tasking. Using the 1997 PSID-CDS, they conclude that the upward trend in average hours of care by parents may be misleading, and suggest that new measures and the investigation of the time spent by other caregivers in the household are needed to paint the complete picture of American child care time expenditures. Given the small numbers of older siblings and grandparents living in households with children available in our Australian data, we are unable to investigate the time they spend in child care. However, in the spirit of beginning to address Folbre et al.’s (2005) concerns regarding the measurement of child care time, and to continue in the vein of Stafford and Yeung’s work regarding development-oriented child care, we do explicitly model the quality of adults’ time with children by proposing and utilizing four different taxonomies of child care provision by parents. To motivate these taxonomies we draw on the apparent dependence of children’s developmental outcomes on care of certain types
10
and on the fact that parents’ opportunity cost of child care provision will differ depending on whether the care is performed in conjunction with other activities. Our four taxonomies are as follows: sole-tasked versus multi-tasked child care, primary versus secondary child care, development-oriented versus non-development-oriented child care, and active versus passive care of 0- to 11-year-olds. We investigate the determinants of high- and lower-quality parental child care time separately by the quality classification and the gender of the parent, while accounting for the fact that a parent’s minutes of highquality child care time are determined jointly with his or her minutes of lower-quality child care time and the time that the parent spends in market work. We use two samples of recent Australian time-diary data which have not to our knowledge been used to explore the determinants of parental child care time of heterogeneous quality. Importantly, we show that our results vary depending on how quality is defined and thus why it is important to consider carefully the appropriate conceptualization of child care quality.
Data and empirical approach The data we use are drawn from the 1992 and 1997 Australian Time Use Surveys. Each survey contains two consecutive days’ worth of time-diary data on all adults in a random sample of Australian households. Given the consecutive nature of the two diary days, we treat them together as one 48-hour (2880-minute) reporting period. Our analysis data set therefore includes one observation per individual on an array of household-specific and person-specific variables, including the total number of minutes in that 48-hour period that an individual spent in both high- and lower-quality child care
11
(using each of our four definitions), and the number of minutes that the individual spent working in the market. Our sample selection criteria are as follows. First, the few individuals who reported time use only for one day are excluded. Second, only households with children, and in which neither primary adult (the householder or the spouse of the householder) is studying full-time, part-time, or by correspondence, are included. While we model time use only for primary householders and their spouses or partners living in these selected households, we also include information on other resident relatives of the household head 15 years of age or older (most of whom are under the age of 25) by constructing and incorporating a dummy variable indicating whether an “other adult” of this sort was present in the household. Table 1 provides sample sizes separately for 1992 and 1997, and for the two years combined. Before sample restrictions, the total number of adults represented in the two Time Use Surveys is roughly 28,000. In our analysis sample of parents there are over 3,400 fathers and 4,300 mothers, for a total of 7,728 observations. To create each of our child care time use variables, we tally the total minutes spent by a given parent in a particular capacity during the 48-hour window of observation. For our first measure of a given person’s high-quality child care time, which we term sole-tasked care, we sum the number of minutes during which that person reported being engaged in a primary capacity in any of an array of child care tasks, during which he or she did not report being simultaneously engaged in any non-childrelated secondary or tertiary activity. The child care tasks we include in this construct, and for two of our remaining three child care quality constructs, are as follows: minding
12
child(ren), taking care of sick child(ren), teaching child(ren), playing with child(ren), performing physical or emotional care of child(ren), traveling in association with child care or with child(ren), and child care not further defined.1 To tally a person’s lowerquality, multi-tasked child care time using an analogous approach, we sum the number of minutes during which that person reported being engaged in any child care task, whether primary or otherwise, and reported being simultaneously engaged in some non-childoriented activity. This construct of quality can also be thought of as capturing the heterogeneous costs to parents of child care time, since sole-tasked care by its nature disallows simultaneous productive work toward another objective and therefore inherently has an equal or greater opportunity cost for parents, compared to multi-tasked care. To construct our second set of child care time measures, we first sum the number of minutes during which a person reported being engaged in any of the child care tasks listed above as his or her primary activity. This sum is our high-quality child care measure, termed “primary” care. Then, to form the lower-quality measure, which we term “secondary” care, we sum the number of minutes during which a person reported being engaged in any of the previously-defined child care tasks in a secondary or (in 1992) tertiary capacity, being careful not to double-count time in the same activity. In practice, single-counting was achieved through a strict dominance in our calculations of any activity reported as occurring in primary time over the same activity reported occurring in secondary time, and likewise for secondary and tertiary time.
1
In 1992 we included “child care not further defined” but in 1997 excluded “child care not elsewhere classified.” Our measures of child care time also explicitly exclude any time during which the reporting individual (the mother or father) was engaged in sleeping or napping. “Default care” of a sleeping child, if reported by respondents, is therefore counted only if the parent or guardian was awake while the child slept.
13
To implement our third classification scheme, we sum the number of minutes during which a person reported being engaged in a development-oriented child care task, defined as the following subset of the child care activities: teaching child(ren), playing with child(ren), and performing physical or emotional care of child(ren). No distinction is made regarding whether an activity was performed in a primary, secondary, or tertiary capacity. This sum serves as our measure of high-quality, “development-oriented” care.2 Lower-quality child care under this classification, termed “non-development-oriented” care, is the difference between total time spent on any of the set of child-related activities included in the first two measures, and total time spent on the subset of those activities that are development-oriented. Our fourth classification of the quality of child care time rests on our ability to observe who was present with the time diary respondent at any minute of the observation period – and in particular, whether a child aged 0 to 11 was present. To construct our high-quality child care measure using this approach, we sum the number of minutes during which a person was with a child aged between 0 and 11 and reported being engaged in a child-related activity in a primary capacity. This we term “active” care, as it corresponds somewhat to the idea of “engagement time” as discussed in Lamb (1985), and it is very similar to our measure of “primary” time except for its dependence on the presence of children in a particular age group. To measure the lower-quality counterpart, which we term “passive” care, we sum the number of minutes during which a person was with a child aged between 0 and 11 and did not report being engaged in a child-related
2
Again, care was taken not to double-count child care time, using the strict dominance method described above.
14
activity as his or her primary activity. This corresponds roughly to Lamb’s (1987) notion of “accessible time.” Finally, the number of minutes spent on market work by a given person is calculated by summing all minutes spent (whether reported as primary, secondary, or tertiary) on the following work-related tasks over the 48-hour period of observation: work for pay, work brought home, job search, travel for work, overtime, unpaid work for a family business, work-related communication, and labor force activities not further defined. Explanatory variables included in our time use models include indicators for whether or not the respondent is single; speaks a language other than English in the home; is Australian; is in a certain age range; lives in a non-metropolitan urban area or a rural area; works in a particular industry or occupational group; provided no occupation or industry information; and has attained various levels of education. We also observe for each person whether the household contains disabled children or adults; whether there are other adults in the household related to the household head besides the respondent and a spouse or partner; the number and youngest age of dependent children living in the household; the number of people in different age ranges living in the household; the number of women in the household; household structure; whether anyone in the household reported that child care was difficult to find; the number of weekend days included in the 2-day diary period; and survey year (1992 or 1997). These variables are discussed and supported conceptually below. In the standard household production model, the time allocated to producing household commodities depends on the needs of the household, the household’s
15
resources, and relative market versus household productivity. The variables that proxy for household child care needs include those that represent the number of children in the household, the age of the youngest child in the household, and whether or not there are any disabled children in the household. Younger children, disabled children, and a greater number of children all lead, ceteris paribus, to a greater household need for child care. In addition, although we do not have information on the availability of child care by non-household members, we are able to construct a dummy variable indicating whether anyone in the household reported through the survey that child care was “difficult to find.” We include this variable as a proxy for the exogenous availability of outside child care options.3 From an economic perspective, we would expect that parents in households that are more constrained with respect to outside childcare possibilities may provide more child care themselves. Variables controlling for the household’s time resources include indicators for single status, the availability of other adults in the household, and whether a disabled adult is present in the household. Additional able-bodied adults in the household provide it with a greater time resource. In addition, households with two adults instead of one have greater opportunities for specialization and may enjoy economies of scale (Becker 1985). Finally, since wage data are not available, market productivity is captured by the educational attainment and age category dummies. Estimation is performed separately by gender because cultural norms, previous research, and our descriptive statistics suggest a greater and different role for women in the child-rearing process.
3
In practice, this variable was set to 1 if anyone in the household reported either that child care could not be arranged at short notice, or that the main reason he or she was not looking for work was the inability to find suitable child care.
16
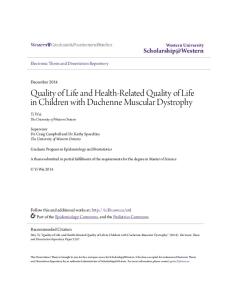
Table 2 displays descriptive statistics for the time use measures and all of the explanatory variables used in our regressions by gender, with the exception of quarter, year, industry, and occupation dummy variables. Figures 1 and 2 display the average minutes spent by men and women separately in each quartile of the gender-specific distribution of child care time for each of our four high-quality measures. These displays show that the Australian context is broadly similar to that of the United States and the United Kingdom. As in Kalenkoski, Ribar, and Stratton (2005, 2007), women in Australia are found to spend more total time on child care than men.4 Significant spread is evident in the minutes parents spend in each of our high-quality child care measures, even in the middle of their distributions. The largest spread across all measures, for both genders, is that observed for development-oriented care, perhaps because these types of activities are the most discretionary and thus the most subject to heterogeneous preferences. The lowest variance across all measures is that observed for sole-tasked care, perhaps because the variance here is primarily due to resource constraints.
Model We jointly estimate reduced-form censored regression (tobit) models of the determinants of the amount of high-quality and lower-quality time that mothers and fathers spend in child care along with the amount of time they spend in market work, allowing the three different uses of time to be correlated for each person. We do this to account for the 48-hour time constraint faced by each individual respondent that causes time spent in one activity to take away time available for another activity and also to
4
While not shown in the table or figures, this statement is true for both high- and lower-quality care.
17
account for any other person-specific unobserved factor that affects the person’s time allocation decision, such as a strong disposition toward child rearing or market work. The models to be estimated are specified as follows: ′ HH + β HP ′ X P+ e HP H P* = α HP
(1)
′ HH + β LP ′ X P+ e LP L*P = α LP
(2)
′ HH + β WP ′ X P+eWP . WP* = α WP
(3)
where H*P, L*P, and W*P are latent variables referring to the minutes of highquality child care time, lower-quality child care time, and market work desired by household member P (where P = m if mother, and P = f if father); HH is a vector of household characteristics, XP is a vector of person-specific characteristics; eHP, eLP, and
eWP are the error terms; and α′HP, β′HP, α′LP, β′LP, α′WP, and β′WP are the parameters to be estimated. We observe the latent variables if they are positive, but we observe zero if they are zero or negative. Our data exhibit a substantial amount of censoring. Table 3 shows the percentage of observations that take a value of zero for each child care measure. The lowest percentages in the table are 15% each for mothers’ primary and development-oriented child care, while the highest is 48% for fathers’ non-development-oriented care. Thus, estimation of a model that accounts for censoring is warranted.5
5
While some of the zeros in the data may not be “true” zeros in the sense that some parents who do not engage in the activity during the diary period may do so over a longer period of time, we cannot distinguish these parents from parents who in fact never perform any consequential amount of the activity. However, given that we have 48 hours of consecutive time diary data rather than the usual 24 hours provided by most time use surveys, any problem of ‘false zeros’ is likely to be smaller than that found in other surveys.
18
In our models, the error terms of the time use equations for a particular person are assumed to be jointly normally distributed with the following unrestricted covariance structure:
⎛ ⎡0⎤ ⎡ σ H2 ⎡ε HP ⎤ ⎜ ⎢ ε ⎥ ~ N ⎜ ⎢0 ⎥ , ⎢ ρ σ σ ⎢ HL H L ⎢ LP ⎥ ⎜⎜ ⎢ ⎥ ⎢ ⎢⎣ε WP ⎥⎦ ⎢ ⎥ ⎝ ⎣0⎦ ⎣ ρ HW σ H σ W
ρ HLσ H σ L σ L2 ρ LW σ Lσ W
ρ HW σ H σ W ⎤ ⎞⎟ ⎥ ρ LW σ Lσ W ⎥ ⎟ ⎥ ⎟⎟ σ W2 ⎦⎠
(4)
Results Table 4 provides raw correlations among our high-quality child care variables and selected household- and person-level characteristics. For both men and women, our four alternative measures of high-quality time – sole-tasked care, primary care, developmentoriented care, and active care – are all strongly positively and significantly associated with one another. The correlations cluster in the .5 to .9 interval, with only one correlation exceeding .9: that between primary minutes and active minutes. This is not surprising, given the method of construction of these two variables.6 Although our four measures of high-quality time appear to be strongly related, there is sufficient independent variance overall to support our treatment of them as distinct measures of quality. There are other statistically significant correlations among the household- and person-level characteristics and our measures of high-quality child care. First, a high level of education, as measured by the receipt of a bachelor’s degree or higher, is
6
The lower-quality counterparts to these two measures are not as strongly related (the correlation between secondary care and passive care is .56 for women and .44 for men). Due to space considerations, correlations for the different low-quality measures are not included in the table. However, these correlations are available upon request from the authors.
19
positively associated with high-quality care,for both genders.7 Second, quite surprisingly, it appears that parents in large families, those with four or more children, spend no more time engaged in high-quality child care than parents in smaller families.8 Finally, the presence of a very young or disabled child in the household is associated with higher levels of high-quality time by parents of both genders, although the associations are stronger for women.
Coefficient Estimates: Sole-Tasking versus Multi-Tasking We present the coefficient estimates from our correlated tobit models in Tables 5 through 8. Each table presents the results using a different measure of child care quality. Table 5 presents the results for the model in which the measure of high-quality child care is the number of minutes spent by the parent in sole-tasked care and the measure of lower-quality care is the number of minutes spent by the parent in multi-tasked care. In general, having additional children in the household appears to increase the amount of both high- and lower-quality child care time of both mothers and fathers. Having two or more dependent children appears to increase fathers’ work time, but having three or more dependent children appears to decrease mothers’ work time, perhaps reflecting movement towards traditional gender roles as the number of children increases. As the age of the youngest child in the household increases past age 4 for fathers and age 1 for mothers, the amount of sole-tasked child care time is reduced. As the age of the youngest child in the household increases past 9 for fathers and age 4 for mothers, 7
The finding that more educated individuals spend more time in both child care and market work has been documented elsewhere. For example, Kalenkoski, Ribar, and Stratton (2005, 2007) find positive relationships between education and both primary and secondary (or passive) child care and market work in the U.S. and the U.K., even after controlling for many other variables. 8
Similar associations (available upon request) are found when investigating correlations of observable characteristics with the lower-quality measures. These are not provided here for space reasons.
20
multi-tasked time is also reduced. These results may reflect older children’s reduced need for care. In addition, mothers increase their market work time as the age of the youngest child increases, although fathers’ hours of work are not statistically associated with the age of the youngest child in the household. Another variable which measures a household’s need for parental child care is an indicator for whether or not any adult in the parents’ household reports external child care to be difficult to find. Although this is a rather crude measure of the availability of outof-household child care, the estimated coefficients are positive and significant for both types of child care (high- and lower-quality), for both mothers and fathers. This variable is also negatively related to mothers’ market work time. Other measures of household needs are indicators for the presence in the household of a disabled child and the presence of a disabled adult. While the presence of a disabled child does not appear to affect parents’ time use, the presence of a disabled adult is positively associated with fathers’ multi-tasked child care time (perhaps because of the increased need to care for both children and the disabled adult at the same time) and negatively associated with mothers’ market work time. Variables which measure a household’s resources include an indicator for the number of other (non-guardian) related adults in the household and the count of women in the household. As these resources increase, we might expect a lessened child care time burden on parents, as child care can be shared with other available adults. As expected, the availability of other adults in the household reduces the sole- and multi-tasked child care time of both mothers and fathers and increases mothers’ market work time. The count of women is included as a separate variable because women tend to perform more
21
child care than men and so perhaps are a more accessible child care resource for parents. However, the estimated coefficients on this variable are not statistically significant. Education is positively related to parental provision of child care in Australian households, consistent with studies of the U.K. and the U.S. (see, for example, Kalenkoski, Ribar, and Stratton 2005, 2007). Not only is more time spent, but more educated parents appear to perform more of both high-quality and lower-quality child care than less educated parents. Several other variables are also important. Both mothers and fathers appear to work less on the weekends, as expected, but women spend less time in sole-tasked child care, and parents of both genders spend more time in multi-tasked care, on weekends than on weekdays. This may be a reflection of the fact that certain household- and leisure-oriented activities occur disproportionately on the weekends, when children are not at school or day care or engaged in child-oriented activities with stay-at-home parents. When a non-English language is spoken in the home, both mothers and fathers spend less time in lower-quality multi-tasked care, and mothers spend more time in market work. Older parents of both genders spend less time in both types of child care, even conditional on the age of the youngest child and the number of children in the household. This may be partly because the age distribution of their children is generally older, and older children require less care. Australian mothers work less than nonAustralian mothers. Finally, single parents appear to spend more time than married parents in multi-tasked care. Several interesting results are also found with respect to the unobserved determinants of the three uses of time. For both mothers and fathers, the estimated correlations between the unobserved determinants of market work time and time spent in
22
high-quality, sole-tasked child care (ρWH) are negative and highly statistically significant. Similar negative relationships are found between the unobserved determinants of market work and lower-quality, multi-tasked child care time (ρLW). These correlations perhaps reflect the time constraint which requires that time spent in one task be taken from another task. Finally, the estimated correlations between the unobserved determinants of time spent in high- and lower-quality care (ρLH)are positive, suggesting that the unobserved determinants of each of these uses of time may reflect, in part, the degree to which a given parent has a nurturing or child-oriented nature. Parents who spend more time in high-quality care may also spend more time in lower-quality care because they want to provide more care overall.
Coefficient Estimates: Alternative Definitions of Child Care Quality We now turn to a discussion of differences in the determinants of high- and lower-quality time once we change the way we measure child care quality. Table 6 presents the results from the model in which child care reported as a primary activity is considered to be high-quality care and child care reported as a secondary or tertiary activity is considered to be lower-quality care. The signs of the associations between the different explanatory variables and time spent in particular activities are mostly the same as those found when high-quality care is defined as sole-tasked care and lower-quality care is defined as multi-tasked care. The significance levels of the estimated coefficients are also broadly similar. However, there are exceptions. First, mothers spend more time in lower-quality secondary child care but not in lower-quality multi-tasked care when the age of the youngest child is between the ages of
23
2 and 4 than when the child is an infant. Second, the presence of a disabled child in the household increases a mother’s time spent in child care as a primary activity though it did not increase time spent in sole-tasked care. Third, while the presence of a disabled adult in the household once again is found to be associated with less market work by women, it is not associated significantly with fathers’ lower-quality child care time as it was using the multi-tasked care definition of lower-quality time. Fourth, an additional woman in the household reduces the amount of time a father spends in child care as a primary activity – a result that was not statistically significant when high-quality child care was defined as sole-tasked care. Fifth, although fathers do not appear to be spending more time in child care as a sole task on the weekends compared to weekdays, fathers do appear to spend more primary time as well as more secondary time caring for children on the weekends. Sixth, mothers spend less time in high-quality, primary child care when a non-English language is spoken in the home, a result not found using the sole-task measure of quality (although using both measures we find that women in these households also spend less lower-quality time with children). Seventh, Australian fathers spend significantly less time in secondary child care than non-Australian fathers, a result that was insignificant using the sole- versus multi-tasked care definition of child care quality. Finally, single parent status does not appear to affect primary child care time, secondary child care time, or market work time, although single parents were found to engage in more multi-tasked care. In sum, these differences indicate that our first two approaches to measuring the quality of child care, while broadly similar, yield a slightly different overall picture regarding the correlates of child care time. In particular, the primary/secondary
24
distinction appears to highlight more underlying differences in parents’ behaviors and (perhaps) preferences regarding child care quality. Table 7 reports results from the model using our third approach to defining quality, where high-quality child care is defined as development-oriented care and lowerquality care is non-development-oriented care. Once again making the comparison to the sole-task/multi-task results in Table 5, we see that most but not all of the coefficients have the same sign but that there are even more differences in the significance of the estimates between Tables 5 and 7 (sole-tasked versus development-oriented care) than between Tables 5 and 6 (sole-tasked versus primary care). First, men are found to spend no more development-oriented time with children when there are two as opposed to one in the household, and no more non-development-oriented time with children when there are three as opposed to one in the household – although in Table 5 they were found to spend more sole-tasked and multi-tasked time, respectively, in these households. Both men and women living in non-English-speaking households are found to spend significantly less development-oriented time, although they appeared in Table 5 to spend no less sole-tasked time, than parents in English-speaking households. Australian men are also shown to spend less time in lower-quality, non-development-oriented activities than non-Australian men. A similar result was found with respect to multi-tasked care but the estimated coefficient was statistically insignificant. Single mothers are also found to spend more time in development-oriented activities, but statistically no more time in non-development oriented activities, than married mothers – the opposite of the pattern when sole-tasked care was used as the measure of high child care quality.
25
Regarding household-specific determinants of child care, mothers in households whose youngest child is between the ages of 2 and 4 spend significantly more nondevelopment-oriented time than those in households whose youngest child is under 2, mimicking the results found using secondary activity status to measure lower-quality care, but contrasting with the insignificant result found when using multi-tasked care as the measure of lower-quality care. Women’s engagement in high-quality, developmentoriented care is also significantly positively associated with the count of women in the household, again contrasting with the insignificant result using sole-tasked care as the measure of high child care quality. Fathers in households potentially stretched by the inability to find child care or by the presence of a disabled person do not appear to engage in more lower-quality, non-development-oriented care, although in Table 5 they were found to engage in more multi-tasked care in these types of households. Fathers are found to spend more development-oriented time on weekends than on weekdays, mimicking the result using primary versus secondary status as the indicator for quality but contrasting with the result using the sole- versus multi-tasked care quality definition. Finally, there are a few differences between Tables 5 and 7 with regard to the associations of parental age and education levels with the provision of high- versus lower-quality care. First, men who are between 45 and 55 years of age appear to invest significantly less high-quality, development-oriented time but statistically the same amount of non-development-oriented time compared to men less than 25 years of age. Using our sole- versus multi-tasked care definition of child care quality, this result was reversed: men in this age group invested less time in multi-tasked care, but the same amount of time in high-quality sole-tasked care. Women in this age group do not appear
26
to invest significantly less non-development-oriented time than the youngest age category, although Table 5 showed them to be investing less multi-tasked time. The estimated effect of education on fathers’ time also changes when the developmentoriented definition of high quality is used, with fathers who have completed only high school spending more time in development-oriented care and statistically the same amount of time in non-development-oriented care than fathers with no high school diploma, and fathers with vocational degrees spending more time in non-developmentoriented care and statistically the same amount of time in development-oriented care as fathers with no high school diploma. Again, both of these results were reversed using the sole- versus multi-tasked care definition of child care quality. Overall, using the development orientation of a child care activity to measure its quality yields results that are somewhat different than using the sole-tasked measure of high-quality care. We find in general that men’s provision of high-quality and lowerquality care is less responsive to household structure, that men are more inclined to change child care investment patterns depending on day of the week, and that men’s time use is affected differently by their education level and age, than when we use the soletasked care measure of high child-care quality. There appear to be wider differences between foreign and non-foreign households using the development-oriented definition of quality than using the sole-tasked definition, and single mothers’ additional investment of development-oriented time may reflect an attempt to reach a necessary threshold of this particular type of high-quality time for their children in the absence of another parent. Finally, while the correlation between the unobserved components of high- and lower-quality care is still positive as it is in the sole-task/multi-task classification, it is
27
insignificantly different from zero for mothers. Perhaps the observed variables better explain the individual-level heterogeneity in mothers’ development-oriented versus nondevelopment-oriented child care decisions and, as a result, there is less systematic variance in the unobserved components. Table 8 reports results from the model where high-quality care is defined as active child care for children ages 0 to 11 and lower-quality care is passive care of children in this age group. Comparing these results against those in Table 5, there are a number of differences in significance levels as well as a few significant sign changes. In particular, mothers in households where the youngest child is between 2 and 9 years of age appear to be providing significantly more passive care than mothers in households with babies and toddlers, although less multi-tasked care is provided by these women (and significantly less when the youngest child is 5 to 9 years of age). Further, this pattern of more lowerquality passive care by mothers in households with youngest children in the 2 to 9 age group is also evident for fathers. In addition, fathers’ provision of lower-quality passive care is less responsive to the number of dependent children in the household, the presence of a disabled person in the household, whether a non-English language is spoken in the home, and the father’s own education level than when we defined lower-quality care as multi-tasked care. However, fathers’ provision of this lower-quality care is now significantly positively associated with the count of women in the household. Women’s provision of lower-quality passive care is also positively related to the count of women in the household, and positively related to the presence of a disabled child in the household. Neither of these effects was significant using the sole- versus multi-tasked definition of child care quality. In addition, women’s lower-quality passive care is also generally less
28
related to education level than was the case using the multi-tasked definition of lowerquality care, except that holding a certificate or diploma is now associated for women with significantly less lower-quality (passive) care than not having graduated from high school, whereas it was associated with significantly more lower-quality multi-tasked care in Table 5. The remaining differences between the active/passive and sole-task/multi-task results include a positive and significant effect on mothers’ passive care minutes of having two dependent children rather than one in the household, a negative and significant effect of being in a non-English speaking household on minutes of highquality active care by mothers, and no effect for fathers on active care minutes of holding a vocational or trade qualification compared to having no high school degree. Correlations among the unobserved components of the three equations are all of the same sign as found in Table 5.
Marginal Effects In the preceding two sections we document differences in the determinants of high- and lower-quality child care time using each of our four proposed measures of quality. However, it is more economically relevant to consider differences in the estimated marginal effects of parental and household attributes on these uses of time. Table 9 reports the marginal effects of the explanatory variables for fathers. Differences across the measures of child care quality are readily apparent, particularly across the measures of lower-quality care. For example, a second child in a household leads to increases in fathers’ multi-tasked care, secondary care, and passive care of 6 to 8
29
minutes, but increases non-development-oriented care by just over 14 minutes. Even more striking is the much larger negative impact of father’s age on passive child care compared with all other conceptualizations of lower-quality care: fathers who are 55 or over, for example, spend almost 250 fewer minutes in passive care than fathers under 25 but only spend between 99 and 170 fewer minutes than young fathers on multi-tasked, secondary, or non-development-oriented care. Single fathers are also estimated to spend much more time in passive care compared to married fathers than is true when we look at other types of lower-quality care. With respect to children’s ages there is a steeper response profile of fathers’ passive care to the age of the youngest child in the household. While fathers’ passive care is estimated to decline precipitously – by almost 180 minutes – when the youngest child reaches 10 years old, lower-quality care of all other sorts declines by only 25 to 37 minutes. This is a function of the way that passive care is defined (as occurring only with children 0 to 11 years of age present). Fathers’ child care time is also more responsive on weekends when we define lower-quality care as passive care and high-quality care as development-oriented care. Table 10 displays marginal effects for women. Older mothers show much lower provision of passive care than of multi-tasked, secondary, or non-development-oriented care compared to younger mothers. We also see that mothers in households with two dependent children appear to spend much more lower-quality time than mothers with one child when quality is defined as passive care (almost 27 minutes more) than when it is defined as multi-tasked (7 minutes more), secondary (12 minutes more), or nondevelopment-oriented (1 minute more) care. The presence of other adults in the household is associated with 182 fewer minutes of passive care by mothers, but only 63
30
to 83 fewer minutes of multi-tasked or secondary care (and 2 minutes more of nondevelopment-oriented care). Compared to mothers aged under 25, older mothers contribute less high-quality time when we measure quality using development orientation, relative to using any other definition, and they also contribute relatively less lower-quality time using every other definition of quality. This leads to a profile wherein older mothers appear disproportionately to sacrifice higher-quality time if we define quality using development orientation of the activity – but not using other definitions. Despite these differences, we can see overall patterns in parents’ provision of high- and lower-quality child care in Tables 9 and 10. In general, as the number of children in a household increases, parents devote more of both sorts of time, but particularly more lower-quality care – with the exception of mothers’ provision of development-oriented care, which increases comparably to if not more than their provision of non-development-oriented care as the number of children increases. More lower-quality care from both parents is evident on the weekends. In addition, fathers perform more but mothers perform less high-quality care on weekends. Having additional adults present in the household is generally associated with less parental care of all sorts, with the exception that mothers do not sacrifice lower-quality nondevelopment-oriented care when more adults are present. In households where child care is difficult to find, parents of both genders perform more care of both sorts, but this additional care is of disproportionately lower quality; the only exception is fathers who provide more development-oriented care than non-development-oriented care in response to such difficulty.
31
As the youngest child in a household ages, parents of both genders perform less high-quality care. There is also evidence of a pattern in which parents perform more lower-quality care when the youngest child is aged 2 to 9 and then much less lowerquality care after that, compared to parents in households with babies and toddlers. Single parents of both genders perform more care of both types but disproportionately more lower-quality care, with one exception: single mothers devote disproportionately more time to development-oriented care than non-development-oriented care. Finally, in general, parental education raises parental provision of child care time, although this increase is disproportionately in lower-quality care provision. The two exceptions to this statement are with regard to mothers’ provision of passive care (where mothers with certificates or diplomas or other qualifications reduce their lower-quality care) and provision of development-oriented care by fathers with bachelor’s degrees or higher (where provision of extra care is disproportionately targeted towards high-quality care).
Conclusion In this paper, we estimate correlated tobit models of high-quality child care time, lower-quality child care time, and the amount of market work time spent by Australian parents in 1992 and 1997, using data from two Australian time-diary studies and four alternative definitions of child care quality. We estimate these models separately by gender and find that different definitions of the quality of child care time appear to capture conceptually different aspects of parental time with children. Our paper has suggested four ways of conceptualizing and measuring the quality of child care time spent by parents. Our results indicate that which measure of quality is
32
chosen matters significantly to results and interpretation. We hope that this work will motivate other time-use researchers and policy makers concerned with the effect of parental child care time on children’s outcomes or parents’ costs to appropriately consider the quality of such time.
33
References Amato, Paul, and Fernando Rivera. “Paternal Involvement and Children’s Behavior Problems.” Journal of Marriage and the Family 61 (May 1999): 375-384. Becker, Gary. “A Theory of the Allocation of Time.” Economic Journal 75 (September 1965): 493-517. Becker, Gary S. “Human Capital, Effort, and the Sexual Division of Labor.” Journal of
Labor Economics, January 1985, 3 (Part 2), pp. S33-S58. Bianchi, Suzanne M. “Maternal Employment and Time with Children: Dramatic Change or Surprising Continuity?” Demography 37 (November 2000): 401-414. Bryant, W. Keith, and Cathleen Zick. “An Examination of Parent-Child Shared Time.”
Journal of Marriage and the Family 58 (February 1996): 227-237. Coleman, James S. “Social capital in the creation of human capital.” American Journal of
Sociology 94 (1988): S95-S120. Craig, Lyn. “How Employed Mothers in Australia Find Time for Both Market Work and Childcare.” Journal of Family and Economic Issues 28 (2007): 69-87. Datcher-Loury. “Effects of Mother’s Home Time on Children’s Schooling.” Review of
Economics and Statistics 70 (August 1988): 367-373. Folbre, Nancy, Jayoung Yoon, Kade Finnoff, and Allison Sidle Fuligni. “By What Measure?: Family Time Devoted to Children in the United States”. Demography 42(2) (May 2005): 373-390. Hallberg, Daniel and Anders Klevmarken. “Time for Children: A Study of Parent’s Time Allocation.” Journal of Population Economics 16 (2003): 205-226.
34
Kalenkoski, Charlene, David Ribar, and Leslie S. Stratton. “Parental Child Care in Single Parent, Cohabiting, and Married Couple Families: Time Diary Evidence from the United Kingdom.” American Economic Review 95(2) (May 2005): 194-198. Kalenkoski, Charlene, David Ribar, and Leslie S. Stratton. “The Effect of Family Structure on Parents’ Child Care Time in the United States and the United Kingdom.” Review of Economics of the Household (forthcoming). Kimmel, Jean, and Rachel Connelly. “Mothers’ Time Choices: Caregiving, Leisure, Home Production, and Paid Work.” Journal of Human Resources (2007 forthcoming). Kooreman, Peter, and Arie Kapteyn. “A Disaggregated Analysis of the Allocation of Time within the Household.” Journal of Political Economy 95 (April 1987): 223249. Lamb, M., J. Pleck, E. Charnov and J. Levine. “Paternal Behavior in Humans.”
American Zoologist 25 (1985): 883-894. Landefeld, J. Steven, Barbara M. Fraumeni, and Cindy M. Vojtech. ”Accounting for Nonmarket Production: A Prototype Satellite Account using the American Time Use Survey.” Unpublished manuscript. December 2005. Muller, Chandra. “Maternal Employment, Parent Involvement, and Mathematics Achievement among Adolescents.” Journal of Marriage and the Family 57 (February 1995): 85-100. Nock, Steven, and Paul Kingston. “Time with Children: The Impact of Couples’ WorkTime Commitments.” Social Forces 67 (September 1988): 59-85.
35
Sandberg, John F. and Sandra L. Hofferth. “Changes in Children’s Time with Parents: United States, 1981-1997.” Demography 38(3) (August 2001): 423-436. Sandberg, John F. and Sandra L. Hofferth. “Changes in Children’s Time with Parents: A Correction.” Demography 42(2) (May 2005): 391-395. Shaw, Daniel S. and Richard Q. Bell. “Developmental theories of parental contributors to antisocial behavior.” Journal of Abnormal Child Psychology 21 (5) (October 1992): 493-518. Stafford, Frank P. “Women’s Work, Sibling Competition, and Children’s School Performance.” American Economic Review 77 (1987): 972-980. Stafford, Frank and W. Jean Yeung. “The Distribution of Children’s Developmental Resources.” Unpublished manuscript. February 2004. Yeung, W. Jean and Frank Stafford. “Days of the Week: Distribution of Parental Childcare Time.” Unpublished manuscript. 2006.
36
Figure 1: Fathers' Average Child Care Time by Quartile of Total Child Care Time Spent
700
600
500
400 Average Minutes Spent 300
200
100
Q4 Q3
0
Q2 Total
Sole-task
Primary
Type of Care
37
Q1 Active
Dev'pment
Figure 2: Mothers' Average Child Care Time by Quartile of Total Child Care Time Spent
1400
1200
1000
800 Average Minutes Spent 600
400
200
Q4 Q3
0
Q2 Total
Sole-task
Primary
Type of Care
38
Q1 Active
Dev'pment
Table 1: Sample Sizes
Fathers (includes step-fathers and guardians) Mothers (includes step-mothers and guardians) TOTAL adults
Year = 1992 Year = 1997 Combined Years 1872 1548 3420 2376 1932 4308 4248 3480 7728
39
Table 2: Descriptive Statistics for the 1992-1997 Combined Sample Outcomes (means and standard deviations across persons) Total minutes spent in sole-tasked child care
Fathers 51.83 (87.36) 85.17 (121.59) 76.59 (118.21) 125.02 (173.49) 743.62 (529.04) Fathers 0.99 0.01 0.71 0.10 0.01 0.28 0.45 0.20 0.06 0.28 0.10 0.01 0.14 0.33 0.15 0.11 Fathers 1.19 (.55) 0.47 (.77) 0.66 (.82) 0.88 (.84) 0.35 (.66) 0.10 (.37) 0.56 0.57 0.29 0.14 0.21 0.30 0.39 0.20 0.11 0.23 0.21 0.24 0.24 0.65 0.20 0.01 0.00 0.07 0.29 0.55 0.45 3420
Total minutes spent in primary child care Total minutes spent in active child care Total minutes spent in development-oriented child care Total minutes spent in market work-related activities Person-level Explanatory Variables (proportions of persons) Married or co-habiting^ Single Australian Speaks language other than English at home Age 15-25^ Age 25-35 Age 35-45 Age 45-55 Age 55+ Did not complete high school^ High school terminating Other post-high school educational qualification Certificate or diploma Vocational/trade qualification Bachelor’s degree or higher No industry or occupation information Household-level Explanatory Variables Count of women in the household Count of persons aged 15-24 in the household Count of persons aged 25-34 in the household Count of persons aged 35-44 in the household Count of persons aged 45-54 in the household Count of persons aged 55 or older in the household Number of weekend days included in survey Metropolitan area^ Non-metropolitan urban area Rural area 1 if anyone in the household reports difficulty in finding child care Household has one dependent child^ Household has two dependent children Household has three dependent children Household has four or more dependent children Age of youngest child in household is less than 2 years^ Age of youngest child in household is 2 to 4 years Age of youngest child in household is 5 to 9 years Age of youngest child in household is greater than 9 years Household type: One married/de facto couple with children 0 -14 only Household type: One married/de facto couple with children 0 - 14 and 15+ Household type: One person with children 0 - 14 only Household type: One person with children 0 - 14 and 15+ Household type: All other households^ Indicator for other adults (age 15+) in the household Year = 1992 Year = 1997 Number of Observations
Mothers 160.33 (179.62) 241.25 (242.46) 221.53 (245.13) 320.61 (317.29) 249.46 (382.43) Mothers 0.85 0.15 0.75 0.09 0.05 0.36 0.43 0.14 0.02 0.44 0.12 0.02 0.22 0.11 0.09 0.42 Mothers 1.24 (.54) 0.46 (.77) 0.61 (.79) 0.79 (.81) 0.30 (.61) 0.10 (.37) 0.56 0.56 0.31 0.13 0.23 0.31 0.39 0.19 0.10 0.21 0.21 0.23 0.23 0.56 0.16 0.09 0.03 0.09 0.28 0.55 0.45 4308
Notes: The maximum number of minutes spent for each person on any activity is 2,880, which is the total number of minutes in a 48-hour period. Variables with carrots (^) form part of the left-out category in ensuing regression models.
40
Table 3: Percent of Observations where Measure of Child Care Takes a Value of Zero Child Care Measure Fathers Mothers Total child care minutes 24% 12% Sole-task care 42% 18% Multi-task care 32% 16% Primary care 33% 15% Secondary care 41% 22% Active care 40% 25% Passive care 21% 21% Development-oriented care 32% 15% Non-development-oriented care 48% 24%
41
Table 4: Raw Correlations (total N=7728) Panel A: Fathers (N = 3420) Total child care minutes Sole-task child care minutes Primary child care minutes Development-oriented child care minutes Active child care minutes Did not complete high school Bachelor’s degree or higher Four or more dependent children in the household Disabled child present in the household Youngest child in the household under 2 years old Panel B: Mothers (N = 4308) Total child care minutes Sole-task child care minutes Primary child care minutes Active child care minutes Development-oriented child care minutes Did not complete high school Bachelor’s degree or higher Four or more dependent children in the household Disabled child present in the household Youngest child in the household under 2 years old
Total Child Care Minutes 1.0000 0.5175 *** 0.6164 *** 0.6906 *** 0.6147 *** -0.0923 *** 0.1171 *** 0.0158 0.0673 *** 0.2096 ***
Sole-task Minutes
Total Child Care Minutes 1.0000 0.6370 *** 0.7200 *** 0.7277 *** 0.7415 *** -0.1342 *** 0.0639 *** 0.0055 0.0899 *** 0.4550 ***
Sole-task Minutes
1.0000 0.8628 *** 0.5205 *** 0.8449 *** -0.0642 *** 0.0912 *** 0.0082 0.0469 *** 0.1973 ***
1.0000 0.8790 *** 0.8626 *** 0.6287 *** -0.1177 *** 0.0357 ** -0.0057 0.0896 *** 0.4568 ***
Primary Minutes
1.0000 0.6385 *** 0.9723 *** -0.0692 *** 0.1044 *** 0.0028 0.0500 *** 0.2623 *** Primary Minutes
1.0000 0.9750 *** 0.7605 *** -0.1206 *** 0.0437 *** -0.0018 0.0776 *** 0.5545 ***
Notes: Correlations significant at the 1% level are tripled-starred; those significant at the 5% level are doubled-starred; and those significant at the 10% level are single-starred.
42
Development Oriented Minutes
1.0000 -0.0811 *** 0.1116 *** 0.0169 0.0472 *** 0.2230 *** Development Oriented Minutes
1.0000 -0.1041 *** 0.0429 *** 0.0139 0.0732 *** 0.5006 ***
Active Minutes
0.6439 *** 1.0000 -0.0765 *** 0.1018 *** 0.0049 0.0556 *** 0.2954 *** Active Minutes
1.0000 0.7711 *** -0.1206 *** 0.0422 *** 0.0024 0.0764 *** 0.5802 ***
Table 5: Correlated Tobit estimates - Higher Quality Measured as Sole-Tasking Minutes of Time Minutes of Time in Sole-Tasked (Higherin Multi-Tasked (LowerQuality) Care Quality) Care Fathers Mothers Fathers Mothers Intercept
-3.5078 (33.3292)
Two dependent children
24.1857 (6.1009)
Three dependent children
12.2252 (7.9505)
Four dependent children
46.8837 (8.9552)
Number of weekend days included
1.5342 (3.5025)
Non-metropolitan urban area
-10.4100 (5.9001)
Rural area
-7.0641 (8.5972)
Count of women in the household
Minutes of Time in Market Work Fathers
Mothers
171.5883 (33.9690)
***
147.4160 (82.4166)
*
109.9973 (77.7116)
1045.5093 (133.9949)
***
613.8489 *** (117.4919)
17.2859 (7.0632)
***
21.9691 (15.5999)
*
16.8287 (16.3013)
79.6656 (23.2288)
***
34.0568 (25.8790)
56.5374 (8.8289)
***
32.0599 (18.8674)
*
70.1626 (20.2509)
***
87.1812 (27.5840)
***
-57.3161 (31.7598)
*
42.7417 (10.5588)
***
81.0303 (22.9010)
***
85.5721 (25.7533)
***
8.5026 (32.5317)
-80.1826 (42.3965)
*
-22.1504 (4.0065)
***
71.9248 (8.4442)
***
27.4457 (8.7975)
***
-397.2422 (12.7908)
***
-267.4596 (14.5875)
***
-21.5222 (6.7757)
***
23.9530 (14.7998)
-9.7304 (15.4453)
-44.8889 (21.4438)
**
-3.2306 (24.1560)
-2.5720 (9.9129)
4.0578 (19.7918)
62.7805 (21.0578)
-10.5193 (8.3123)
10.8136 (8.6452)
-22.5766 (20.5486)
Indicator for disabled child present in the household
-3.6880 (7.5008)
13.3375 (8.2216)
-21.7154 (18.2062)
Indicator for disabled person present in the household
0.2443 (7.0906)
0.4540 (7.2904)
34.3417 (16.0659)
Indicator for other adults (age 15+) in the household
-87.6299 (16.1659)
***
-96.3726 (18.4805)
***
Indicator for “child care reported to be difficult to find”
21.7510 (5.8422)
***
25.7168 (6.6928)
Youngest child in household is of age 2 to 4
1.9924 (6.8887)
-79.6043 (7.6210)
Youngest child in household is of age 5 to 9
-29.7369 (7.7093)
Youngest child in household is of age 10 to 14
-53.6706 (9.2949)
Indicator for non-English language spoken in home
11.0925 (10.0987)
Person reporting is of age 25-35
-43.4900 (26.2248)
*
-93.8546 (19.8949)
Person reporting is of age 35-45
-49.1555 (27.7462)
*
Person reporting is of age 45-55
-30.7061 (31.8838)
Person reporting is 55 or older
-64.5280 (35.1434)
Person reporting completed high school only
9.7362 (9.7415)
31.2540 (9.6600)
Person reporting has other post-school qualification
30.3509 (27.1771)
-7.3331 (24.8120)
Person reporting has a vocational or trade qualification
11.1984 (6.5864)
*
27.1619 (9.6229)
Person reporting holds certificate or diploma
17.5643 (9.1320)
*
Person reporting holds a bachelor’s degree or higher
31.9732 (9.3169)
***
Person reporting is Australian
-10.1254 (6.2622)
-9.3180 (7.8842)
-24.3757 (15.3804)
Person reporting is single
27.9475 (42.9932)
14.8895 (20.1684)
163.1370 (94.0582)
*
***
***
***
*
-23.9546 (30.1458)
-42.9889 (33.5174)
19.9369 (22.1792)
0.0874 (26.2290)
8.4842 (27.9061)
15.4626 (19.1669)
-32.0326 (29.5252)
-15.1134 (33.3864)
**
-25.7525 (17.6349)
-33.4475 (24.3814)
-50.6501 (29.0583)
*
-179.6293 (41.2510)
***
-212.1880 (45.0840)
***
-6.6329 (57.4442)
119.2897 (63.8812)
*
***
31.3322 (14.7989)
**
68.9201 (15.1320)
***
-26.2416 (23.1771)
-91.4740 (27.5845)
***
***
3.7239 (17.7320)
-10.4761 (17.2169)
-1.6602 (26.6773)
124.5230 (31.4773)
***
***
-123.8962 *** (9.3684)
-6.3170 (18.3477)
-160.9054 (19.7750)
***
36.6320 (28.2195)
136.4403 (34.9946)
***
***
-165.3923 *** (11.4846)
-102.7827 (22.4193)
***
-299.4206 (25.1935)
***
44.4839 (31.6367)
165.9381 (37.7686)
***
-15.3957 (11.7490)
-133.2876 (26.4808)
***
-120.2729 (26.6639)
***
-7.5329 (34.5764)
100.6130 (43.3752)
**
***
-177.5383 (62.6802)
***
-165.6054 (42.8373)
***
111.4003 (119.0636)
-69.1057 (74.6807)
-139.2369 *** (21.2397)
-302.9172 (67.1931)
***
-160.4761 (47.8567)
***
108.2640 (124.2917)
-62.1119 (80.1209)
-175.6873 *** (26.1486)
-254.7220 (73.0523)
***
-250.6265 (58.9983)
***
-31.8760 (131.2119)
-15.9346 (90.7255)
-336.0682 *** (36.3196)
-473.2793 (90.8457)
***
-373.9665 (76.6633)
***
-117.3842 (148.0418)
-119.3495 (127.5131)
55.0765 (21.2708)
***
90.2642 (22.2289)
***
-19.6221 (32.6831)
-10.7348 (34.2695)
163.6255 (120.8252)
-147.1562 (95.5878)
*
***
15.1863 (89.5580)
61.8085 (51.6306)
***
28.4762 (17.8980)
72.0262 (23.8424)
***
45.3418 (24.6816)
*
12.3139 (35.5239)
37.8440 (8.0491)
***
51.8576 (22.0184)
***
82.9445 (17.8452)
***
72.6447 (30.2281)
***
26.6371 (27.8969)
60.8072 (11.2355)
***
101.0881 (23.1507)
***
194.3528 (25.6127)
***
-3.5613 (33.6122)
56.0536 (39.3138)
-12.3796 (22.7621)
-60.6471 (27.2700) 83.6569 (60.9573)
σH 114.6863 (1.4607)
***
N Log likelihood = -116448.2499
3420
***
25.3988 (17.7734) 77.9269 (40.2946)
*
77.3654 (173.1601)
387.5723 ( 5.0375)
***
463.8932 (6.1450)
-0.2765 (0.0209)
***
0.2820 (0.0205)
σL 160.6664 (1.3696)
***
301.9178 (3.9781)
-0.2623 (0.0249)
***
-0.2840 (0.0207)
ρWH -0.2449 (0.0218)
***
σW
ρLW
4308
3420
***
**
***
502.0304 (10.6560)
***
0.1607 (0.0166)
***
ρLH
4308
3420
***
4308
Notes: Coefficient estimates, not marginal effects, are reported in this table. Correlations are allowed across outcomes but not across gender. Excluded dummy categories are one dependent child in the household; metropolitan area; youngest child in household is under 2 years old; person reporting is of age 15 to 25; person reporting is legally married or de facto married; and person reporting did not complete high school. Variables which are controlled in the regressions but whose estimated coefficients are not reported are occupation (3 categories) and industry (6 categories), and a dummy for no occupation or industry reported; household type (five categories); quarter and year effects (eight categories); and the count of the total number of women and the total number of persons in the household in each of six age ranges. Estimated coefficients significant at the 1% level are triple-starred; those significant at the 5% level are double-starred, and those significant at the 10% level are single-starred.
43
Table 6: Correlated Tobit estimates - Higher Quality Measured as Primary Activity Minutes of Time Minutes of Time Minutes of Time in Primary (Higher-Quality) in Secondary (Lower-Quality) in Market Work Care Care Fathers Mothers Fathers Mothers Fathers Mothers Intercept
106.4659 (35.8690)
***
245.1131 (38.1792)
Two dependent children
23.9552 (7.2711)
***
6.4733 (8.5086)
Three dependent children
9.0803 (9.4890)
Four dependent children
49.4475 (10.5216)
Number of weekend days included
7.4863 (4.0715)
Non-metropolitan urban area
***
-30.9563 (92.6193)
0.7734 (79.9969)
21.1248 (16.2400)
30.7294 (16.3617)
1047.8497 *** (132.6794)
591.3512 *** (116.3164)
*
79.5994 (23.0296)
***
33.9200 (25.7527)
***
-58.9361 (31.6821)
*
-77.9042 (42.0812)
* ***
62.1622 (10.2884)
***
40.6384 (19.8209)
**
72.1698 (20.4758)
***
87.1505 (27.4943)
***
34.3516 (12.6408)
***
79.7349 (24.1684)
***
105.7019 (25.5596)
***
9.6107 (32.6554)
*
-31.8974 (4.7965)
***
73.8984 (8.7978)
***
40.3407 (8.6975)
*** -397.3728 (12.7284)
***
-266.0439 (14.6133)
-8.6804 (7.1868)
-34.2367 (8.0211)
***
28.9752 (15.4712)
*
3.7594 (15.4311)
-44.3315 (21.4697)
**
-5.1043 (24.0658)
Rural area
-14.9838 (10.2295)
-13.9708 (12.4066)
18.7935 (20.8942)
74.9112 (20.3292)
Count of women in the household
-18.0866 (10.2837)
11.5901 (10.2145)
-14.6480 (21.7273)
Indicator for disabled child present in the household
-6.3676 (9.3739)
18.6880 (10.1939)
Indicator for disabled person present in the household
9.4509 (7.8362)
-1.2832 (9.3017)
Indicator for other adults (age 15+) in the household
-85.4401 (18.7180)
***
Indicator for “child care reported to be difficult to find”
21.0288 (6.9567)
***
Youngest child in household is of age 2 to 4
-9.5508 (7.9756)
Youngest child in household is of age 5 to 9
-52.0658 (9.2293)
Youngest child in household is of age 10 to 14
-83.9874 (11.0599)
Indicator for non-English language spoken in home
-1.9743 (11.6935)
Person reporting is of age 25-35
-115.7463 (30.3996)
Person reporting is of age 35-45
*
*
-157.0252 *** (21.7735)
***
-24.4590 (30.0150)
-41.5107 (33.5362)
22.0810 (23.1607)
-0.2932 (26.1076)
7.9539 (27.7454)
-24.3669 (19.1238)
14.8995 (19.4165)
-31.0320 (29.4983)
-11.1352 (33.3842)
23.5976 (16.8395)
-23.9976 (17.3917)
-33.8456 (24.2723)
-53.4825 (28.9291)
*
-196.5684 (45.2159)
***
-165.4700 *** (47.5956)
-6.5136 (57.6943)
121.6138 (63.9665)
*
***
38.4790 (15.6205)
***
56.4390 (14.9534)
***
-26.0736 (23.0551)
-93.1176 (27.8359)
***
-142.2749 *** (9.3554)
22.1053 (18.8321)
53.3430 (17.4945)
***
-1.5343 (26.5075)
136.7206 (31.8611)
***
***
-199.4031 *** (11.1891)
27.2382 (19.2279)
-87.9466 (20.0378)
***
36.0892 (28.2404)
143.4810 (35.3080)
***
***
-242.2373 *** (13.5199)
-75.3928 (23.3626)
***
-242.0510 *** (25.0083)
43.6532 (31.6576)
174.3089 (38.1313)
***
-43.3758 (14.1630)
***
-145.0301 (27.7293)
***
-116.0976 *** (26.6527)
-8.8272 (34.4954)
99.2860 (43.4148)
**
***
-114.7302 *** (21.0246)
-96.8689 (74.0903)
-155.1648 *** 109.6470 (45.0686) (116.6000)
-65.4580 (74.6768)
-146.1006 (32.0474)
***
-167.0990 *** (24.1465)
-209.5071 (77.7470)
***
-134.0270 *** 105.6185 (49.0937) (121.3118)
-52.1732 (80.5487)
Person reporting is of age 45-55
-135.0614 (36.7859)
***
-217.2199 *** -154.5613 (28.7846) (83.12966)
*
-240.7821 *** -35.1005 (59.2733) (128.5722)
-8.8419 (90.8546)
Person reporting is 55 or older
-194.6353 (37.3643)
***
-388.4263 *** -405.2920 (37.3262) (101.2238)
***
-308.1084 *** -120.2716 (77.0495) (146.2561)
-103.0619 (131.1786)
Person reporting completed high school only
3.2904 (11.3042)
50.1136 (11.5012)
***
70.8964 (21.5572)
-19.4194 (32.6454)
-9.6919 (34.0818)
Person reporting has other post-school qualification
1.9553 (35.6809)
3.9220 (28.1424)
163.1908 (119.8734)
-150.4270 (95.3171)
Person reporting has a vocational or trade qualification
9.7170 (8.2416)
35.0876 (12.3384)
***
34.5550 (18.7803)
*
66.4906 (22.9716)
***
44.7611 (24.6443)
*
12.7691 (35.5251)
Person reporting holds certificate or diploma
21.3780 (10.5376)
**
49.2990 (9.4670)
***
51.1175 (23.0687)
**
72.8926 (18.1127)
***
71.7146 (29.9864)
**
25.9351 (27.8735)
Person reporting holds a bachelor’s degree or higher
37.5324 (10.9145)
***
96.7812 (13.1267)
***
102.6393 (24.1392)
***
164.4833 (26.1927)
***
-4.9374 (33.4189)
52.0810 (39.3386)
Person reporting is Australian
-8.3004 (7.7841)
-4.2204 (9.5439)
-29.9644 (15.9590)
*
16.8844 (17.4352)
-12.6876 (22.7426)
-63.2124 (27.1193)
Person reporting is single
55.8883 (63.7259)
34.7830 (22.2684)
161.3407 (111.8678)
65.9608 (43.4212)
75.6346 (169.2342)
86.0288 (60.8371)
40.3040 (8.0278)
***
69.9623 (21.9147) 59.1919 (91.4267)
***
200.0439 (1.9061)
***
308.3005 (4.4129)
-0.3285 (0.0223)
***
-0.2532 (0.0219)
ρWH -0.2683 (0.0205) N Log likelihood = -116815.5773
3420
***
64.5180 (51.3441)
σL
σH 144.2069 (1.8721)
***
***
σW 382.5286 (5.0980)
***
463.4574 (6.1588)
-0.2231 (0.0222)
***
0.2602 (0.0204)
ρLW
4308
3420
***
***
***
502.3670 (10.6687)
***
0.1572 (0.0167)
***
ρLH
4308
3420
***
4308
Notes: Coefficient estimates, not marginal effects, are reported in this table. Correlations are allowed across outcomes but not across gender. Excluded dummy categories are one dependent child in the household; metropolitan area; youngest child in household is under 2 years old; person reporting is of age 15 to 25; person reporting is legally married or de facto married; and person reporting did not complete high school. Variables which are controlled in the regressions but whose estimated coefficients are not reported are occupation (3 categories) and industry (6 categories), and a dummy for no occupation or industry reported; household type (five categories); quarter and year effects (eight categories); and the count of the total number of women and the total number of persons in the household in each of six age ranges. Estimated coefficients significant at the 1% level are triple-starred; those significant at the 5% level are double-starred, and those significant at the 10% level are single-starred.
44
Table 7: Correlated Tobit estimates - Quality Measured as Child Development-Oriented Care Minutes of Time Minutes of Time Minutes of Time in Development-Oriented in Non Dev'pment-Oriented in Market Work (Higher-Quality) Care (Lower-Quality) Care Fathers Mothers Fathers Mothers Fathers Mothers Intercept
81.6359 (50.3522)
154.8582 (53.2696)
***
-47.9758 (97.5350)
Two dependent children
15.0070 (10.1346)
33.9949 (11.9577)
***
47.2893 (17.2058)
Three dependent children
19.5958 (12.5056)
94.7144 (13.9044)
***
33.4868 (21.2440)
Four dependent children
51.9158 (15.1440)
***
66.9337 (17.4764)
***
99.6178 (26.9795)
Number of weekend days included
27.8890 (5.7166)
***
-19.0302 (6.4424)
***
54.5471 (9.3475)
Non-metropolitan urban area
6.4361 (9.7147)
-33.0071 (10.5825)
***
5.8542 (16.3490)
-2.4395 (15.2600)
Rural area
6.2519 (13.3747)
-0.2961 (16.3994)
-25.5755 (22.1215)
47.9999 (19.6366)
Count of women in the household
-15.3651 (13.7088)
36.6095 (15.3648)
-18.0784 (24.5061)
Indicator for disabled child present in the household
-13.2254 (13.5193)
21.2016 (14.5592)
Indicator for disabled person present in the household
16.0854 (11.6576)
-6.8387 (13.0797)
Indicator for other adults (age 15+) in the household
-117.7068 (25.5507)
***
-174.2173 *** -229.6106 (31.6958) (50.1634)
Indicator for “child care reported to be difficult to find”
29.9151 (9.8373)
***
34.9206 (10.8461)
Youngest child in household is of age 2 to 4
0.5285 (11.5528)
Youngest child in household is of age 5 to 9
-24.9721 (12.3905)
Youngest child in household is of age 10 to 14
***
***
42.0921 (80.7799)
1049.7020 (132.3044)
***
617.6011 *** (115.2489)
3.5902 (16.0816)
80.0246 (22.8988)
***
33.8372 (25.7992)
***
-58.9616 (31.5938)
*
-78.1393 (41.9868)
*
44.4287 (19.9293)
**
87.1751 (27.6814)
***
72.3795 (24.9792)
***
8.9155 (32.5682)
***
17.1664 (8.3665)
**
-396.8279 (12.7851)
***
-266.6174 *** (14.6223)
-45.2898 (21.4661)
**
-1.2796 (24.0437)
-24.8484 (30.2124)
-44.0681 (33.6213)
6.2893 (23.5385)
0.1808 (26.1691)
7.1444 (27.8334)
-6.6003 (20.1837)
5.6504 (18.5775)
-31.7740 (29.4151)
-9.3715 (33.3850)
4.6145 (17.3896)
-24.1287 (17.1059)
-34.0216 (24.1457)
-51.5601 (29.0026)
*
***
***
-168.1260 (50.2100)
***
-9.6347 (57.2030)
113.4707 (63.8345)
*
***
25.8346 (16.1959)
74.3828 (14.6879)
***
-26.2436 (23.0824)
-90.4456 (27.4580)
***
-143.9919 *** (12.2524)
-2.1376 (19.7626)
71.4585 (16.6504)
***
-1.9869 (26.5906)
124.7878 (31.0009)
***
**
-217.7028 *** (14.1269)
-16.1604 (20.9351)
-51.7989 (19.6573)
***
36.0924 (28.2776)
132.8042 (34.5368)
***
-76.8457 (14.6097)
***
-269.3115 *** -128.9845 (16.2370) (26.0484)
***
-209.2604 (27.3355)
***
43.8789 (31.4227)
162.5099 (37.5062)
***
Indicator for non-English language spoken in home
-28.5003 (16.0164)
*
-68.8599 (18.6077)
-94.0741 (30.9833)
***
-87.8135 (26.5197)
**
-6.4630 (34.9884)
99.7228 (43.2882)
**
Person reporting is of age 25-35
-91.1458 (38.0376)
***
-187.7707 *** -171.5256 (31.2692) (80.0543)
**
-72.5366 (48.1679)
106.5337 (117.5640)
-68.8133 (73.8631)
Person reporting is of age 35-45
-187.4535 (41.5518)
***
-241.6190 *** -211.3549 (34.3546) (83.6605)
***
-46.4445 (51.8729)
105.9511 (122.6161)
-62.2239 (79.6064)
Person reporting is of age 45-55
-174.5507 (45.5011)
***
-332.0589 *** -130.5923 (42.3966) (92.3701)
-88.2962 (61.3113)
-32.0784 (128.9265)
-13.1742 (89.4648)
Person reporting is 55 or older
-262.6340 (51.2822)
***
-539.0522 *** -308.8472 *** (55.1484) (113.3175)
-173.4566 (75.1847)
**
-117.6653 (146.6964)
-105.0746 (129.6172)
Person reporting completed high school only
28.7395 (15.5487)
*
63.9621 (15.2962)
28.3984 (23.9933)
75.5237 (22.0212)
***
-20.5596 (32.5683)
-9.4215 (34.1455)
Person reporting has other post-school qualification
3.3386 (56.1921)
30.1564 (43.6843)
41.1836 (93.0961)
26.9646 (45.1764)
162.7819 (127.4391)
-141.7033 (98.4860)
Person reporting has a vocational or trade qualification
6.9144 (11.5412)
43.2147 (17.5867)
***
50.1804 (19.9482)
***
62.0707 (21.7533)
***
45.1488 (24.5394)
*
18.1686 (35.7560)
Person reporting holds certificate or diploma
39.6954 (14.2863)
***
51.9734 (12.2154)
***
49.2827 (24.8085)
**
78.5995 (17.7116)
***
71.8705 (30.0071)
***
25.9283 (27.6973)
Person reporting holds a bachelor’s degree or higher
74.2663 (15.5640)
***
120.5963 (18.5837)
***
64.6242 (24.7192)
***
145.3010 (25.4612)
***
-4.8597 (33.4309)
52.6373 (39.1765)
Person reporting is Australian
-5.9675 (10.8503)
8.7808 (12.9142)
-31.5708 (16.8211)
*
9.0665 (17.5013)
-12.0910 (22.8723)
-63.6212 (27.0564)
Person reporting is single
38.5080 (70.5016)
65.0701 (30.6331)
**
241.5866 (96.3548)
***
43.8271 (44.8946)
75.0004 (174.0924)
81.4233 (60.8909)
272.1916 (3.0554)
*** 311.7674*** *** (4.6575)
-0.3105 (0.0214)
***
***
***
σL
σH 198.8443 (2.3677)
***
ρWH -0.2348 (0.0221) N Log likelihood = -116363.2608
3420
***
σW 373.3684 (4.8065)
***
463.2459 (6.1633)
-0.1942 (0.0228)
***
0.1398 (0.0252)
ρLW
4308
-0.2811 (0.0215) 3420
***
***
***
500.9471 (10.5744)
***
ρLH
4308
3420
***
0.0223 (0.0186) 4308
Notes: Coefficient estimates, not marginal effects, are reported in this table. Correlations are allowed across outcomes but not across gender. Excluded dummy categories are one dependent child in the household; metropolitan area; youngest child in household is under 2 years old; person reporting is of age 15 to 25; person reporting is legally married or de facto married; and person reporting did not complete high school. Variables which are controlled in the regressions but whose estimated coefficients are not reported are occupation (3 categories) and industry (6 categories), and a dummy for no occupation or industry reported; household type (five categories); quarter and year effects (eight categories); and the count of the total number of women and the total number of persons in the household in each of six age ranges. Estimated coefficients significant at the 1% level are triple-starred; those significant at the 5% level are double-starred, and those significant at the 10% level are single-starred.
45
Table 8: Correlated Tobit estimates - Higher Quality Measured as Active Care Minutes of Time Minutes of Time in Active (Higher-Quality) in Passive (Lower-Quality) Care Care Fathers Mothers Fathers Mothers
Minutes of Time in Market Work Fathers
Mothers
Intercept
117.1776 (40.6810)
***
254.5807 (43.7023)
***
362.9000 *** (137.6252)
593.7811 (98.1570)
*** 1067.7698 *** (134.1537)
621.8793 *** (117.1541)
Two dependent children
26.2361 (7.7288)
***
23.6431 (9.4115)
***
16.3482 (21.7052)
64.7181 (20.2942)
***
77.6876 (22.9992)
***
45.4022 (25.5651)
Three dependent children
1.5056 (10.2008)
68.4427 (11.3319)
***
31.6370 (27.7576)
81.9423 (26.2759)
***
84.4525 (27.2245)
***
-44.5980 (31.6288)
Four dependent children
54.3549 (11.2186)
***
61.4141 (13.6780)
***
84.1496 (34.2173)
***
165.6183 (31.6960)
***
14.8349 (32.8352)
Number of weekend days included
8.0440 (4.3406)
*
-27.6399 (5.2829)
***
214.2089 (12.3142)
***
99.4753 (11.3515)
*** -394.3485 *** (12.6111)
Non-metropolitan urban area
-7.1663 (7.5747)
-38.0502 (8.8442)
***
-8.4280 (21.9801)
-4.4432 (19.5501)
-46.6502 (21.4316)
Rural area
-13.8730 (10.8392)
-12.9592 (13.2147)
88.5888 (28.4091)
***
61.5436 (26.9190)
**
-28.0335 (30.1762)
-41.7241 (33.6229)
Count of women in the household
-16.1895 (12.3081)
16.8149 (13.2775)
43.5132 (22.0623)
**
98.9239 (21.8347)
***
-2.1945 (25.7225)
6.2644 (27.5471)
Indicator for disabled child present in the household
-3.8676 (9.8607)
15.6952 (11.1076)
35.3856 (30.1219)
48.8372 (26.5454)
*
-30.7295 (29.4539)
-10.7700 (33.9073)
Indicator for disabled person present in the household
5.3924 (8.5603)
0.7462 (10.3808)
23.9280 (23.7487)
4.1037 (21.6884)
-30.5061 (24.1698)
-64.0730 (29.0972)
**
Indicator for other adults (age 15+) in the household
-120.2362 (22.1308)
***
Indicator for “child care reported to be difficult to find”
30.0500 (7.2993)
***
Youngest child in household is of age 2 to 4
-11.7309 (8.6126)
Youngest child in household is of age 5 to 9
-53.1284 (9.9299)
Youngest child in household is of age 10 to 14
-161.1479 (12.7254)
Indicator for non-English language spoken in home
6.6412 (13.0189)
Person reporting is of age 25-35
-120.5251 (33.0092)
***
-149.9765 *** -432.0865 *** (26.1869) (117.6273)
-346.6606 (58.7615)
Person reporting is of age 35-45
-151.6674 (34.8688)
***
-206.5409 *** -483.6344 *** (29.1325) (120.6951)
Person reporting is of age 45-55
-131.2543 (41.4731)
***
Person reporting is 55 or older
-199.3257 (41.4411)
***
Person reporting completed high school only
-194.3187 *** -392.7526 (26.0115) (49.8427) 56.8795 (9.0087)
*
-57.3189 (41.8565)
**
-265.2632 *** (14.6547) -8.2168 (24.0654)
***
-438.3438 (45.1854)
***
-4.0452 (57.5613)
107.0448 (62.9828)
*
***
129.0739 (23.4376)
***
123.4357 (22.0155)
*** -25.8061 (23.0459)
-82.2284 (27.7470)
***
-149.7364 *** (11.0239)
81.7109 (31.5150)
***
161.9040 (31.6164)
***
-2.2585 (26.5156)
125.8188 (31.8338)
***
***
-207.9671 *** (12.6245)
105.2090 (30.8388)
***
85.0251 (31.0059)
***
35.3605 (28.2599)
137.2501 (35.1473)
***
***
-376.3645 *** -448.6646 (16.4757) (30.1753)
***
-492.1476 (30.6022)
***
43.6985 (31.5872)
180.3596 (37.7244)
***
-6.1031 (34.3674)
86.9312 (43.0308)
**
***
95.5808 (117.0315)
-78.7123 (74.3727)
-414.6517 (61.1300)
***
90.3280 (121.4890)
-75.3490 (79.8316)
-305.9494 *** -348.6552 *** (36.8676) (124.4030)
-638.4092 (69.4584)
*** -50.1416 (128.8161)
-41.8324 (90.0449)
-436.0276 *** -592.2755 *** (47.7056) (142.8911)
-581.7083 (99.9704)
*** -166.2420 (145.8293)
-123.9505 (125.5428)
11.5209 (11.9300)
45.7610 (12.6857)
12.0259 (34.4765)
48.9611 (27.9220)
Person reporting has other post-school qualification
40.9652 (38.5851)
9.2631 (30.0604)
108.2902 (99.7771)
Person reporting has a vocational or trade qualification
9.6724 (8.9580)
37.9267 (13.6838)
***
Person reporting holds certificate or diploma
23.6645 (11.3308)
**
42.6295 (10.2966)
Person reporting holds a bachelor’s degree or higher
43.4274 (11.7685)
***
93.6507 (15.1914)
Person reporting is Australian
0.5320 (8.3480)
-8.6478 (10.6841)
-4.7681 (23.4035)
Person reporting is single
39.2891 (57.2312)
24.9307 (25.7085)
295.9027 (155.5899)
*
***
-49.6526 (16.1061)
***
***
-6.0744 (33.3808)
-14.8638 (32.4406)
4.8883 (34.1494)
-87.1258 (77.8216)
167.9341 (115.0880)
-130.3600 (95.4954)
-12.8371 (25.3366)
2.2333 (30.0966)
43.5185 (24.7818)
*
27.4152 (35.4815)
***
48.7025 (30.1805)
-62.8220 (23.3079)
62.7702 (29.9285)
**
31.1781 (27.7162)
***
82.0068 (35.4999)
***
211.7350 (3.2138)
***
464.3006 (7.4875)
-0.2640 (0.0248)
***
-0.3912 (0.0168)
ρWH -0.2749 (0.0216) N Log likelihood = -119155.4312
3420
***
**
*
***
52.7791 (34.8750)
-5.3999 (33.9590)
67.4836 (39.5328)
*
-21.0415 (22.2640)
-9.6423 (22.5269)
-58.6342 (27.2256)
**
70.8308 (47.0821)
75.0024 (192.5466)
77.7299 (60.2084)
489.9652 (7.2364)
*** 462.8196 (6.05226)
-0.2569 (0.0206)
***
σL
σH 146.5125 (2.3335)
-15.8901 (32.5876)
σW
ρLW
4308
3420
***
***
498.2398 (10.4694)
***
0.2802 (0.0210)
***
ρLH
4308
0.2884 (0.0253) 3420
***
4308
Notes: Coefficient estimates, not marginal effects, are reported in this table. Correlations are allowed across outcomes but not across gender. Excluded dummy categories are one dependent child in the household; metropolitan area; youngest child in household is under 2 years old; person reporting is of age 15 to 25; person reporting is legally married or de facto married; and person reporting did not complete high school. Variables which are controlled in the regressions but whose estimated coefficients are not reported are occupation (3 categories) and industry (6 categories), and a dummy for no occupation or industry reported; household type (five categories); quarter and year effects (eight categories); and the count of the total number of women and the total number of persons in the household in each of six age ranges. Estimated coefficients significant at the 1% level are triple-starred; those significant at the 5% level are double-starred, and those significant at the 10% level are single-starred.
46
Table 9: Marginal Effects of Key Variables on Fathers' Child Care Time Sole-Tasked Two dependent children
8.17
Multi-Tasked
Primary
7.80
Secondary 8.53
7.05
Active
Development Oriented
Passive 9.17
6.60
5.46
Not Development Oriented 14.02
Three dependent children
4.07
11.43
3.20
13.69
0.52
12.80
7.14
9.83
Four dependent children
16.28
29.42
17.94
27.35
19.34
34.30
19.22
30.59 16.11
Number of weekend days included
0.52
25.57
2.66
24.47
2.82
87.60
10.12
Non-metropolitan urban area
-3.50
8.63
-3.09
9.87
-2.52
-3.40
2.36
1.82
Rural area
-2.39
1.45
-5.31
6.37
-4.85
36.20
2.29
-7.80
Indicator for disabled child present in the household
-1.25
-7.74
-2.26
-8.17
-1.36
14.40
-4.82
-2.01
0.08
12.43
3.38
8.06
1.90
9.80
5.93
1.41 -61.19
Indicator for disabled person present in the household Indicator for other adults (age 15+) in the household
-26.80
-60.56
-28.47
-61.06
-37.63
-157.50
-41.05
Indicator for “child care reported to be difficult to find”
7.49
11.32
7.57
13.17
10.57
52.70
11.01
7.99
Youngest child in household is of age 2 to 4
0.69
1.36
-3.51
7.51
-4.26
35.00
0.20
-0.67
Youngest child in household is of age 5 to 9 Youngest child in household is of age 10 to 14 Indicator for non-English language spoken in home
-9.94
-2.29
-18.48
9.28
-18.59
45.20
-9.26
-5.01
-17.29
-35.77
-28.88
-24.29
-49.55
-179.80
-27.63
-36.84
3.80
-45.62
-0.71
-45.75
2.34
-2.50
-10.33
-27.13
Person reporting is of age 25-35
-15.53
-70.08
-45.39
-36.10
-46.27
-182.80
-36.51
-59.19
Person reporting is of age 35-45
-17.44
-115.58
-46.26
-74.78
-57.26
-203.90
-71.98
-71.50
Person reporting is of age 45-55
-11.12
-98.57
-52.37
-56.40
-50.12
-148.40
-67.45
-45.93
Person reporting is 55 or older
-22.48
-169.67
-72.40
-131.02
-72.95
-247.80
-96.79
-98.94
Person reporting is Australian
-3.46
-8.79
-2.97
-10.23
0.19
-1.90
-2.19
-9.68
9.73
61.68
20.67
58.48
14.19
122.00
14.37
84.16
Person reporting is single High school terminating
3.25
19.65
1.16
23.42
4.01
4.90
10.33
8.37
10.40
5.33
0.69
19.70
14.59
44.20
1.18
12.24
Vocational/trade qualification
3.74
10.05
3.43
11.35
3.36
-5.20
2.46
15.01
Certificate or diploma
5.92
18.48
7.63
16.94
8.32
19.80
14.35
14.73
10.98
36.69
13.68
34.93
15.49
33.40
27.32
19.52
"Other" qualifications
Bachelors degree or higher
Note: Marginal effects are all calculated in comparison to the excluded category of each dummy variable array.
47
Table 10: Marginal Effects of Key Variables on Mothers' Child Care Time Sole-Tasked Two dependent children
Multi-Tasked
Primary
Secondary
Active
Development Oriented
Passive
Not Development Oriented
6.74
6.60
2.60
11.80
9.20
26.80
13.50
1.40
Three dependent children
22.24
28.00
24.80
28.00
26.90
34.00
37.80
16.80
Four dependent children
16.74
34.20
13.70
41.20
24.10
68.90
26.60
27.50
Number of weekend days included
-8.70
10.90
-12.70
15.70
-10.90
41.30
-7.60
6.40
Non-metropolitan urban area
-8.40
-3.80
-13.60
1.40
-14.90
-1.90
-13.10
-0.90
Rural area
-1.00
25.20
-5.50
29.20
-5.10
25.50
-0.10
18.20
5.30
6.10
7.40
5.80
5.70
20.20
8.40
2.20 -9.00
Indicator for disabled child present in the household Indicator for disabled person present in the household
0.20
-10.30
-0.50
-9.30
0.30
1.70
-2.80
Indicator for other adults (age 15+) in the household
-36.94
-83.20
-61.30
-62.90
-73.50
-181.80
-68.40
2.30
Indicator for “child care reported to be difficult to find”
10.10
27.60
16.10
22.00
22.40
51.20
13.90
28.10
Youngest child in household is of age 2 to 4
-32.45
-4.20
-59.20
21.20
-61.20
70.70
-59.20
27.80
Youngest child in household is of age 5 to 9
-49.72
-64.70
-82.00
-34.00
-84.00
36.90
-88.50
-19.50
Youngest child in household is of age 10 to 14
-65.24
-117.80
-98.55
-90.30
-144.09
-203.30
-108.60
-74.50
-6.00
-47.50
-16.50
-44.20
-19.30
-6.50
-27.20
-32.50
Person reporting is of age 25-35
-38.30
-67.40
-47.1
-61.7
-60.30
-150.60
-78.30
-27.60
Person reporting is of age 35-45
-56.10
-65.40
-68.00
-53.50
-82.40
-179.10
-99.80
-17.80
Person reporting is of age 45-55
-69.97
-101.00
-87.50
-94.40
-120.00
-271.40
-135.10
-33.50
-125.22
-148.00
-149.91
-119.20
-165.30
-248.20
-209.62
-64.40
Indicator for non-English language spoken in home
Person reporting is 55 or older Person reporting is Australian
-3.70
10.10
-1.70
6.50
-3.40
-8.70
3.50
3.40
5.80
31.20
13.80
25.80
9.80
29.40
26.00
16.60
High school terminating
12.23
35.90
19.90
27.40
17.90
20.30
25.40
28.20
"Other" qualifications
-2.84
24.50
1.50
24.90
3.60
-35.90
11.90
9.90
Vocational/trade qualification
10.63
28.50
13.90
25.60
14.80
1.30
17.10
23.10
Certificate or diploma
14.83
32.90
19.50
28.10
16.60
-25.90
20.60
29.40
Bachelors degree or higher
23.93
78.20
38.70
64.50
36.90
21.80
48.30
55.20
Person reporting is single
Note: Marginal effects are all calculated in comparison to the excluded category of each dummy variable array.
48