The Political Economy of Financial Structure of Korean Firms Sanghack Lee, Kiwoong Cheong The Journal of Developing Areas, Volume 43, Number 2, Spring 2010, pp. 221-232 (Article) Published by Tennessee State University College of Business DOI: https://doi.org/10.1353/jda.0.0062
For additional information about this article https://muse.jhu.edu/article/270287
Accessed 24 Jan 2017 16:32 GMT
THE POLITICAL ECONOMY OF FINANCIAL STRUCTURE OF KOREAN FIRMS Sanghack Lee Kookmin University, South Korea Kiwoong Cheong Keimyung University, South Korea
ABSTRACT The high indebtedness of Korean firms is viewed as one of major causes for the financial (currency) crisis of Korea in 1997. This paper examines empirically the political economy underlying the financial structure of Korean firms. Specifically, this paper estimates the size of rents generated in Korean financial markets through financial repression during 1971 – 1991. The size of the rent shared by politicians and business sectors proves to be in the range of three to eight percent of Gross Domestic Product of Korea during the period. This paper also shows that firm size has been an important determinant for the financial structure of Korean firms. However, the role of the firm size as the determinant for financial structure has decreased after the financial crisis, suggesting that the tie between politicians and business has been weakened. JEL Classifications: D72, G18, G30 Keywords: Political Economy, Financial Structure of Korean Firms, Financial Crisis, Rent Corresponding Author’s Email Address:
[email protected]
INTRODUCTION The high indebtedness of Korean firms is viewed as one of major causes for the 1997 financial (currency) crisis of Korea.(1) The purpose of this paper is to examine empirically the political economy underlying the financial structure of Korean firms. This paper recognizes the possibility that the high indebtedness of Korean firms is the result of rent creation and sharing by business sectors, politicians and bureaucrats. To support this argument, the current paper offers estimates for the rents generated in financial markets through financial repression during 1971 - 1991. Using the firm-level data, the paper also examines the role of firm size in determining the financial structure of firms. It is widely known that Korea pursued export-oriented (outward-looking) development strategy. For a relatively short time span of four decades in the latter half of the twentieth century, Korea transformed its economy from an underdeveloped agricultural economy to an industrialized economy. Per capita GNP of Korea has increased from 80 US dollars in 1960 to around 10,000 US dollars in 1996. However,
222 from the mid-1990s, Korea has experienced a series of insolvency of large corporations, persistent current account deficits, and the sluggish net inflow of foreign capital. In the wake of the insolvency of several large corporations, Korean financial institutions faced serious difficulties in rolling over their borrowings from international financial markets in 1997. As a result, foreign exchange reserves of Korea shrank rapidly and Korean Won depreciated from the beginning of 1997. In November 1997 Korea faced a risk of default on foreign exchange settlements as Korean financial institutions were short of hard currencies. The Korean government had to ask for emergency rescue by the International Monetary Fund. The financial crisis has had a devastating impact on the Korean economy, resulting in the worst recession since the Korean War. Real GDP shrank 6 % in 1998, and unemployment rate rose from around 2 % in 1997 to 7 % in 1998. Quite naturally, many researchers have tried to find out causes for the crisis. Many scholars have examined macroeconomic conditions prior to the crisis. Hahm and Mishkin (2000) find that, paradoxically, the basic macroeconomic fundamentals in Korea were relatively strong. (2) Others have pointed to economic factors such as excessive debt financing (in other words, high debt/equity ratio), crony capitalism, weak regulation of financial intermediaries and moral hazards caused by information asymmetry, (Corsetti et al. (1998), Krugman (1998, 1999), Park and Rhee (1998), Shin and Hahm (1998), Hahm and Mishkin (2000)). Excessive government intervention and poor corporate governance were also viewed as causes for the crisis, (Joh 2001). As discussed in the preceding paragraphs, high debt/equity ratios of Korean firms are in general considered as one of fundamental causes for the financial crisis in 1997. Then, the pertinent question is what caused the very high indebtedness of Korean firms. We recognize the possibility that high debt/equity ratios of firms might be the consequence of intentional rent-creation and rent-sharing by business group, politicians and bureaucrats. Kang (2002) also recognizes this possibility. Kang (2002) considers Korean situation as the one in which government and business are equally strong: there is a relatively coherent state and also a small number of powerful business groups. In this case business and political elites exchange bribes for political power. Kang (2002) does not offer firm-level analysis to support his argument, however. In fact, little effort has so far been made on empirical investigation of political economy of financial structure of Korean firms. This paper offers empirical analysis of the political economy underlying the financial structure of Korean firms. The remainder of the paper is organized as follows. In Section 2 we show how financial structure of firms evolved in Korea in the political economy context. We present estimates for the rents generated through financial repression in the Korean financial markets. Section 3 analyzes the relationship between debt/equity ratios of firms and firm sizes, using firm-level data. Section 4 offers concluding remarks. THE POLITICAL ECONOMY OF KOREAN FINANCIAL MARKETS It is well documented that the Korean government tightly controlled the financial sectors during its economic development era. Access to precious funds was limited. Firms tried to gain access to the enormous rents that would accrue to them if they received loans with
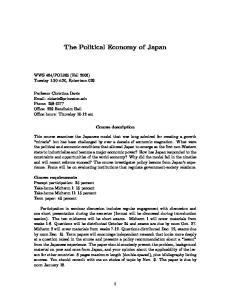
223 low interest rates. Through repression in the financial markets, rents have been created and shared by politicians, bureaucrats and business. Figure 1 depicts the typical situation in the Korean financial market in the economic development stage. The curves DD and SS represent demand for and supply of funds, respectively. The market equilibrium would have been achieved at the intersection of demand curve and supply curve of funds. However, the Korean government put ceiling r* on the interest rate. The interest rate at the curb market would go up to r**. As a result, rents in the amount of the shaded rectangle were created. FIGURE 1.
FINANCIAL MARKET WITH INTEREST CEILING
Firms, bureaucrats and politicians shared these rents. The larger the firms, the more political influence they could generate. Politicians took a lot of “voluntary” donations known as “quasi-taxes” from large firms in return for cheap loans and other favors. (3) That is, the politicians and large firms created the pie, “rent,” and shared it together. In this case, firm size was an important advantage for rent seeking, because firm size was an important criterion for political connections with business. Large firms were preferred in allocation of funds since, given the size of funds to be allocated, the number of transactions and transaction costs in rent sharing could be reduced. As a result, large firms with licenses to invest in projects had a great advantage in acquiring credit allocation from financial institutions. Also, financial market for small- and medium-sized firms has been underdeveloped in Korea, as noted by Lee (1995).
224 Korean firms tried to expand, both to obtain cheap loan and to make them so large that the Korean government would have no choice but to keep on supplying them with funds.(4) These in sum resulted in high debt/equity ratios of Korean firms. That is, the high debt/equity ratios of Korean firms were the consequence of the tie between the politicians and business. While this has been recognized by many scholars, (e.g. Kang (2002)), little empirical work regarding firm size and financial structure has been offered. Also, the possibility that the financial markets might be intentionally suppressed to create rents is not fully recognized. Following Kang (2002) we argue that firms with access to financial resources have benefited from the suppression in financial markets, at the expense of the firms with little access to financial resources, mostly small- and mediumsized firms. Our argument is consistent with Lim (2004) who finds that profitable small firms are gaining access to the credit from financial institutions after the 1997 financial crisis. In sum, the Korean financial markets were in favor of large firms at the expense of small and medium-sized firms. As a means of financial repression, interest rates were heavily regulated by government until mid-1990s. Table 1 reports interest rates both in the official market and in the curb market. With substantial development in real sectors, however, Korea began to pay attention on financial sectors in 1990s. The Korean government has pursued a drive for financial liberalization and market opening since the 1990s in response to worldwide financial globalization. Since the 1990s interest rate has been deregulated, entry barriers to the financial business have been lifted, and the financial industries and markets are opened to foreigners. The pressure for market opening from advanced countries provided a major impetus for the drive. With the development of financial markets in Korea, the interest rate set by the government tended to decline. However, the curb market rate has been considerably higher than the governmentset interest rate. For example, in 1982, the general bank loan rate was 10% per annum while the curb market rate was 33.1%, the difference between the two rates being 23.1% point. As can be seen in Table 1, however, the difference between the two rates has decreased over the time period. With shrinking difference between the two rates, the relative size of the rent has decreased as well. Firms have been in competition with each other to win loans (prizes) from financial institutions. The decrease in the size of the rent naturally reduced competition between firms to borrow from banks.(5) For example, in 1991, the bank loan rate was 12.5% and the curb market rate was only 21.2%, with the difference of 8.7% point. Considering the transaction costs associated with rent sharing and bureaucracy of the bank loan, this difference might not be large enough to induce fierce competition between firms for access to bank loans. Instead, firms seemed to resort to direct equity financing and foreign funds(6) in the 1990s. Table 2 reports yearly proceeds from direct equity financing. From firms’ point of view, the direct equity financing can generate problems associated with firm governance. Even with this possibility, Korean firms raised lots of funds from the direct equity financing market. This is partly due to the development of the Korean security markets and partly due to the fact that the merit of the bank loan has decreased as the curb market rate has converged to the market rate.
225 TABLE 1. Year
INTEREST RATES (%. p.a.), 1964-1991
Inflation(CPI) Time Deposita
Bank Loans Curb market(A) General(B) NIFb Export 1964 15.0 16.0 8.0 61.8 1966 11.2 30.0 26.0 6.0 58.7 1968 10.8 26.0 25.2 6.0 56.0 1970 15.9 22.8 24.0 6.0 50.2 1971 13.5 22.0 22.0 6.0 46.4 1972 11.7 15.0 15.5 6.0 39.0 1973 3.5 12.6 15.5 7.0 33.2 1974 24.3 15.0 15.5 12.0 9.0 40.6 1975 25.3 15.0 15.5 12.0 9.0 47.9 1976 15.3 15.6 18.0 14.0 8.0 40.5 1977 10.1 15.8 16.0 14.0 8.0 38.1 1978 14.4 16.9 19.0 16.0 9.0 41.7 1979 18.3 14.4 19.0 16.0 9.0 42.4 1980 28.7 19.5 20.0 19.5 15.0 44.9 1981 21.3 16.2 17.0 17.5 15.5 35.3 1982 7.2 8.0 10.0 10.0 10.0 33.1 1983 3.4 8.0 10.0 10.0 10.0 25.8 1984 2.3 10.0 11.5 11.5 10.0 24.8 1985 2.5 10.0 11.5 11.5 10.0 24.0 1986 2.8 10.0 11.5 11.5 10.0 23.1 1987 3.0 10.0 11.5 11.5 10.0 22.2 1988 7.1 10.0 13.0 11.5 10.0 21.2 1989 5.7 10.0 12.5 11.5 10.0 18.9 1990 8.6 10.0 12.5 11.5 10.0 20.4 1991 9.3 10.0 12.5 11.5 10.0 21.2 Source: Cho, Yoon Je and Joon Kyung Kim (1997); recited from Joh (2001). Notes: a; One-Year Time Deposit at Bank, b; National Investment Fund.
A-B 45.8 32.7 30.8 26.2 24.4 23.5 17.7 25.1 32.4 22.5 22.1 22.7 23.4 24.9 18.3 23.1 15.8 13.3 12.5 11.6 10.7 8.2 6.4 7.9 8.7
226 TABLE 2. PROCEEDS FROM CORPORATE SECURITIES (BILLION WON) Year Going Public (A) Right Offerings (B) A + B Corporate Bonds 1984 81 398 479 1,804 1985 35 260 295 3,177 1986 43 798 805 2,729 1987 244 1,655 1,899 3,190 1988 1,049 6,721 7,770 4,244 1989 3,545 11,125 14,670 6,959 1990 336 2,582 2,918 11,084 1991 507 2,180 2,687 12,718 1992 639 1,711 2,350 11,155 1993 470 2,789 3,259 15,600 1994 869 5,379 6,248 20,050 1995 683 5,584 6,267 23,598 1996 1,634 3,652 5,286 29,905 1997 713 2,676 3,389 34,322 1998 706 13,452 14,158 56,000 1999 7,687 33,465 41,152 30,671 2000 8,556 5,789 14,349 58,663 2001 7,064 5,098 12,162 87,166 Sources: 1) Bank of Korea, Economic Statistics Yearbook (2002). 2) Korea Stock Exchange, Stock (December 1995, June 1998, May 2002).
Table 3 reports the size of the rent generated through financial repression, relative to GDP for the period of 1971 - 1991. The size of the rent, the area of the rectangle in Figure 1, is obtained by multiplying the interest rate differential between the official and curb market rates, (A-B) in Table 1, by the total outstanding loans from the banking system at the end of each year. In 1970s the size of the rent created through financial repression amounted to, on the average, around 6 - 7 % of GDP. However, in 1980s, it decreased to around 4 % of GDP. Thus, while substantial amount of rent has been created in financial markets, the relative size of the rent has continuously decreased.
227 TABLE 3. THE SIZE OF THE RENT (BILLION WON,%), 1971 - 1991 Total outstanding loans (1) (A-B) a (2) Rent ((1)*(2)) Rent/GDP (%) 1971 9,195 24.4 2,244 6.64 1972 11,980 23.5 2,815 6.75 1973 15,875 17.7 2,810 5.22 1974 24,278 25.1 6,094 8.02 1975 29,055 32.4 9,414 9.20 1976 37,249 22.5 8,381 5.99 1977 47,090 22.1 10,407 5.80 1978 66,090 22.7 15,002 6.19 1979 89,778 23.4 21,008 6.77 1980 122,044 24.9 30,389 8.04 1981 159,550 18.3 29,198 6.16 1982 202,258 23.1 46,722 8.58 1983 241,503 15.8 38,157 5.98 1984 279,789 13.3 37,212 5.10 1985 338,107 12.5 42,263 5.20 1986 390,986 11.6 45,354 4.78 1987 430,958 10.7 46,113 4.15 1988 488,054 8.2 40,024 3.03 1989 625,478 6.4 40,031 2.70 1990 740,286 7.9 58,483 3.27 1991 894,156 8.7 77,792 3.59 Note: a; (A-B) is the difference in interest rates between the official market and curb market. These numbers are taken from Table 1. Source: Bank of Korea, own calculation.
FIRM SIZE AND DEBT/EQUITY RATIO: EMPIRICAL ANALYSIS We now examine the effect of firm size on debt/equity ratio of Korean firms, using firmlevel data. Specifically, we examine the relationship between firm size and debt/equity ratio for firms listed in the Korea Stock Exchange for the period from 1982 to 2001. The data for the empirical analysis are obtained from the CD/ROM database provided by Korea Listed Companies Association.(7) We exclude data of firms with zero debt/equity ratio since the firm size apparently has no effect on debt/equity ratio of such firms and, as a result, they are out of the scope of this research. We also exclude data of firms with the ratio over 1,000 % as they are presumably under severe financial distress and, as a result, their financing behavior would differ substantially from other normal firms. (8) The numbers of samples excluding these outliers are reported in Table 4. Sample sizes show a growing trend, ranging from 190 to 561. Decreases in the number of samples in 1998 and 1999 are attributable to severe financial distress right after the financial crisis. We conduct an ordinary least squares (OLS) regression with the debt/equity ratio as a dependent variable and firm size as an independent variable for each year. (9) We estimate the following OLS regression equation for each year:
228 Debti =
0
+
1*Asseti
+
2*(Asseti)
2
+ ui,
(1)
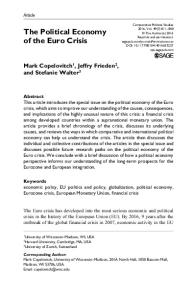
where Debti denotes firm i’s debt/equity ratio (%), Asseti is a size of asset as a proxy variable for the firm size in the corresponding year and ui is a white noise random variable. We expect that 1 be positive, as the larger firm would have the higher debt/equity ratio. However, as the size of the firm increases, the debt/equity ratio would increase at a slower rate, as shown in Figure 2. We thus expect that 2 be negative. FIGURE 2.
FIRM SIZE AND DEBT/EQUITY RATIO
Table 4 reports the regression results of the equation (1). Estimated coefficients are in accordance with our expectation. For all the years from 1982 to 2001, 1’s are positive and 2’s are negative. Except for 1999 and 2000, null hypotheses for them can be rejected, i.e., they are statistically significant, at 5% significance level. Also, 1’s and 2’s show decreasing trends, indicating that the role of firm size as a determinant for debt/equity ratio has decreased over the period. Adjusted R2s are relatively high, considering the cross-sectional characteristics of the data.(10) However, R2 also shows a decreasing trend, suggesting that the role of the firm size as a determinant for financial structure has declined over the period. This is consistent with trend of cleaning of money politics in Korea.
229 TABLE 4.
REGRESSION RESULTS FOR EQ. (1)
year β1 t-value β2 t-value adjusted R2(%) number of samples 1982 1.02E-06 5.78 -8.57E-16 -4.13 15.55 190 1983 8.11E-07 5.24 -5.49E-16 -3.40 12.33 231 1984 6.08E-07 4.65 -3.49E-16 -2.79 10.91 242 1985 5.07E-07 4.34 -1.81E-16 -2.31 11.07 254 1986 4.49E-07 4.57 -1.40E-16 -2.28 13.32 259 1987 3.34E-07 4.22 -1.03E-16 -2.23 9.91 289 1988 2.03E-07 6.11 -3.68E-17 -4.39 9.37 380 1989 9.95E-08 6.13 -8.99E-18 -5.94 6.89 492 1990 1.33E-07 6.89 -1.13E-17 -6.41 7.75 544 1991 9.32E-08 6.37 -7.01E-18 -5.85 6.70 541 1992 8.49E-08 6.16 -5.39E-18 -5.64 6.42 527 1993 6.76E-08 5.69 -3.78E-18 -5.19 5.54 522 1994 6.05E-08 6.08 -3.12E-18 -5.52 6.27 527 1995 4.69E-08 5.60 -2.15E-18 -5.08 5.16 544 1996 4.10E-08 5.41 -1.38E-18 -4.92 4.68 561 1997 4.38E-08 7.39 -1.07E-18 -6.35 8.96 536 1998 2.27E-08 4.49 -4.97E-19 -3.63 3.68 489 1999 3.45E-09 0.96 -7.52E-20 -1.05 -0.17 496 2000 6.23E-09 1.65 -1.22E-19 -1.62 0.17 501 2001 8.85E-09 2.29 -2.48E-19 -2.39 0.76 508 Notes: 1) E denotes exponential. For example, E-06 = 10-6. 2) Coefficients are statistically significant at 5% significance level except for 1999 and 2000.
The decrease in the role of firm size as a determinant of debt/equity ratio is also attributable, to some extent, to development of direct equity financing markets. The direct equity financing markets have developed and rents from the indirect financial markets dwindled due to the liberalization and globalization of Korean financial markets in the 1990s. With these trends, we surmise, large firms have switched, to some extent, to the equity financing market and foreign funds. Table 2 shows that proceeds from equity financing and corporate bonds have rapidly expanded. Corporate bonds in Korea have relatively short maturities, mostly ranging from three to five years, while equities have, by nature, no maturity at all. A bulk of proceeds from bond issuing is just for rolling over maturing bonds. Thus, development of direct financial markets tends to decrease debt/equity ratios. For the period, large firms absorbed a lion’s share of the fund in the direct equity financing market. In other words, as the Korean government liberalized regulations on equity financing market and rents in the indirect financing market dwindled, large firms switched to equity financing, contributing to the decrease of the role of firm size as a determinant for financial structure.
230 CONCLUDING REMARKS Many researchers have argued that high debt/equity ratios of Korean firms are an indicator of underdevelopment of Korean financial markets. We go one more step by arguing that the development of financial markets had been suppressed intentionally for the government and business groups to create and share the rents. However, as the direct equity financing markets have developed in the 1990s, large firms switched to the equity markets. This is partly because rents from the indirect regulated markets dwindled due to the liberalization and globalization of Korean financial markets. This paper is a first step in our ongoing research on the political economy of financial markets in Korea. More rigorous empirical test would reveal interesting results and policy implications. Combining the results of this paper with research on the relationship between market concentration and financial structure, (e.g., Cheong and Lee 1999), would be an interesting future task.
ENDNOTES * We wish to thank Roger Congleton and an anonymous referee of this Journal for their valuable comments and suggestions. This work was supported by research program 2005 of Kookmin University, Seoul, Korea. The usual disclaimer applies. 1 In this paper Korea refers to South Korea (Republic of Korea). 2 In 1996 and 1997, government budget was basically in balance and the current account deficit relative to GDP was falling from 4.4 % to less than 2%. Inflation was below 5%. GDP was expected to grow at around 6%. Thus, judging by macroeconomic data alone, Korea seemed to be in a good shape. Thus, the financial crisis caught many by surprise. For a detailed discussion, see Hahm and Mishikin (2000). 3 For a detailed discussion, see Kang (2002). 4 Kang (2002) notes that “coherent state” and “concentrated business sector” of Korea were in mutual hostage situation. 5 It is shown in the literature of economics of contest that a decrease in the size of prize reduces aggregate efforts expended in the contest. By the same way, a decrease in rents in financial markets would reduce efforts to obtain the rents. For an overview of the literature, see Hillman (2003, chapter 6). 6 Since credit ratings of Korean firms were low, access to foreign funds was limited to a small number of firms belonging to large Korean conglomerates, chaebols. 7 Since 1981 many kinds of financial database have been supplied by the Korea Listed Companies Association. 8 Of course, 1,000% debt/equity ratio is an arbitrary criterion. However, most Korean firms have the debt/equity ratio below 1,000%. In 1997, the average debt/equity ratio was 396% for Korean firms, 154% for US firms, 193% for Japanese firms, and 86% for Taiwanese firms, respectively, (Joh 2001). Thus, the debt/equity ratio 1,000% was a fairly high one even by Korean standard. 9 An alternative is to conduct OLS estimation, pooling the data. Since debt/equity ratios of Korean firms have fluctuated considerably during the period, reflecting business cycles, political turmoil and so on, we believe that pooling data would rather yield poorer results. 10 Qualitatively the same results hold even if we use sales amount as a proxy variable for the firm size. The sales amount was an important criterion by which the bank lent money to firms in Korea.
231 REFERENCES Bank of Korea, Economic Statistics Yearbook, 2002. Cheong, Kiwoong and Lee, Sanghack, “Financial Structure in Oligopoly: Theory and Empirical Evidence from Korea”, in Michael Baye (ed.) Advances in Applied Microeconomics, 1999, Vol. 8, JAI Press, pp. 209-221. Cho, Yoon Je and Kim, Jun K., Credit Policies and Industrialization of Korea, Seoul: Korea Development Institute, 1997. Corsetti, Giancarlo, Paolo Pensenti and Nouriel Roubini (1998), “Paper Tigers? A Model of the Asian Crisis”, Mimeo, New York University. Hahm, Joon-Ho and Mishkin, Frederic, “Causes of the Korean Financial Crisis: Lessons for Policy”, NBER working paper 7483, 2000. Hillman, Arye L., Public Finance and Public Policy: Responsibilities and Limitations of Government, 2003, Cambridge University Press. Joh, Sung Wook, “The Korean Corporate Sector: Crisis and Reform”, in Y. Kwon and William Shepherd (ed.) Korea’s Economic Prospects, Edward Elgar, 2001, pp. 116132. Joh, Sung Wook, “The Korean Economic Crisis and Corporate Governance System”, in Takatoshi Ito and Anne Krueger (ed.) Governance, Regulation, and Privatization in the Asia-Pacific Region, NBER-East Asia Seminar on Economics, 2004, Vol. 12, pp. 129155. Joh, Sung Wook and Ryoo, Sang Dal (2000), “Evaluation of Changes in the Corporate Governance System of Korean Chaebols,” paper presented at the International conference of Korean Economic Association. Kang, David, “Bad Loans to Good Friends: Money Politics and the Development State in South Korea”, International Organization, 2002, Vol. 56, pp. 177-207. Korea Listed Companies Association, (2001) CD/ROM database. Korea Stock Exchange, (December 1995, June 1998, May 2002) Stock. Krugman, Paul, “A Model of Balance of Payments Crises”, Journal of Money, Credit and Banking, 1979, Vol. 11, pp. 311-25. Krugman, Paul, “Balance Sheets, the Transfer Problem and Financial Crises”, Mimeo, 1999, MIT. Lee, Chung H., “The Government, Financial System, and Large Private Enterprises in the Economic Development of South Korea”, World Development, 1992, Vol. 20, 187197. Lee, Jong Kyu, Financial Reform in Korea: Critiques of and Suggestions for the Current Financial Liberalization Policy with a Focus on SME Financing, Unpublished Ph.D. Dissertation, 1995, University of Hawaii. Lim, Youngjae, “Sources of Corporate Financing and Economic Crisis in Korea: Micro-evidence”, In Takatoshi Ito and Anne Krueger (ed.) Governance, Regulation, and Privatization in the Asia-Pacific Region, NBER-East Asia Seminar on Economics, 2004, Vol. 12, pp. 159-181.
232 Park, Daekeun and Changyong Rhee, “Currency Crisis in Korea: Could It Have Been Avoided?” Mimeo, 1998, Seoul National University. Shin, Inseok and Hahm, Jun-Ho, “The Korean Crisis: Causes and Resolution,” KDI working paper 9805, 1998, Seoul: Korea Development Institute.