ASN TR 61-203, Pt It
THE MECHANICAL PROPERTIES OF TANTALUM WITH SPECIAL REFERENCE TO THE DUCTILE-BRITTLE TRANSITION
TECHNICAL DOCUMENTARY REPORT NO. ASD TR 61-203 *
PART II
. oMarch
1963
Directorate of Materials and Processes Aeronautical Systems Division Air Force Systems Command Wright-Patterson Air Force Base, Ohio
C•l*
Project No. 7351, Task No. 735106
S~rrr
(Prepared under Contract AF 33(616)-7173 by Materials Research Corporation, Orangeburg, New York; G. T. Murray, R, A. Burn, authors)
-
NOTICES
When Government drawings, specifications, or other data are used for any purpose other than in connection with a definitely related Government procurement operation, the United States Government thereby incurs no responsibility nor any obligation whatsoever; and the fact that the Government may have formulated, furnished, or in any way supplied the said drawings, specifications, or other data, is not to be regarded by implication or otherwise as in any manner licensing the holder or any other person or corporation, or conveying any rights or permission to manufacture, use, or sell any patented invention that may in any way be related thereto.
Qualified requesters may obtain copies of this report from the Armed Services Technical information Agency, (ASTIA), Arlington Hall Station, Arlington 12, Virginia.
This report has been released to the Office of Technical Services, U.S. Department of Commerce, Washington 25, D.C., in stock quantities for sale to the general public.
Copies of this report should not be returned to the Aeronautical Systems Division unless return is required by security considerations, contractual obligations, or notice on a specific document.
B
FORMBD This report was prepared by Materials lbsearch Corporation under UShA Contract No. AF 33(616)-7173. This contract was initiated under Project No. 7351., Metallic Materials', Task No. 735106, 'Behavior of Metals'. This work was administered under the direction of the Metals and Ceramics Laboratory. Directorate of Materials and Processes. Deputy for TechnoloU, Aeronautical Systems Division with Mr. F. G. Ostermann acting as Project Engineer. This report covers the work conducted from 1 April 1961 to I April 1962.
ACOKVIZEDWN1MS This work was suggested and initiated by Dr. M. A. Admas. The assistance of Mr. C. Melo and Mr. P. Salmaggi in material preparation is gratefully acknowledged.
ABSTRACT The lower yield stress-grain size relationship was studied in tantalum fortwo compositions; one consisting of a total interstitial content of 72 ppm with the major constituent being oxygen, and the other containing primarily carbon (116 ppm) in which part of the carbon existed In the form of a finely dispersed carbide precipitate. These results were compared to those obtained earlier (1) on commercial tantalum containing a total interstitial content of about 200 ppm. equation
The parameters r:
-
and ky In
the Petch
1 + kyd" /2
were of primary interest. The commercial tantalum exhibited significantly higher yield and flow stresses and correspondingly higher ri values. The carbon containing material showed the lowest yield stresses primarily because of its lower oxygen content. It was concluded that oxygen is much more effective than carbon in restricting dislocation movement. The effect of the carbide precipitate was to increase the work-hardening rate. The flow stresses, however, even in the presence of the carbide phase were lower than those observed for commercial tantalum. The k
values obtaiped on the 72 ppm solute content materials
were found to be approximately rate of 10- /sec. for a ftrain 2 X 10 c.g.s. units and thus about a factor of two larger than did For both materials k those found on commercial tantalum. temperature at a strain rate of 10-3/sac., not vary with test however, at a strain rate of 0- /sec. k for the 72 ppm solute material was found to vary from about 1 To 3 X 10⁷ c.g.s, with temperature. the larger values being measured at the lower test ky values for the oarbgn containing material were found to be and did not vary appreciably very small (~0.5 X 10( c.g.s.) It was suggested that temperature or strain rate. with test this small ky may be due to a large number of unlocked dislocations
as a result of the carbide particles acting as sources. iII
k- and if values were also computed by the Liders strain to method. agree andgrain found roomthose temperature teohn~lue reasonably for wellthe with obtained tests by the size
This technical documentary report has been reviewed and Is approved.
W. J. TRAPP Chief, Strength and Dyramics Branch Metals and Ceramics Laboratory Directorate of Materials and Processes
Iv
TABLE OP CONTENTS
Section
page
I.
INTRODUCTION .........................
1
II.
EXPERIMENTAL PROCEDURE ...............
2
III.
RESULTS ..............................
4
A.
"High Purityu Material .......
4
B.
Carbon Doped Material ........
6
C. Comparative Behavior of "High Purity", Carbon Doped, and Commercial Tantalum ..........
8
D. Comparison with the Results of Other Investigations ......
10
IV.
DISCUSSION.*..*.*.**.................
11
V.
BIBLIOGBAPHY .........................
15
v
LIST OF ILLUSTRATIONS Flaure 1
2
3
4
5
PML. Miorostruotures of Carbon Doped Material Reorystallized at (a) 1300°C; (b) lI.0OC; (o) 1510OC; (d) 1720C. Nag. X100.........
16
Representative Stress-Elongation CuIVI5 for lHigh Purityw Specimens with d- 7 Values in the Range 1.25 to 2.0 =-1/2 .....
17
Representative Stress-Elongation Curve a for 'High Purity" Specimens with d17 -1/2 ...... Values in the Range 4.4 to 5.5
18
Effect of Grain Size on Stress-Elongation Curves of "High PurityO Specimens at a StrainRate of i0- 3 /sec ....................
19
Longitudinal Section of Fracture Zone. Hardness Traverse Shows Extent of Strain Hardening in Necked Region. Spec. B1703.
Mag. X50 ..................
0...... ...........
20
6
Light Reflecting Facet on Fracture Surface Mag. X400 ............... of Specimen 20c1.
21
7
Effect of Temperature and Strain Rate on the Variation of Lower Yield Stress with Grain Size for *High Purityu Material ......
22
8 9 10
11
The Variation of k
with Test Temperature
for wHigh Purity" gaterial ................
23
The Variation of Ut with Test Temperature for "High Puritys Material .................
24
Representative Stress-Elongation 1 an•ves for Carbon Doped Material with d-M 'Values In the Range 1.5 to 2.2 mm-l/2.............
25
Representative Stress-Elongation Cq~ves for Carbon Doped Material w4 d-41/ Values in
the Range 4.5 to 5.6
vi
Il-19 .............
26
LIST OF ILLUSTRATIONS (Continued) Figure 12
page Longitudinal Section Through Fracture Zone of Carbon Doped Spec. B22a. Nag. X50. Hardness Traverse Shows Extent nf Strain Hardening in Necked Zone... # .......
13
14
15
16
17 18 19
#........................
27
Effect of Temperature and Strain Rate on the Variation of Lower Yield Stream with Grain Size for Carbon Doped 0.0......00...... Material .................
28
The Variation of 4ý with Test Temperature for Carbon Doped Material .......
29
Comparative Stress-Elongation Curves at 298 and 77;K and_• a Strain Rate of 10-1/se. for _lI• Values in the Range
"4.5 to 5.6 mm1 /2......................
30
Comparative Lower Yield Stress/Grain Size Plots for a Strain Rate of 10- 1 /00c ................. ... .......
31
Comparative d Temperature Behavior for a Strain Rate of 10-1/8ec ..............
32
Comparative (I Temperature Behavior for a Strain Rate of 10-/saeo..............
33
Comparison of Yield Strength-Grain Size Results with those of other Investigations. Room Temperature Tests .......
34
vii
LIST OF TABLES Table I.
Grain Size vs Approximate Recrystallization Temperature ..............
35
II.
Interstitial Content (PPM)..................
36
III.
Tensile and Fracture Properties of "High Purity" Tantalum ................. .. 0......
37
I and k Values by Petch Method for "Igh Purity" Tantalum ....................
40
Tensile and Fracture Properties Doped Tantalum ....................
41
IV. V. VI. VII.
VIII.
of Carbon * .... . ....
4i and k Values by Petch Method for Carbon Doed Tantalum .....................
43
Relative Strain Hardening Coefficients for Room Temperature Tests at 10- /sec. Strain Rate..... *..................................
44
k-
Lders Strain vs Grain Size Method
2-980K a?
..................
.
Villi
...........
45
I. INTRODUCTION: In an earlier study (l)* on specimens of oommercial tantalum the variation of lower yield stress d-, with grain size 2d was used to assess the effect of temperature and strain rate on the parameters OT and ky In a Petch equation + ky
1"
(1)
where dr represents the lattice friction stress and k is a measure of the dislocation locking strength. Cottrelli' transition equation (
3 dd/2 + ky)ky U
,A./
(2)
was used to compute an effective surface energy 6 for crack propagation. Here^ Is the shear modulus of the material and., a constant equal to unity for conventional tests, and 1/3 for tests on notched specimens. The theory (2)(3) underlying these two equations wac critically reviewed In the earlier report and will not be repeated here. In the earlier work (1) It was concluded that the sensitivity of the yield strength to temperature and strain rate arose almost entirely from the effects of these variables on 91. i values were computed that varied from approximately 20.5 Kg/mm2
at 298 0 K to 88 Kg/mm2 at 77 0 K.
A ky value of 107 o.g.s. units
was found that did not vary with temperature. From the observation of small cleavage facets on the fracture surfaces in the
SNumbers
in
parentheses indicate References
Manuscript released by the authors August 1962 for publication am an ASD Technical Documentary Report. 1
was computed to be between 1.16 and 1.35 X 10⁴ erg/cm2 . In an extension of this work (4) the fact that considerable deformation occurred in the necked region prior to fracture was taken into consideration. True stress-area reduction curves were then obtained and it was found that the flow stress prior to fracture was about a factor of two larger than the yield stress. Thus by increasing 6r by a factor of two the new value of Y was then coma :ed and was found to be between 2.3 and 2.7 X 10⁴ erg/cm2 . It was thus concluded that tantalum derives its greater resistance to brittleness (compared to Nb, Mo, and steel) not only from its low value of ky and high value of,^ , but also from its high value ofi'.
770K test,
'
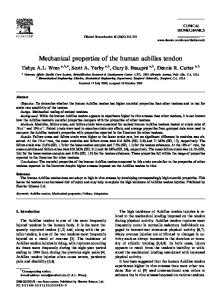
The present investigation was intended to extend the above study to tantalum containing controlled quantities of interstitial solute. It was decided to conduct the experiments as before at three temperatures and two strain rates but in addition to Include the solute in two states - namely in solid solution and as a second phase. It was thought that the relative values of (5 aud ky would be affected by the state of the solute distribution. II. EXPERIMENTAL PROCEDURE: Material in the form of 3/16" diameter rods of 99.9% pure tantalum was obtained from the Kawecki Chemical Corporation. These rods were given a double pass in a floating-zone electron beam zo;e refiner which was maintained at a minimum vacuum of 5 X 10⁻⁷ mm Hg. This zone refining equipment and operation has been described elsewhere (1)(5). The total interstitial content In high vacuum beam melted material is dependent on the composition of the starting material and zoning speed. It has been demonstrated at Materials Research Corporation that the total content can be kept below 25 ppm by a However, this resulting high suitable choice of these variables. purity material often does not show a yield point, and when one Consequently, the starting material is observed it is very small. and zoning speeds were selected to give a somewhat larger interstitial content. This material, referred to hereafter as "high purity", yielded an average total interstitial content of 72 ppm with oxygen being the major constituent (see Table II). In order to study the effect of carbide precipitate, rods of beam melted "high purity" material were coated with "Oil Dag" (a suspension of carbon in oil) by immersion and the oil subsequently burned off at 4000C to leave a surface layer of carbon. These "Dag-coated" rods were then remelted in the electron beam refiner which allowed the carbon to be homogeneously distributed
2
throughout the molten zone. Both types of rods were then given a 77% reduction In area by cold rolling to 0.090" diameter and subsequently annealed in
the electron beam at various power settings. The resulting grain sizes and annealing temperatures are listed in Table I. Temperatures were measured with an optical pyrometer. The actual value of grain size (2d) used in the Petch equation was determined by metallographlc examination of each individual specimen after fracture. The average grain diameter was determined by counting the number of grains intersecting a diameter marker on a polished
cross-section. The cross-section was taken in the gage section (outside the necked region) and corrections were made for grain size reduction as a result of the uniform reduction in area. It was found that specimens cut from the same recrystallized rod were essentially of the same grain size. The"Dag-coated" specimens contained significant quantities of carbide precipitate after the recrystallization annealing treatments. Since these specimens were annealed at various temperatures, the carbide distribution as well as the amount of carbon in solid solution was expected to vary with the annealing temperature employed. The resulting homogeneous carbide distribution representative of several annealing temperatures is shown In Figure 1. The range of the annealing temperatures was about 4000C and it can be seen that the carbide distribution did not vary significantly over this range. It can be seen that, except for the smallest grain size specimens, considerable grain boundary carbide precipitate Is present for certain boundary misorientations. These boundaries invariably possessed a narrow adjacent region which was totally void of visible precipitate. One would also expect the carbon in solution to vary with annealing temperature, however, an examination of the phase diagram (6) shows that over this temperature range the maximum change in solubility is only of the order of 20 ppm. The chemical analyses for the interstitial content of the as-received,"high purity" and carbon doped materials are shown In Table II. For the latter two materials three specimens were selected at random for analysis and all three values are reported (National Research Corporation analyses; Kjeldahl technique used for nitrogen.) Note that the "Dag-coated" specimens contain less oxygen than the "high purity" rods from which they were The added carbon assists in removal of oxygen. The processed. as-received material contained significant quantities T,--l1000 ppm) of substitutional solute whereas in the beam melted material only about 40 ppm metallic solute was found. The analysis of the beam
recrystallized commercial material employed by Adams and Iannuccl (1)
also included in TablefI
is
for comparison purposes.
pieces were made by brazing the ends of 2" Tensile test lengths of the recrystallized tantalum to threaded stainless
Brazing was carried steel collars as previously described (1). out in the electron boaw apparatus which produced a neat regular fillet leaving a 1" gage length. Each brazing operation took less than one minute, and metallographic examinations of numerous Joints showed no grain growth in the tantalum as a result of the brazing. Tensile tests conducted on representative samples in the etched and un-etched condition showed no difference due to the Consequently, the etching operation was disconsurface removal. tinued. The tensile tests were carried out in a "hard" machine of at temperatures of 298, 195 (acetone the type described by Adams (7) At each and dry-ice mixtures), and 77 0 K (liquid nitrogen). covering th2 range of grain sizes of teuptrature speciml" to 7.6 mm- 1 / 2 were tested at strain rates d-/f- rom 1.2 mm" 3 curves were autographically The stress-strain of 10A and 10- /sec. response time rapid whose recorder milli-volt on a recorded range deflection) resulted in high loading (1/4 sec. for full sensitivity. III.
RESULTS: A.
"High Purity" Material
I.
General stress-strain
behavior
and fracture conditions and resulting stress-strain The test Reprein Table III. data for each specimen tested are listed curves for each temperature and strain sentative stress-strain
grain size ratl.Ire shown ip. igure 2 for specimens of large (d-I/2"^-5 mm"I/ -1l.5 mm- / ) and in Figure 3 for smaller (d-/'
2
The results were similar to the earlier grain size specimens. All specimens tested work (1) in respect to comparative behavior. 0 0 sharp wellshowed K) 77 at those of most (and at 298 and 195 K
defined yield points, and a low rate of strain hardening.
For a given grain size the upper and lower yield stresses increased and the elongation to fracture decreased with decreasing Increasing the strain rate increased the upper and temperature. cases decreased as expected, and in most stresses, yield lower (The present 77 0 K behavior was somethe elongation to fracture. for commercial tantalum (1) what different from that observed 0
in which the strain rate at 77 K had no effect on the lower yield stress.) The size of the yield drop did not appear to vary in 4
)
any well-defined fashion with either strain rate, temperature, or grain size. However, the "true" upper yield point is seldom
realized in practice due to premature local yielding arising from random stress concentrations. For a given strain rate and temperature the effect of an increase in grain size (decreasing d-l/ 2 ) is to displace the curves
to a lower stress level. Comparative stress-straln curves are shown in Figure 4. This comparison was similar for all grain
sizes examined. Again, the 77 0 K behavior differed from that found in commercial tantalum (1) where reversal of behavior of lower yield stress with grain size was observed. In general, the elongation to fracture increased as the grain size decreased. All specimens showed local necking and once necking had commenced, continued to deform (to fracture) In the necked region. Area reductions in the necked region were greater than 90% and resulted in a ductile-type fracture. The majority of fractures were of the ragged shear type although a number of chisel edge types were found (see Table III for description of fracture surfaces). The preponderance of a given type did not appear to vary with test temperature or strain rate. A longitudinal section of a typical ductile fracture is shown in Figure 5. A microhardness traverse is also included to show the extent of work-hardening In the necked region. The results verify the conclusions of Adams and Tannuccl (4) that the true flow stress in this region increases markedly. Some specimens showed small light reflecting facets (Figure 6) but these appeared in specimens tested at all temperatures. The facets did not correlate with the grain size Implying that they are not grain boundary fractures. It should be pointed out that the facets do not appear to be as well developed as the cleavage facets found by Adams and Iannuccl (1)
in their 77 0 K tests.
2. The Petch relationship The variation of lower yield stress with grain size was the ma1t objective of the present investigation since this enables a determination of the dl and k parameters in the Fetch equation. The lower yield stress-gral size data of Table III are plotted in Figure 7. For a given temperature and strain to a straight line using the method rate the data was fitted of least squares. Although the reproducibility for specimens of identical grain sizes and test conditions was excellent, there exists some departure of points from the computed straight line. This departure is larger at the 77 0 K test temperature.
5
However, the small increase in lower yield stress with decreasing grain size is believed to be a real effect.
rvalues
The k and determined from the straight lines of Figure f are listed in Table IV. Due to the slight variation of the lower yield stress with grain size the k values are estimated to be accurate within ± 50%. Within fhis accuracy ky increases with decreasing test temperature for the low strain rite tests but shows little or no change with test temperature for the higher strain rate tests. The variation of ky with strain rate was not as well defined showing an increase at room temperature and a decrease at the lower temperatures with increasing strain rate. The results for commercial tantalum yielded a similar value of ky that did not vary with either test temperature or strain rate. The temperature variation of kIy for the "high purity" material in shown in Figure 8. The values of r (± 5% accuracy) increase with both decreasing test temperature and increasing strain rate. The variation with test temperature Is shown in Figure 9. B. Carbon Doped Material 1. General stress-strain behavior The stress-strain and fracture data obtained on the carbon doped specimens are listed in Table V. Representative stressstrain curves for these specimens are shown in Figure 10 for large grain size specimens and in Figure 11 for smaller grain Again the usual behavior is noted, i.e., for a given diameters. grain size the yield and flow stresses increased with increasing strain rate and decreasing temperature, with corresponding reductions in elongation to fracture. Strain hardening in the low strain rate tests at 298 and 1950K was somewhat larger than that found in "high purity" or commercial tantalum. Of particular significance here is the unusually large elongation to fracture obtained at 77 0 K (particularly at small grain sizes) and the fact that this elongation was larger for the higher strain rate tests. As a result the yield drops were particularly well defined in contrast with the yield drops on commercial and "high purity" tantalum at 77 0 K. The size of the yield drops did not follow any particular pattern with respect to temperature, strain rate or grain size. For a fixed strain rate and temperature the curves were generally displaced to lower flow stress levels for larger grain size specimens although the yield stresses did not0 differ Small grain size specimens tested at 77 K were significantly. In general the elongation to exceptions to this generalization.
6
I
At 77 0 K this fracture increased with decreasing grain size. with increased elongation was surprisingly large and not only decreasing grain size but was larger at the higher strain rate. The carbon doped specimens also showed typical ductile-type fractures with 90% or larger reduction in area in the necked In fact this necking was more pronounced than for the region. A longitudinal cross-section of the "high purity" specimens. The included microhardness Figure 12. in shown is region necked traverse demonstrates the extent of strain hardening In the deThe larger strain hardening in this case as formed region. compared with the "high purity" material (Figure 5) can be attributed to both the greater deformation (grain sizes are similar) This and higher carbon content of the carbon doped material. point will be further discussed in terms of strain hardening coefficients. In all of the large grain size carbon doped samples it was clear from photographs such as Figure 12 that fracture did not occur at the grain boundaries as one might expect In view of In the smaller grain size specithe grain boundary precipitate. mens the presence or absence of grain boundary fracture could not be ascertained by microscopic examination of the longitudinal cross-sections. Microscopic examination of the fracture surfaces revealed light-reflecting facets on only a relatively few specimens and It is believed that neither these were extremely ill-defined. cleavage nor grain boundary fracture occurred in the carbon doped samples. 2.
The Petch relationship
The lower yield stress-grain size plot iS shown in Figure 13 The straight lines were for each of the six test conditions. Fewer carbon doped squares. least of method the by computed again specimens were tested than for the "high purity" case but the range of grain sizes tested was larger than in the "high purity" Evito obtain. material where small grain sizes were difficult growth grain restricts solution in carbon interstitial dently the determined from The ky and rvalues upon recrystallization. slope obtained negative The VI. Table in listed are these plots at 1950K is not significant within the stated at the low rate test It is believed that k does not vary with experimental accuracy. temperature at 298 and 1950K in carbon doped Ihigh purity" Furthermore the values appear to be extremely small, tantalum. the grain size dependence of the lower yield stress in i.e.,
7
the carbon doped material is The behavior at 77 0 K is
nil. difficult to explain.
At the low
strain rate a small positive value of ky is obtained but at the high strain rate a sizable negative value Is computed. Adams and Iannucoi (1) also noted a peculiar behavior at 77 0 K for commercial tantalum in that below a certain grain size the yield stress decreased. It was suggested that this decrease might be due to the inability of the grain boundaries to arrest the dislocations from the initial strong yielding pulse. In the present work the data at the low strain rate were not obtained at sufficiently small grain sizes to ascertain whether or not a decrease in yield stress existed at these grain sizes (these tests are planned). The high strain rate tests did show a yield stress decrease at small grain sizes and could possibly be associated with the mechanism described by Adams, et al. The f' values are plotted as a function of test temperature in Figure 14. They vary with temperature and strain rate in the expected fashion. C. Comparative Behavior of "High Purity", Carbon Doped, and Commercial Tantalum It Is of interest now to compare the behavior of the three tantalum compositions, the commercial tantalum results being taken from the work of Adams and Iannucci (1). Comparative stress-elongation curves for similar grain sizes at temperatures of 77 and 298 0 K and at a strain rate of 10- 1 /sec. are shown in Figure 15. The most readily observable differences are the significantly higher yield stresses at all test temperatures and the higher flow stresses at room temperature of the commercial material as compared with the "high purity" and carbon doped materials. This can be attributed to the higher interstitial content, noticeably oxygen, of the commercial material. In comparing the "high purity" and carbon doped curves it can be seen that the carbon doped specimens showed slightly lower yield stresses but a greater rate of work-hardening than the "high purity" samples. This same behavior was observed at other temperatures, grain sizes, and strain rates. The lower yield stress of carbon doped samples is in part related to their lower oxygen content, and, as discussed later, the carbide particles acting as dislocation sources may also be important. These tests illustrate that interstitial oxygen is much more effective than carbon for restricting dislocation movement. Whether 8
locking or lattice friction stress is
more important will be
discussed later. All oxygen is in solution and based on reported solubility (6) for carbon In tantalum, it is estimated that about 100 ppm carbon is retained in solution in the carbon doped material after the recrystallization anneal. The carbon doped samples also exhibit more strain hardening than the other materials. The strain hardening coefficients of the room temperature curves shown in Figure 15 were obtained from the relationship
rK where
(
n
= true stress -
and
true strain
K
= constant
n
= strain hardening coefficient
These values are listed in Table VII. The fine carbide particle distribution gives rise to dispersion hardening and hence a larger value of n. The 77 0 K tests show another significant difference between the carbon doped and other samples. The carbon doped specimen exhibits a much larger uniform elongation prior to necking. This larger elongation Is directly related to the dispersion hardening created by the presence of the carbide particles, i.e., an increased restriction of necking brought on by the increased strain hardening. This ductility In the carbon doped specimens at 770 K was not so pronounced at large grain sizes and low strain rates, but was measurably larger than for the other two compositions. The large grain size and low strain rate tests also showed a less pronounced difference in yield stresses for the three compositions, a factor which would tend to minimize the relative difference In the onset of necking. Comparative lower yield stress-grain size plots for 298 and 1950K at a strain rate of l0-1/sec. for the three materials are
shown in Figure 16. One can see that at all grain sizes the lower yield stresses of the commercial tantalum are considerably higher than for the other two materials with the "high purity"
9
material being slightly higher than the carbon doped material for all Vain sizes tested. Note, however, that the extrapolated 01 value for the earbon doped material is larger than that for the *high purity.* The variation of 6 with temperature to compared in Figures 17 and 18. k varied significantly with temperature only in the "high purityl material, the range of values being from 0.65 to 3.4 X 10⁷
o.g.s. units compared to a constant va ue of 107 for the commercial material and a low (•-0.3 X 10') value for the carbon doped material. D. Comparison with the Results of Other Investigations
Two studies similar to the present one have been recently
reported. Owen, et al. (8) studied the effects of the interstitials, carbon, oxygen, and nitrogen In tantalum on the grain size-yield stress relationship and Koo (9) performed a similar snudy using a "high purity" vacuum melted tantalum with a total Interstitial content of 25 to 82 ppm with carbon being the major constituent. These results are compared to those of the present study in Figure 19. It must be realized that the strain rates used by Oven, et al. and Koo were respectively 16 and 5 times smaller than the present strain rate of lO- 3 /sec. Thus their curves are displaced slightly lower than they would be If the 3 lO- /sec. strain rate of the present work had been used. With respect to the strength levels It Is again readily apparent that oxygen is of prime importance since the 1147 ppm 02 of Owen et al. shows higher yield strengths than does the
82 ppm 02 commercial material, which in turn shows higher strengths than do the 40 ppm 02 "high purity" and the 3 to 20 ppm 02 materials (Koo). With respect to the grain size dependence of the yield strength, i.e., the ky values, the larger oxygen content materials show the larger slopes with the one exception, that of the work of Koo. The authors "high purity" plot here seems of unusually small slope compared to the faster strain rate tests (Figures 7 and 16) and the results of Koo. At other test temperatures the present "high purity" results agree with those of Koo. More tests at smaller grain sizes are needed for increased accuracy. These tests are planned. The carbon containing material of Owen et al. yielded a small ky value as did the present carbon doped material. However, their material presumably consisted of one phase and, as will be pointed out later, the low ky Is probably due to the low total solute content. It is somewhat surprising that this material showed yield strengths above the writers "high purity" material. The original data of Owen et al. showed considerable scatter and It may be that further experimental 10
investigation of this point is necessary. The values of k computed by Owen et al. from their yield stress-grain size daGa varied from about 0.5 to 2.5 X 10⁷ c.g.s. These authors computed much larger values of ky (up to 108) by the Luders strain method and these values varied with test temperature and grain size (recrystallization temperature) the ky values being smaller for small grain size specimens. As a check on the present work ky and 6-1 values were computed by the Ltiders strain method (using log true stress/log true strain extrapolation) for the extreme grain sizes in whigh purity* specimens tested at room temperature. The values are compared to the correspeoding The present yield stress-grain size plot values in Table VIII. Luders strain k also varies with grain size, being smaller for the smaller grain size specimens but does not differ greatly from the yield stress-grain size plot values. In the author's opinion the Luders strain method is not accurate. This criticism has been voiced by others (3)(10). IV. DISCUSSION The Petch equation was derived on the premise that dislocations are locked by impurity atmospheres, and that the LUders band propagates via dislocation pile-up at grain boundaries in yielded grains until their stress fields plus the applied stress activate sources in adjacent grains. To release thema sources a stress SIs required which is
i
6"-(1 y -
)(d/,l)1/
2
(3)
wherelim the distance to the source from the pile-up at the grain boundary. Setting
ky = 65 .1/2
(4')
and rearranging, results in equation (1), i.e., the Petch equation. Thus the locking parameter ky In also a function of source spacing.
a~s the lattice friction stress, is usually regarded as being
composed of two terms, 61 a temperature jWependent term arising from impurities and imperfections, and 61" a temperature dependent term attributable to the Peterls-Nabarro stress of the ketice. These concepts have recently been criticized rather extensively. Johnson (11) modified the original theory such that it would better agree with more recent experimental results by postulating that it is more difficult to propagate a Liiders band through a polycrystal than a single crystal because the regions near the grain boundaries 11
A more extensive in a polyorystal are severely work-hardened. critioism of the Petch relationship has been presented by Hahn (12). He developed an alternate approach, valid for both single crystals and polyorystalline boo metals, based on a concept presented by VIlman and Johnston (13) to account for their observed yield drop In LiF. Essentially this approach is based on the assumption that looked dislocations remain looked and that the yield drop Is a result of unlocked dislocations that multiply rapidly at a velocity which is stress dependent. Hahn accounted for the yield drop, continuous yielding, and delay time, however, the theory was not extended to Include the grain size dependence of the yield stress. The concept of yielding via unlocked sources can be used In conjunction with the original Petch equation to explain some of the present observations. The pertinent observations are as follows: (a)
ky for carbon doped two phase material is extremely low, I.e., the yield stress is essentially independent of grain size. (b) (commercial material)_ 61 (carbon doped) 6' (high purity"). (c) For a given grain size and test condition , the magnitude of the yield stress decreases in going from commercial to "high purity" to carbon doped material. (d) For a given grain size and test condition the flow stress Is In the order of commercial >carbon doped >,"high purity". (e) The work-hardening coefficient of carbon doped tantalum Is larger than that of the "high purity". (f) The elongation to fracture at low temperatures is significantly larger in the carbon doped than In the other materials. Following the unlocked source approach, the locking parameter ky should be dependent on the number of unlocked sources, and the stress to cause these to propagate at a velocity sufficient for multiplication. The low ky values in the carbon doped specimens can be explained in terms of the finely distributed carbide particles which act as dislocation sources. Due to thermal stresses unpinned dislocations can be generated at temperatures below that required for strain aging. This phenomenon has been demonstrated by Stokes (14). Thus a finely distributed second phase should increase the number of mobile dislocations available for motion and result in less locking and a smaller grain size dependence of the yield stress, i.e., both 6 andl are smaller where now 6 represents the stress required to activate unlocked sources in adjacent grains. The lower oxygen content of the carbon doped material would likewise favor les locking of dislocations by means of elastic interaction. Further support for the effect of a finely dispersed second phase In 12
yielding behavior can be obtained from an examination of the size According to the Johnston and Gilman theory, of the yield drop. mobile dislocations conan increase in the number of initially siderably reduces the yield stress and the magnitude of the yield drop. Although the magnitude of the yield drop exhibited much scatter and did not vary in any well-defined pattern with grain showed tests size, strain rate, or temperature, an average of all that the magnitude of the yield drop in the carbon doped material was smaller by a factor of 2 than in the "high purity" and significantly smaller, by a factor of 4, than in the commercial tantalum. Furthermore the measured yield stress in the carbon doped material was smaller than for the other two materials. The comparative values of the yield stress for the commercial and "high purity" single phase materials can be explained almost The larger interentirely on the basis of the impurity content. content (particularly oxygen) of the commercial material stitial mobile dislocations thereby raising reduces the number of initially Although the size of the yield drop is the upper yield stress. larger in the commercial material the lower yield stress and flow stress remains significantly above that observed for the "high This higher stress level in the impure material purity" material. accounts for the larger r values obtained from the grain size friction stress according plots and thus reflects a larger lattice Hahn (12) derived an equation of state in which to the Petch theory. the stress level is largely dependent on a parameter related to the The physical signifistress tequired for unit dislocation velocity. cance of this parameter and rare probably the same and in this respect the two theories do not differ. Except for the low strain rate/room temperature tests, k for the "high purity" tantalum was larger by a factor of 2 to 3 than This result is difficult to explain for the commercial material. One would expect a smaller number of mobile with either theory. dislocations In the commercial material and as a result a larger k The measurements of Koo (9) on a material of higher purity t~an the commercial material also showed higher ky values which, are in good except for the low strain rate/room temperature tests, Owen et al. also obtained agreement with the present results. higher ky values on their oxygen containing material, but there the oxygen content was larger than that of the commercial-material These differences cannot be and a higher ky would be expected. It must be realized that ky cannot be resolved at present. measured accurately when the grain size effect is small and furthermore, that changes in chemistry and structure with recrystallization temperature certainly will affect the experimentally determined ky. Also, the theories are not sufficiently developed at present experimental observations. to account for all
13
The larger work-hardening coefficient and larger elongation to fracture of the carbon doped material can be accounted for on the basmis of the dispersion hardening caused by the carbide precipitate particles. The larger amount of elongation Is directly related to increased restriction to necking as a result of the increased work-hardening.
14
V. 1.
BIBLIOGRAPHY Adams,
61-203,
M.A.,
and Iannuccl,
Contract No.
A.,
ASD Technical Report
AF 33(616)-7173 (1961).
2.
Petch, N.J., Phil. Mag.
3.
Cottrell, A.H.,
4.
Adams, M.A., and Iannucci, A., Materials Research Corporation Report No. 250, 4th Quarterly Progress, Contract AF 33(616)-7173 (August, 1961).
5. 6.
Adams, M.A., and Malo, C., Metals Progress, to be published. D.M.I.C., Battelle Memorial Inst., Report No. 152, Contract AF 33(616)-7747 (April, 1961).
7.
Adams,
8.
Owen, W.S. Report No.
et al., Manufacturing Laboratories, Progress 3, Contract AF 33(616)-6838 (November, 1961).
9.
Koo,
J. Less Common Metals,
10.
Meakin, J.D.,
11.
Johnson, A.A.,
12.
Hahn, G.T.,
13.
Johnston, W.G., 129 (1959).
14.
Stokes, R.J.,
M.A.,
R.C.,
Trans.
J.
Sci.
3, 1089 (1958). AIME 212,
Instruments,
Acta Met.,
9,
Phil. Mag.,
Acta Met.,
192 (1958).
36,
4,
444 (1959).
138 (April, 1962).
521 (1961). 7,
177 (1962).
10, 727 (August,
and Gilman,
J.J.,
J.
App.
submitted to Trans. AIME.
15
1962). Phys.,
30,
04ý
a
b
V~
FIG. 1 Microstructures of carbon doped material recrystallized at (a) 13000C; (b) 14L400c; ()1510OC; (d)l7200C. Mag. X100.
16
180/
A. 298* K, STRAIN RATE IOi'sec. SPEC. 15 c 2 F
B. C. 1950 K,
*
D. E. 770 K,
" "
F.
E
10'Vsec. SPEC. 20 c I 10"3 /sc. SPEC. 21 c 2 I0l1 /sec. SPEC. 21 c3 IO'/sc. SPEC. 15 c 3 I0"'/sec. SPEC. 20 c 2
U). E E
40I-J U)
w
z
re
2w z
20
o
A
20 30 40 50 0/6 ELONGATION REPRESENTATIVE STRESS-ELONGATION CURVES FOR "HIGH PURITY" SPECIMENS WITH d" 2 VALUES IN THE RANGE 1.25 TO 2.0 mm"-l2 00
FIG. 2.
17
A. 2980 K, STRAIN RATE IO-/sec. SPEC. 19 a I B. " Io0 I/sec. SPEC. 19 c 2
so
F
E
C. 1950 K, D. " E. 770 K,
"
F.
"
N
10"3/sec. SPEC. 19 a 2 IO1 /sec. SPEC. 17 c 2 10 3/sec. SPEC. 18 c 3 10'/sec. SPEC. 16 a 4
"
60
E
,.'
U)40 I 2o 1,9 UI U)
D
z
z z
01
0
10
20
30
40
"% ELONGATION FIG. 3. REPRESENTATIVE STRESS-ELONGATION CURVES FOR "HIGH PURITY" SPECIMENS WITH d-" 2 VALUES IN THE 2 RANGE 4.4 TO 5.5 mm"18
so
60-
770 K, d1/2
4.5 mm/ 11 F
770 K, d-1/2 1.25 mmn'/
2
E
E
w
FE
w_z w w uz
2-
z'
---
0-
1950 K, d"-1/2
4.4 mm"1/!
1950 K, d"1/t 1.9 mm"1/f
0
"0 FIG. 4
20 "0
30 40 50 e/* ELONGATION EFFECT OF GRAIN SIZE ON STRESS-ELONGATION CURVES OF "HIGH PURITY" SPECIMENS AT A STRAIN RATE OF
10- 3/sec
19
Speoism B1703 Test temp.
7OK.etrraln rate io03/s.o.
150
0 0 140
.0
130
120
110
100
1.0
3.0
2.0
4.0
Distance from fracture (mm) Hardness Fig5 Longitudinal "sotion of fracture zone. traverse shows extent of strain hardening In necked region. Spec. 01703. .Mag. X50.
20
FIG. 6 Light reflecting facet on fracture surface of specimen 20ci. Mag. X400.
21
w
w
00 0
.- j
00 0
0
M-. Z C-
0wS 1Z O "4U 6
1
00
0
~U.
zIU))
W0
-U,)
0
0
S~i1S (3-13A B)4w 22
8i3MO-1
00
w U
4
0 STRAIN RATE 10"3/ec 0
"
IO-/sec
3-
- 2 K
00
0
FIG. 8.
I00
200 300 TEMPERATURE OK THE VARIATION OF ky WITH TEST TEMPERATURE FOR OHIGH PURITY" MATERIAL.
23
75-
0o
x IOlysec
e I X IO' 3/sec
50
E
E S25
I00 FIG. 9.
200
300
TEMPERATURE *K THE VARIATION OF a~ WITH TEST TEMPERATURE FOR "HIGH PURITY" MATERIAL.
2,'
so 3 A. 2980 K, STRAIN RATE 10' /uc. SPEC. 13 B. " " 10' 1/sec. SPEC. 13 C. 1950 K, "1 10"isec. SPEC. 13 D. " 10"'sc. SPEC. 13 E. 770 K, 10" 3/sec. SPEC. 13 F. 10'/sec. SPEC. 13
F
E 60-
E 640
D
U) (I)
05
/.
ELONGATION
FIG. 10. REPRESENTATIVE STRESS-ELONGATION CURVES FOR CARBON DOPED MATERIAL WITH d-"' VALUES IN THE RANGE 1.5 TO 2.2 mm-°n 25
b c b c b c
I I 2 2 3 3
80I
F E
STRAIN RATE IO'l/sec. SPEC. II c 298° K, A. B. " " I101/sec. SPEC. 10 d 103 /ec. SPEC. II b C. 195 K, D. " " I0'/sec. SPEC. 10 a 10" 3/sec. SPEC. 12o E. 770 K F. " IO-/sec. SPEC. II o
I 2 2 3 I 3
60-
E
D 40
CDC
z z
20 10
0050 0/o
FIG. II.
ELONGATION
REPRESENTATIVE STRESS-ELONGATION CURVES FOR CARBON DOPED MATERIAL WITH d-n12 VALUES IN THE RANGE 4.5 TO 5.6 mm-"'1 116
WO
Specimen B22a
Test temp. 77OK-strain rate 10-3/0eo. 210
190 0 170
150
0
130 0
0
110 1.0
2.0
3.0
4.0
Distance from fracture end (mm) Fg12.Longitudinal section th-ough fracture zone of carbon Hardness traverse Meg. XS0. doped specimen B22A. shown extent of strain hardening In necked zone.
27
0 5:
w 0:
PtiJ
c
03 0
00 0:00
40
E )4 00
0
U. N:
*~
J0
o0
Ii~L
0 W-
U
z
o
75
50
IiE
E
S25 b
0 I X IO'-/sec 0
0
I X IO- sec
100
200 TEMPERATURE "K
FIG. 14.
THE VARIATION OF aý WITH TEST TEMPERATURE FOR CARBON DOPED MATERIAL. 29
300
lOOr F A. HIGH PURITY B. CARBON DOPED
2980 K "
" C. COMMERCIAL D. HIGH PURITY 770 K " E. CARBON DOPED F. COMMERCIAL
so
E 60_ E E U) U)
w Cc 41Lo
C
z -,
B
z
A
z
I&1
0
10
20
30
40
50
%/o ELONGATION
FIG. 15.
COMPARATIVE STRESS-ELONGATION CURVES AT 298 AND 770 K AND AT A STRAIN RATE OF IO-1sec FOR d-112 VALUES IN THE RANGE 4.5 TO 5.6 mm-""
60-
TEST TEMPERATURE 2980 K
.-
COMMERCIAL ---
-j
-
-
CARBON DOPED PURITY
-HIGH
0 FIG. 16.
6
d-1 / 2 mmVZ/ COMPARATIVE LOWER YIELD STRESS/GRAIN SIZE PLOTS FOR A STRAIN RATE OF 10-Vtoc. 31
0
COMMERCIAL
0 CARBON A HIGH PURITY 75
50
cmJ
E E
b
2 5
I
10 00
200
TEMPERATURE OK FIG. 17
COMPARATIVE c-i TEMPERATURE BEHAVIOR FOR A STRAIN RATE OF 0I'sec.
300
0 COMMERCIAL
0 CARBON A HIGH PURITY 75
50
E
25
Jr
I_______________________I
0I
I00
200
I
300
TEMPERATURE *K FIG. 18. COMPARATIVE vi TEMPERATURE BEHAVIOR FOR A STRAIN RATE OF I01'sec. 33
Owen et *l. 50 ppr Ci 74 ppa total Inter6.3 X 1O-5/160. @train rate. stitial
60-
Owen et a1. 147 pp/ 021 162 ppm total inter6.3 X 10- 5see. strain rate. stitial Koo, 3-20 ppm 0&; 25 to 82 pp. total inter5 X lO-l/set. strain rate. stitial Adams and Iannuccl, commercial tantalum 82 ppm 02; total interstitial 198 ppm; 10-•/sec. strain rate.
50
40 -"High purity* present work 3 interstitial 72 ppm;lO- /sec.
pPm 02; total strain rate.
Carbon doped present work 20 ppm 02; total
Interstitial 144 ppm;lO-J/sec.
strain rate.
4C
E
E S30 U,
w U)
0 -- --------...
Uj
...
--------------- --------...
-0J
S
4
2
6
MM-1/2 d d-1/2 m FIG. 19.
COMPARISON OF YIELD STRENGTH-GRAIN SIZE RESULTS WITH THOSE OF OTHER INVESTIGATIONS. ROOM TEMPERATURE TESTS, 34
TABLE I
GRAIN SIZE vs APPROXIMATE RECRYSTALLIZATION TEMPERATURES
Temperature
(*C)
Average Grain Size (mm-I/2)
High Purity
1100 1200
6.0 3.8
1 00 1500 1600
1.9 1.3 0.9 -
1400 1700
Carbon Doped
-
7.5
2.9
6.o 4.4 3.5 2.0
35
0
N
-
:r0
s
N4
IH
ar
\4
N~
V)
H a,
-9
H
H E-4
N
00
H
E-4
H
N
Go aý C'r
N
N1
0 r-I
a
H
A 4)
=~
4-)
co
1
0
4)
F4
0
c0
Plb 0O
'H 0
0
4V 0
4)
H0 l
36
oO
Oc-0\
o
C'0 Vo
4OHa\N'O'oON t(NCo*C\
NCý UN-ýIýA
N
*
,-4OV'~IV-1\ ovca NH OW\(14Ir\ n '.OrNV%
..
ON \ 4 N (\ N MCS n*
V-1
I
E-4
H
E-4
N
N
0
I
V)
\0a HN
0cH
0
\r4r4
~ Ic~
.
eO0H 'C 0 r4HaNNC n-t'i
pi~ N4
00
cc
0H
\0O4)\0\O
C04.'0
E-
10 CcOr~N 04~.OO
4
r-IN M
HU
.4
H0
I-
C
0 AH
~
C\ VA
V)z
E-4
l
n
V
04. a 0%0
00 C rI0
.,M
l
1
m51m
00 D\ MI 9
r0
HNNCl . 0 0A 0 c0 -OM00 h\ 2m
MM
.1
~~~~P~~t rd.4H 4 ~.44) 1t ~F 000£4IH
1:czcH*
'd'37
10
N mna\O\HO 0 NNHNH NH
HH r
N~lH
~
H
;
W
00
0
.
*
0000
eg..
czC
H
(,
00
0 ;:
V'0
*0 0
*
\UV C- r-4-.~OO
cl
*
V
o
0o
0
f
'\OOCl- H
*
0
C
'-Hz
o-~ 00
H %.) '
"I
Nr-
NI
0
CN(NnD\
t:
C
Il)
0
I
0
0
l IACNC4 0
nciCj\
DrI
~
0 ~H\0\
\
-
H-
0
P40
0
nNNO(%JcG\ H r-4H IHH
I-
o9
V4
0
o
? co
I
0 0POO r 0H H
o
i\0C\0 (V
m H
-
38
~
HC4ci
~ rI
01 ý l
C'-
-
0ý )0
HNN\ 0C.0
m
m
0
co
N 04
MM44
0J
04.)- (a
WC
040 0
0.
NP
~,
1-
E-4S
00 cc) CýOC'-
0
'.4 I--,
H 4
-N
N
H \) 0
00\0-OD
-C-C
IClVC)n-
N0
'
H
0
&Z
C.-
F
39
TABLE IV
ri AND ky VALUES BY PETCH METHOD FOR HIGH PURITY TANTALUM
Temperature
Strain Rate
d• m-2
Kc..g.
ky
(OK)
(see.)
298
io-3
16.2
0.66
298
10-1
23.0
2.05
195
10-
3
99.6
3.03
195
10-1
39.5
2.38
77
10-
3
64.8
3.39
77
10-1
74.1
1.63
40
10?
0
0
1k(%N
r
mC C- -
O
u-
OHrI0%4
~ ~N
-3 n
N
~N9-0N ~
Cl%.0N ND\
Wl-~4%0'
t00C
C-N (MC\ 6\V
4r 0
1.0
0
ON
m-IuN
rN
0
MO%40
coa~
O(v* o%
0
0E-4
z I
N
Nq
3
P4
E- M
4
4
I C- c Ul V
N
I*
o~t
ul No
H U)
0O SI 4
3
1nHC'%' Io
'OOgN\ 000SI
I*.
N~~' Ht~ ...
H
0 E-S~4~
4~
P, El4
I
HN4VC
Ik
w 0N'0 000
to
r-
0
C\1 II 00 fo H Co
N 4
HN-n*o4j
4
C) t~~C)
H
E-4 PC
-4g4. 00 H HuIE-1r44 A~.;
0
0~~
O't nMooM
I
N I
%W~'NN
.*
E1
N
a..4islm
N1
cq *V :~
H
o-
-4 H \0 \0 H H \ON\ CY\
C*-f-.*O\Hr
No
'r'Cy\-0 N
044 0
'N I I
Io
co 0 14 +ý
'-oOH 9 - W@N
'-t%'l-'9 ý O\ nSS44 @@*
4Ol\C
1n
C
0
I
H E-'-
C)
cn
A
0
0
HC'-
.O0.OG)0tcc,0 n (Y)n Ci1N n W 0 CVI-NN 0 Vn- (H0H N 4 CQ-SN NHH 04Hrr-r-I
cm m fnMmcfnm
42
Mm 9Qmm
TABLE VI 6-1ALD ky VALUES BY PETCH METHOD FOR -CARBON DOPED TANTALUM
Temperature (OK)
Strain Rate (sec.)
.Imm"
2
k c.g.s.
X 107
298
io-3
17.5
0.24
298
10-1
25.41
0.07
195
l0-3
.6.0
0.83
195
10-1
41.8
0.39
77
lo-3
68.7
0.22
77
10-1
76.2
1.79
43
TABLE VII RELATIVE STRAIN HARDENING OEFFICIENTS FOR ROOM TEMPERATURE TESLS AT 10- /sec. STRAIN BATE
Material
Strain Hardeninx Coefficient
Carbon Doped
0.10
Commercial
0.095
OHigh Purity'
0.070
44
0
Cl)-
~N0
M 0' r
n 0' M
"%
14,
N
rIa
0-
0O
N
0i
r-.0
Ni
NUH
H
0. m
>
CVI
H4
m
m
0H m4-
H-
l
H-
H
HH
H %0 %D
Nm
C0
*
0m"
H
%0
V.
*
A.
hI *p
.0
.
-b .4
o 1.
400 0 F.
(1.
11 06 1-
a.00 0 A
ja
0d
.4
a
..
41
h0.h
dd11
u
0
91 to I~
C3
w
1
~
1
-26
.
C
Oh
d
dO A.
1.A
0.g-. 4
U
A0
41
hE a.
d
1. 0.v 0'01A *-.
i
0 -#. 0 qO., h
~
*
AA.eU.
d4.
~
1
0~
0.4
1. .00 IM..
40
P
.00.
M4.
0.
.4
0
A
A,
.400
-
C d0l4 0.
.4
I.
0
0
.
d0
~
1
.
4, A
*0CA
h. 0z
~~
.d A
C3
AU
41
0
.
A1C,
0 'nI.C -w0.
- 3
a.
A
#4.~.
Ad
o
a
d
IdA
C0
I
10.
g = U0 Ah.UA.5 *0 .
.=o
* -0
96 UA
~0
S.h
4.4 t0o d*
A tW I. d *00-
d
A
' .IS*
0.0.'h
-No0
0.4
~ do g.
d I
d
* A
k
a 0
12
4. 1.
G
0A0baU%.-
0
12i0 Id
* 0.-4 4.41.AS
A
.
-0
a4
40
00-
0
A3 w
..
kd
oU A .551.
U 0
AU,-A -
0
d-