THE LEADING SWISS PRIVATE BANKING GROUP Boris Collardi Chief Executive Officer Bank of America Merrill Lynch 21st Annual Financials CEO Conference London, 27 September 2016
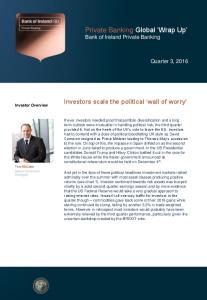
JULIUS BAER: PURE-PLAY PRIVATE BANKING GROUP Well positioned for further growth
KREUZLINGEN BASLE ZURICH
BERNE
KIEL
DUBLIN
HAMBURG
AMSTERDAM
DUESSELDORF LONDON FRANKFURT LUXEMBOURG WÜRZBURG GUERNSEY MANNHEIM VIENNA STUTTGART MUNICH GENEVA ZURICH MILAN TURIN MONACO
ST. MORITZ
SION
CRANS-MONTANA VERBIER
MADRID
ZURICH ISTANBUL BEIRUT TEL AVIV CAIRO DUBAI MANAMA MUMBAI4 ABU DHABI
NASSAU
TOKYO SHANGHAI
HONG KONG
SINGAPORE
SANTIAGO DE CHILE
BELO HORIZONTE RIO DE JANEIRO
SÃO PAULO MONTEVIDEO
• Premium brand in global wealth management • Strong expansion into growth markets
PANAMA CITY
LIMA
• Rich heritage – celebrated 125 years in 2015
• Client-centric approach
LUGANO
MOSCOW
ROME
MEXICO CITY
ZUG LUCERNE
LAUSANNE GENEVA
ST. GALLEN
• Present in more than 50 locations • >5,800 highly dedicated staff, incl. almost 1,300 RMs1 • Total client assets CHF 397bn1 • AuM CHF 311bn1 • Well capitalised: – BIS total capital ratio 17.3%1,2 – BIS CET1 ratio 15.9%1,2 • Moody’s long-term deposit rating Bank Julius Baer & Co. Ltd: Aa2
Legend
1
Head office
Location
Booking centre
GPS (100%)
Kairos (80%)
NSC (40%)
At 30 June 2016 |
2
• Market capitalisation: CHF 9bn3
Phase-in ratios | 3 At 21 September 2016 | 4 Additional advisory locations in Bangalore, Chennai, Kolkata and New Delhi 2
JULIUS BAER GROUP STRATEGY Consistently executed since launch of new Julius Baer Group in 2009 Pure Private Banking
• •
Focus on pure private banking business Targeting private clients and family offices as well as EAMs
Leverage International Platform
•
Leverage global footprint to source AuM growth and enhance client proximity Switzerland: gain market share Europe: selectively expand offering domestically and out of Switzerland for key markets Asia: continue building “second home” in fast-growing market Other markets: opportunistic growth in Central and Eastern Europe as well as in Latin America, the Middle East and Indian subcontinent
Switzerland
• •
Europe
Asia
• •
Other
Generate Growth Organic M&A
Client-centric Business Model
• • • •
Generate steady net new money throughout cycle Continue careful hiring of experienced relationship managers Selective acquisitions to support growth strategy Strong balance sheet conservatively managed with low-risk business profile
• • •
Client-centric service excellence and management culture True open-architecture and innovation as key differentiating factor Experienced and committed management team 3
MARKET ENVIRONMENT Environmental analysis
Markets / Economy
Clients
Julius Baer Group Competition
Regulation
4
INVESTING TO WIN IN THE NEW ENVIRONMENT Improving the business across multiple inter-linked dimensions
Enhancing client experience
Technology transformation
(e.g. via Your Wealth)
Realignment of front organisation (aligned to clients’ needs)
Organic growth (via RM hiring initiative)
5
JULIUS BAER - YOUR WEALTH ‘What matters to you?’
WEALTH PLANNING
WEALTH MANAGEMENT
WEALTH FINANCING
ADVICE BASIC
ADVICE PREMIUM
ADVICE ADVANCED
DISCRETIONARY MANDATES
Advice for independent investors
Personal advice and systematic portfolio monitoring
Dedicated investment advisor and tailor-made investment strategy
Full delegation and professional wealth management
• Global roll-out of new service models initiated in September 2015 in Switzerland • Introduction of new service models on-track • Approximately 40% of total AuM in advisory and discretionary mandates • Holistic advice as a key differentiator in challenging market environment • New discretionary investment approach based on active risk management / active asset allocation launched by Investment Management
6
TECHNOLOGY TRANSFORMATION Multi-year project to improve client/RM experience and operating efficiency
Major benefits: modern, efficient and scalable system for clients, RMs and the bank • Platform: harmonised process, implementation in Asia planned for H1 2017 and building on the recent successful integration of CISAL platform for Europe • Channels: delivered in steps, with first enhanced digital capabilities already implemented in May (upgraded e-banking service in Switzerland)
• RM Workplace: integrating all relevant RM tools into one dedicated workplace Platform
Channels
RM Workplace
• Targeted efficiency: minimised customisation and maximised standard processing
7
REGIONAL STRATEGIES Realigned for the next phase of growth
Switzerland
Europe
Emerging Markets
Latin America
Asia Pacific
L a Thailand o s
Strategy
• Further increase market share in home market • Accelerated investments into organic hiring
• Taking advantage of integrated European Markets • Luxembourg as key cornerstone of new Region
• Second pillar of growth • Further strengthening hub in Dubai
• Focus on organic growth • Identify further onshore opportunities in key markets (e.g. GPS, NSC)
• Second home market • Julius Baer positioned in top segment • Strong hiring initiative
Aligning the organisation to the market-specific needs of our clients
8
TRACK RECORD OF SIGNIFICANT AuM GROWTH On back of net new money and acquisitions
Development of assets under management 31.12.2008 – 30.6.2016 (CHF bn)1
Since creation of new Julius Baer Group: • AuM increased from CHF 129bn to CHF 311bn (+141%)
1
NNM recorded at CHF value when funds are transferred; acquisitions recorded at CHF value when transaction or asset transfer completed; currency impact calculated each year (half year in case of H1 2015) by applying difference between end-of-year (half year) exchange rates and start-of-year exchange rates to the start-of-year AuM level and using the start-of-year currency breakdown of AuM; the remaining difference between end-of-year (half year) and start-of-year AuM is market performance. The graph shows the sum of the market performance and currency impact thus calculated for each of the years (and H1 2016) in the period under review 9
AuM GROWTH DRIVEN BY RM AND PRODUCTIVITY INCREASE Relationship Managers
AuM per RM
(# of RMs)
(CHF million)
+107% 674 1,284 3 3911 -422 62
85 619
43
11
48
2008 – June 2016: • AuM increased by 141% (to CHF 311bn) Dec 2009 2010 2011 2012 2013 2014 2015 H1 June 2008 2016 2016
1
• Number of RMs grew by 107% (to 1,284) • AuM/RM grew by 16% (to CHF 243m)
2013: +391, mostly from RMs transferring in from Bank of America’s International Wealth Management business (IWM) outside the US | 2 2014: -42, driven by IWM transaction-related synergy realisations | 3 2015: +62, of which net 40 from hiring, remainder from acquisitions | 4 Including 20 RMs joining from Kairos 10
2016: TAKING ADVANTAGE OF HIRING OPPORTUNITIES Confirming position as employer of choice with >200 new RMs (gross) joining in 2016 Accelerated organic growth initiative • Successfully closed IWM transaction
Key attractiveness factors
• Julius Baer brand attractive for RMs/clients • Sector consolidation and regulatory uncertainty in WM industry facilitate hiring
>200 new RMs joining in 2016 • Based on already completed signings, over 200 RMs (gross) will join this year • Net increase expected to be well over 100 well above 40 RMs (net) hired in all of 2015 • Global initiative with majority joining in Hong Kong, Singapore, Switzerland and Monaco • Short-term cost/income ratio increase… • … but expected to significantly support net inflows and revenue growth in mediumterm
• Excellent brand recognition • Committed purely to Private Banking • Final settlement with DOJ abolished uncertainty • Client-centric approach and offering best-in-class investment solutions on an open product platform • Reached critical mass in all markets • Develops and retains best professionals along the private banking value chain • Conservative balance sheet – Deposit-driven – Loan-deposit ratio 0.57 – Moody’s long-term deposit rating Bank Julius Baer & Co. Ltd: Aa2 11
2016 GUIDANCE AND MEDIUM-TERM TARGETS FY cost/income ratio1,2 currently expected at 68-69% (vs. 64.7% in H1 2016) H1 2016 (adjusted results1)
Current guidance for FY 20165 (adjusted results1)
Medium-term targets (adjusted results1)
Cost/income Ratio1,2
64.7%
Pre-tax profit margin1,3
32bps
>30bps
Net new money4
3.7%
4-6%
68-69%
64-68%
• H1 2016 benefited from two positive items (Kairos, pension fund plan) – without these, CIR would have been 71% • A year of accelerated investments – H2 2016 will see even stronger RM increase than H1 2016 – investment increase partly offset by cost savings announced last May FY 2016 cost/income ratio2 currently expected in 68-69% range5 (vs. 64.7% in H1 2016) • Medium-term targets reaffirmed 1 Excluding
amortisation of intangible assets, integration and restructuring costs related to acquisitions or divestments | 2 Adj. cost/income ratio, calculated excluding valuation allowances, provisions and losses | 3 Adj. pre-tax profit divided by monthly average AuM | 4 (Annualised) net new money as % of AuM at end of previous period | 5 Assuming no significant deterioration in market conditions and currency developments from current levels 12
PROVEN AND DYNAMIC BUSINESS STRATEGY Continue to manage the Group for sustainable growth and profitability
• Proven business model – also when sector/markets in turmoil
Pure private banking
• Trusted brand to attract new clients - based on holistic, unconflicted service model
private banking talent - based on employer-of-choice status
• Organic growth combined with opportunistic M&A
Dynamic strategy
Investing for tomorrow
• New organisation aligned with priorities for the years to come • Global technology transformation over the next 3-5 years leading to improved client experience and operating efficiency
• Ongoing hiring of front- and back-office talents • Yet, careful management of running costs Sustainable long-term value creation
13
APPENDIX
Selected slides from H1 2016 results presentation
14
SCOPE OF PRESENTATION OF FINANCIALS
Financial results are presented as usual on the adjusted basis • Excluding integration and restructuring expenses and amortisation of intangible assets related to previous acquisitions or divestments, as well as taxes on those respective items • In order to ensure a meaningful comparability with the underlying business performance in the previous year, certain figures for the previous year are additionally provided excluding the USD 547 million (CHF 521 million) provision taken in 2015 (CHF 326m in H1 2015, CHF 195m in H2 2015) for Julius Baer’s settlement with the US Department of Justice concerning Julius Baer’s legacy US cross-border business. The final settlement was announced on 5 February 2016 • Reconciliation from the IFRS results to the adjusted and underlying results is outlined on slide 23 • Please refer to the 2016 Half-year Report1 for the IFRS results
1
Available from www.juliusbaer.com 15
AUM INCREASE OF CHF 12bn (+4%) TO CHF 311bn Driven by continued net inflows and first-time consolidation of Kairos
Development of Assets under Management CHF bn 299.7
+5.5
+8.6
+1.6
-4.0
311.4
• AuM CHF 311bn, +4% vs. year-end 2015 – Net new money
284.0
CHF
+5.5bn
– Acquisitions (Kairos) CHF
+8.6bn
– Market performance
CHF
+1.6bn
– Currency impact
CHF
-4.0bn
• Average AuM1 of CHF 301bn, up +6% from CHF 284bn in H1 2015 • Assets under custody CHF 86bn, unchanged from year-end 2015 • Total client assets CHF 397bn, up 3% from year-end 2015 June 2015
1
December 2015
Net New Money
Net Market Acquisitions Performance
Currency Impact
June 2016
Calculated on the basis of monthly AuM levels 16
NET NEW MONEY 3.7% – CLOSE TO TARGET RANGE Inflows accelerated after slow start to year
Net New Money in CHF bn and %1 3.6% 3.8%
• NNM: CHF 5.5bn (3.7% annualised) 5.9% 3.8%
4.5% 3.9%
3.7%
7.5 6.5
5.6
5.2
5.5
• Continued inflows from Asia, Middle East, CEE, local businesses in Switzerland, Germany and Italy, and cross-border European business …
4.1 3.4
1
• … partly offset by slow momentum in LatAm and some client deleveraging in Asia
H1 H2 2013 2013
H1 H2 2014 2014
H1 H2 2015 2015
FY 4.0%
FY 5.0%
FY 4.2%
H1 2016
• European tax regularisation completed
(Annualised) NNM in % of AuM at the beginning of the period 17
OPERATING INCOME +1% TO CHF 1.4bn Supported by higher net interest income and Kairos fair value adjustment Compared to H1 2015:
CHF m 1,425
1,408 15
1,286 10
217
58 118
vs. H1
vs. H2
2015
2015
+1%
+11%
+292% +476% -46% -46%
219 510
384
+33%
+56%
327
Net commission/fee income -7% to CHF 739m • Mainly on lower brokerage commissions following lower client risk appetite
Net interest/dividend income +33% to CHF 510m • Excl. dividend income on trading portfolios1: +26% to CHF 330m • Driven by 12% increase in loan book, higher credit spreads and improvement in treasury income … • … and despite net negative impact from negative interest rates
792
730
739
-7%
+1%
Net trading income -46% to CHF 118m • Crediting back dividend income on trading portfolios1: -12% to CHF 298m • FX volumes decreased from very strong H1 2015 …
H1 2015
1
H2 2015
H1 2016
Other ordinary results
Net trading income
Net interest & dividend income
Net commission & fee income
• … but clearly improved from H2 2015 levels
Other ordinary results +CHF 48m to CHF 58m • CHF 39m positive fair value adjustment resulting from acquisition of 60.1% stake in Kairos
Dividend income on trading portfolios H1 2016: CHF 180m (H1 2015: CHF 122m, H2 2015: CHF 17m) 18
GROSS MARGIN1 -4bps TO 95bps, IMPROVED FROM H2 2015 Excluding Kairos fair value adjustment: 92bps 2014 94bps 95
2 14 22
57
93
2015
2016
94bps
95bps
99 88 1
2
2
15
16
21
21
56
55
1
95
• Net commission/fee income 49bps 4
(-7bps vs. H1 2015; -1bp vs. H2 2015)
20
1 16
20
• Net interest income2 22bps (+4bps vs. H1 2015; +1bp vs. H2 2015)
18
20
21
22
• Net trading income2 20bps (-4bps vs. H1 2015; +4bps vs. H2 2015)
56
53
50
24
• Other ordinary results 4bps 49
(+3bps vs. H1 2015; +3bps vs. H2 2015) – Helped by Kairos positive fair value adjustment (CHF 39m, 2.6 bps)
H1 2014
H2 2014
Net commission & fee income Net trading income Full year 1 2
H1 2015
H2 2015
H1 2016
Net interest & dividend income Other ordinary results
Operating income divided by average AuM in basis points. Average AuM for H1 2016 was CHF 301bn, up 6% compared to H1 2015 and up 3% compared to H2 2015 Net interest income adjusted to exclude dividends on trading portfolios, net trading income adjusted to include the same (H1 2014: CHF 63m, H2 2014: CHF 9m, H1 2015: CHF 122m, H2 2015: CHF 17m, H1 2016: CHF 180m) 19
OPERATING EXPENSES1 -27% TO CHF 0.9bn Excl. H1 2015 US provision: -1%, helped by CHF 63m positive pension fund impact
vs. H1 vs. H2
CHF m
2015
2015
1,280 1,106 326 954 45 278
630
H1 2015
C/I3 64.7%
-15%
910 50 284
Personnel expenses -1% to CHF 623m • Helped by +CHF 63m impact following pension fund plan amendment in Switzerland • Excl. pension fund impact: +9% to CHF 686m
195
• Average FTE +5%, reflecting significant growth investments
940 31
-1%
+3%
-31%
-37%
285
+3%
+0%
• Growth investments will continue in H2, partly offset by cost measures
+8%
General expenses2 -53% to CHF 285m • Excl. H1 2015 US provision: +3%
577
623
H2 2015
H1 2016
69.9%
64.7%
Personnel expenses Depreciation/amortisation 1
-27%
Compared to H1 2015:
-1%
• Underlying increase partly reflects investments in technology upgrade
General expenses 2 US provision (USD 547m)
Excluding amortisation of intangible assets, integration and restructuring costs related to acquisitions or divestments | 2 Including valuation allowances, provisions and losses | 3 Cost/income ratio not considering valuation allowances, provisions and losses
• Valuation allowances, (non-US) provisions & losses down CHF 24m to CHF 18m
Cost/income ratio3 64.7% • Excl. pension fund expense impact: 69.1%
20
ADJUSTED NET PROFIT H1 2016 UP 270% TO CHF 402m Excluding H1 2015 US provision: +5% to CHF 402m
CHF m
H1 2015
H2 2015
H1 2016
Change H1 16/H1 15
Change H1 16/H2 15
Operating income
1,408
1,286
1,425
+1%
+11%
Adjusted operating expenses Adjusted profit before taxes Adjusted pre-tax margin (bps) Income taxes
1,280 128 9.0 19
1,106 181 12.4 10
940 485 32.2 83
-27% +278% +23.2 bps +326%
-15% +168% +19.9 bps +700%
109
170
402
+270%
+136%
0.49 15.2%
0.78 5.7%
1.84 17.1%
+274% +1.9 pts
+138% +11.4 pts
954 454 32.0 70
910 376 25.8 59
940 485 32.2 83
-1% +7% +0.2 bps +18%
+3% +29% +6.5 bps +42%
384
317
402
+5%
+27%
1.75
1.45
1.84
+5%
+27%
15.5%
15.6%
17.1%
+1.6 pts
+1.5 pts
Adjusted net profit for the Group1 Adjusted EPS attributable to shareholders of Julius Baer Group Ltd. (CHF) Tax rate Compared to 2015 underlying results:
Excluding 2015 US provision: 2
Adjusted operating expenses Adjusted profit before taxes Adjusted pre-tax margin (bps) Income taxes 1
Adjusted net profit for the Group (excl. US provision) Adjusted EPS attributable to shareholders of Julius Baer Group Ltd. (CHF) Tax rate 1
Excluding amortisation of intangible assets, integration and restructuring costs related to acquisitions or divestments. Including these positions (see also slide 23), the net profit was CHF 362m in H1 2016, up 812% from CHF 40m in H1 2015, and up 337% from 83m in H2 2015 | 2 US provision of CHF 326m in H1 2015 and CHF 195m in H2 2015 21
ADJUSTED* (EXCL. 2015 US PROVISION) FINANCIAL PERFORMANCE Half-yearly CHF m
H1 2015
H2 2015
H1 2016
Change H1 16/H1 15
Change H1 16/H2 15
H1 2016 in %
Net interest and dividend income 1
384
327
510
+33%
+56%
36%
Net commission and fee income
792
730
739
-7%
+1%
52%
217
219
118
-46%
-46%
8%
15
10
58
+292%
+476%
4%
Operating income
1,408
1,286
1,425
+1%
+11%
100%
Personnel expenses
630
577
623
-1%
+8%
66%
General expenses 2
278
284
285
+3%
+1%
30%
45
50
31
-31%
-37%
3%
Operating expenses
954
910
940
-1%
+3%
100%
Profit before taxes
454
376
485
+7%
+29%
32.0
25.8
32.2
+0.2 bps
+6.5bps
70
59
83
+18%
+42%
Net trading income
1
Other ordinary results
Depreciation and amortisation
Pre-tax margin (bps)
4
Income taxes Adjusted net profit for the Group (excl. US provision) Adjusted EPS attributable to shareholders of Julius Baer Group Ltd. (CHF) Gross margin (bps)
4
Cost/income ratio (%)
5
Tax rate Staff (FTE) Valuation allowances, provisions and losses Net new money (CHF bn)
384
317
402
+5%
+27%
1.75
1.45
1.84
+5%
+27%
99.2
88.1
94.7
-4.5 bps
6.6 bps
64.7
69.9
64.7
-0.0% pts
-5.2% pts
15.5%
15.6%
17.1%
+1.6% pts
+1.5% pts
5,378
5,364
5,856
+9%
+9%
42.5
10.8
18.2
-57%
+68%
6.5
5.6
5.5
-15%
-2%
Assets under management (CHF bn)
284.0
299.7
311.4
+10%
+4%
Average assets under management (CHF bn)
283.9
292.0
300.8
+6%
+3%
* Excluding amortisation of intangible assets, integration and restructuring costs and excluding US provision
Net interest income contains dividend income (H1 2015: CHF 122m, H2 2015: CHF 17m, H1 2016: CHF 180m) on trading portfolios | 2 Including valuation allowances, provisions and losses | 3 Including non-controlling interests of CHF 1.0m for H1 2015, CHF 0.9m for H2 2015 and CHF 1.2m for H1 2016 | 4 Based on average AuM | 5 Not considering valuation allowances, provisions and losses 1
22
RECONCILIATION ON HALF-YEAR BASIS IFRS to adjusted net profit and (2015) underlying net profit for the Group H1 2015
H2 2015
H1 2016
Change H1 16/H1 15
Change H1 16/H2 15
Profit after tax for the Group per consolidated Financial Statements (IFRS) 1
39.7
82.8
362.1
+812%
+337%
Amortisation of intangible assets related to the UBS transaction
37.0
30.8
-
-
-
Amortisation of intangible assets related to the ING transaction
8.2
8.2
8.2
-
-
Amortisation of intangible assets related to the IWM transaction
16.8
17.7
18.1
+8%
+3%
Amortisation of intangible assets related to the GPS transaction
2.4
2.0
2.1
-13%
+4%
Amortisation of intangible assets related to the Leumi transaction
0.3
0.5
0.5
+50%
+0%
-
0.2
0.5
-
-
CHF m
Amortisation of intangible assets related to the Fransad transaction Amortisation of intangible assets related to the Kairos transaction
-
-
4.4
-
-
Integration and restructuring costs
10.1
36.2
11.4
+13%
-69%
Tax impact
-5.7
-7.8
-5.3
-8%
-33%
Net impact
69.1
87.6
39.8
-42%
-55%
Adjusted net profit for the Group
108.8
170.4
402.0
+270%
+136%
US settlement, provision
326.0
195.3
-
-
-100%
Tax impact
-50.8
-48.2
-
-
-100%
Net impact
275.2
147.1
-
-
-100%
Underlying net profit for the Group (2015)
384.0
317.5
402.0
+5%
+27%
Note: • UBS transaction-related amortisation of CHF 74.0m p.a. started in December 2005 and ended in November 2015
• Kairos transaction-related amortisation started in April 2016 and will end in March 2026; for April-June 2016 it amounted to CHF 4.4m 1
Please see detailed financial statements in the Half-year Report 2016 23
SOLID BALANCE SHEET – LOW RISK PROFILE High liquidity – Loan to deposit ratio 0.57
CHF bn
Assets Due from banks
Loans (incl. lombard lending and mortgages to private clients)
8.2 (6.9)
CHF 87.8bn (CHF 84.1bn)*
Liabilities & Equity 6.9
(4.7) Due to banks
Loan-todeposit ratio 0.57 (0.56)
36.7 (36.4) 64.6 (64.8) Due to customers (incl. client deposits)
Trading portfolios
7.3 (9.0)
Financial investments available-for-sale
17.4 (16.6)
Cash
12.0 (9.2)
Others
Goodwill & other intangible assets
3.4 (3.7) 2.8 (2.3)
Liability Driven
6.2 (4.3)
4.9 (5.4) 5.2 (4.9)
Financial liabilities (structured products issued) Others (incl. hybrid instruments) Total equity
Figures as at 30 June 2016, summarised and regrouped from Financial Statements * In brackets: figures as at 31 December 2015 24
17.3% BIS TOTAL CAPITAL RATIO Significantly above regulatory requirements 30.06.2015
31.12.2015
30.06.2016
Basel III 3 phase-in
Basel III 3 phase-in
Basel III 3 phase-in
12,790 505 758 4,044 18,097
13,775 510 777 4,233 19,295
14,597 481 877 4,452 20,407
13,128 378 758 4,044 18,308
14,042 373 777 4,233 19,425
14,726 369 877 4,452 20,424
3,457 3,457 158 593
3,534 3,534 0 908
3,251 3,251 0 928
2,448 3,042 0 593
2,368 3,277 0 908
2,090 3,018 0 928
3,680 169
3,748 171
3,115 0
3,346 0
CET1 capital ratio 1
19.1%
18.3%
3,524 150 15.9%
13.4%
12.2%
3,146 0 10.2%
Tier 1 capital ratio
1
19.1%
18.3%
15.9%
16.6%
16.9%
14.8%
Total capital ratio
1
20.3%
19.4%
17.3%
17.0%
17.2%
15.4%
0.54
0.56
0.57
0.54
0.56
0.57
Liquidity coverage ratio (LCR)
193.5%
172.1%
167.4%
193.5%
172.1%
167.4%
Net stable funding ratio (NSFR)
126.2%
123.7%
124.4%
126.2%
123.7%
124.4%
77,968
82,458
86,556
77,968
82,458
86,556
4.4%
4.3%
3.8%
3.9%
4.0%
3.5%
BIS approach / CHF m Risk-weighted positions Credit risk Non-counterparty-related risk Market risk Operational risk Total risk-weighted positions CET1 capital 1 Tier 1 capital 1 - of which tier 1 capital 'preferred securities' 2 - of which tier 1 capital 'fully eligible Basel III instruments' Eligible total capital
1
- of which lower tier 2 instruments
2
Loan-to-deposit ratio
Leverage exposure (LERA) Leverage ratio (LERA, tier 1 divided by total exposure)
30.06.2015 31.12.2015 30.06.2016 Basel III Basel III Basel III fully applied fully applied fully applied
Regulatory capital requirements (phase-in)4:
Julius Baer floors (phase-in):
BIS total capital ratio >12.2 %
BIS total capital ratio >15%
BIS CET1 capital ratio >8.0%
BIS CET1 capital ratio >11%
1 After dividend | 2 Old style capital instruments, which do not qualify under Basel III. Phase out period is 10 years, straight-line, starting 2013 | 3 In Switzerland the Basel III framework came into effect on 1 January 2013. The Basel III effects but also the effects of IAS 19-revised relating to pension liabilities will be phased in between 2014 and 2018 for the calculation of the eligible capital. Furthermore, non-compatible Basel III tier 1 and tier 2 capital instruments will be phased out between 2013 and 2022 | 4 Includes 0.2% for SNB temporary countercyclical buffer for Swiss mortgages
25
BREAKDOWN OF AUM Asset mix
30.06.2015
31.12.2015
30.06.2016
27%
27%
26%
19%
19%
20%
24%
23%
24%
3%
4%
3%
21%
21%
20%
5%
5%
5%
1%
1%
2%
100%
100%
100%
30.06.2015
31.12.2015
30.06.2016
USD
45%
46%
44%
EUR
21%
21%
23%
CHF
13%
12%
11%
GBP
5%
4%
4%
HKD
3%
3%
2%
INR
0%
2%
2%
SGD
2%
2%
2%
JPY
1%
1%
1%
BRL
1%
1%
1%
AUD
1%
1%
1%
CNY
1%
1%
1%
CAD
1%
1%
1%
Others
6%
5%
5%
100%
100%
100%
Equities Bonds (including Convertible Bonds) Investment Funds
1
Money Market Instruments Client Deposits Structured Products Other
2
Total Currency mix
Total 1 2
Includes, amongst other asset classes, further exposure to equities and bonds Including alternative investment assets 26
CAUTIONARY STATEMENT ON FORWARD-LOOKING INFORMATION General This presentation by Julius Baer Group Ltd. (“the Company”) does not constitute an invitation or offer to acquire, purchase or subscribe for securities nor is it designed to invite any such offer or invitation.
Cautionary Statement Regarding Forward-looking Statements This presentation by the Company includes forward-looking statements that reflect the Company's intentions, beliefs or current expectations and projections about the Company's future results of operations, financial condition, liquidity, performance, prospects, strategies, opportunities and the industries in which it operates. Forward-looking statements involve all matters that are not historical fact. the Company has tried to identify those forward-looking statements by using the words "may", "will", "would", "should", "expect", "intend", "estimate", "anticipate", "project", "believe", "seek", "plan", "predict", "continue" and similar expressions. Such statements are made on the basis of assumptions and expectations which, although the Company believes them to be reasonable at this time, may prove to be erroneous. These forward-looking statements are subject to risks, uncertainties and assumptions and other factors that could cause the Company's actual results of operations, financial condition, liquidity, performance, prospects or opportunities, as well as those of the markets it serves or intends to serve, to differ materially from those expressed in, or suggested by, these forward-looking statements. Important factors that could cause those differences include, but are not limited to: changing business or other market conditions; legislative, fiscal and regulatory developments; general economic conditions in Switzerland, the European union and elsewhere; and the Julius Baer Group’s ability to respond to trends in the financial services industry. Additional factors could cause actual results, performance or achievements to differ materially. In view of these uncertainties, readers are cautioned not to place undue reliance on these forward-looking statements. the Company and its subsidiaries, and their directors, officers, employees and advisors expressly disclaim any obligation or undertaking to release any update of or revisions to any forward-looking statements in this presentation and these materials and any change in the Company’s expectations or any change in events, conditions or circumstances on
which these forward-looking statements are based, except as required by applicable law or regulation.
Financial Information This presentation contains certain pro forma financial information. This information is presented for illustrative purposes only and, because of its nature, may not give a true picture of the financial position or results of operations of the Company. Furthermore, it is not indicative of the financial position or results of operations of the Company for any future date or period.
Rounding Numbers presented throughout this presentation may not add up precisely to the totals provided in the tables and text. Percentages and percent changes are calculated based on rounded figures displayed in the tables and text and may not precisely reflect the percentages and percent changes that would be derived based on figures that are not rounded.
Third Party and Rating Information This presentation may contain information obtained from third parties, including ratings from rating agencies such as Standard & Poor’s, Moody’s, Fitch and other similar rating agencies. Reproduction and distribution of third-party content in any form is prohibited except with the prior written permission of the related thirdparty. Third-party content providers do not guarantee the accuracy, completeness, timeliness or availability of any information, including ratings, and are not responsible for any errors or omissions (negligent or otherwise), regardless of the cause, or for the results obtained from the use of such content. Third-party content providers give no express or implied warranties, including, but not limited to, any warranties of merchantability or fitness for a particular purpose or use. Third-party content providers shall not be liable for any direct, indirect, incidental, exemplary, compensatory, punitive, special or consequential damages, costs, expenses, legal fees, or losses (including lost income or profits and opportunity costs) in connection with any use of their content, including ratings. Credit ratings are statements of opinions and are not statements of fact or recommendations to purchase, hold or sell securities. They do not address the market value of securities or the suitability of securities for investment purposes, and should not be relied on as investment advice. 27