R ES E A RC H
◥
HEALTH ECONOMICS
The impact of training informal health care providers in India: A randomized controlled trial Jishnu Das, Abhijit Chowdhury, Reshmaan Hussam, Abhijit V. Banerjee* INTRODUCTION: In rural India, health care
providers without formal medical training and self-declared “doctors” are sought for up to 75% of primary care visits. The frequent use of such informal providers, despite legal prohibitions on their practices, in part reflects the absence of trained medical professionals in rural locations. For example, in the majority of villages in the Indian states of Rajasthan, Madhya Pradesh, and West Bengal, informal providers are the only proximate source of health care. RATIONALE: The status of informal pro-
viders in the complex Indian health system is the subject of a highly charged debate among policy-makers and the medical establishment. The official view of the establishment is that fully trained providers are the only legitimate source of health care, and training informal providers legitimizes an illegal activity and worsens population health out-
comes. In contrast, given the lack of availability of trained providers and the fact that informal providers are tightly linked with the communities that they serve, others believe that training can serve as a stopgap measure to improve health care in tandem with better regulation and reform of the public health care system. However, despite the policy interest and important ramifications for the country, there is little evidence regarding the benefits (or lack thereof) of training informal providers. We report on the impact of a multitopic training program for informal providers in the Indian state of West Bengal that provided 72 sessions of training over 9 months. We used a randomized controlled trial design, together with visits by unannounced standardized patients (“mystery clients”), to measure the extent to which training could improve the clinical practice of informal providers over the range of conditions that they face. The conditions
presented by standardized patients were blinded from program implementers. Therefore, we view the evaluation of this multitopic training program as a measure of impact on primary care in general. Standardized patient data are accompanied by data from day-long clinical observations, providing a comprehensive picture of provider practice. Our study also benchmarks the impact of training against the performance of doctors in public primary health centers serving the same region. Lastly, it explores whether the training affected patient demand for informal providers. RESULTS: Mean attendance at each training session was 56% [95% confidence interval (CI): 51, 62%], with no contamination from the control group. Using standardized patient data, we find that ◥ ON OUR WEBSITE providers allocated to the training group were 4.1 Read the full article (1.7, 6.5) percentage points, at http://dx.doi. org/10.1126/ or 15.2%, more likely to adscience.aaf7384 here to condition-specific .................................................. checklists than those in the control group. The training increased rates of correct case management by 7.9 (0.4, 15.5) percentage points, or 14.2%, and patient caseload by 0.8 to 1.8 (0.13, 3.57) patients per day, or 7.6 to 17.0%. Data from clinical observations show similar patterns. Although correct case management among doctors in public clinics was 14.7 (–0.1, 30.4) percentage points, or 28.3%, higher than among untrained informal providers, the training program reduced this gap by half for providers with mean attendance and reduced the gap almost entirely for providers who completed the full course. However, the training had no effect on the use of unnecessary medicines and antibiotics, although both training- and control-group informal providers prescribed 18.8 (7.7, 28.9) percentage points, or 28.2%, fewer unnecessary antibiotics than publicsector providers. CONCLUSION: Training informal providers
increased correct case management rates but did not reduce the use of unnecessary medicines or antibiotics. At the same time, training did not lead informal providers to violate rules with greater frequency or worsen their clinical practice, both of which are concerns that have been raised by representatives of the Indian Medical Association. Our findings thus suggest that multitopic medical training may offer an effective short-run strategy to improved health care provision and complement critical investments in the quality of public care. Informal health care providers are the backbone of India’s primary health care system. In rural India, up to 75% of primary care visits are to informal providers. We evaluated a training program for these informal providers by using a randomized controlled design. In our sample of 200 villages in West Bengal, there are 30 informal providers for every public-sector doctor. Error bars show 95% CIs. 80
7 OCTOBER 2016 • VOL 354 ISSUE 6308
▪
The list of author affiliations is available in the full article online. *Corresponding author. Email:
[email protected] Cite this article as J. Das et al., Science 354, aaf7384 (2016). DOI: 10.1126/science.aaf7384
sciencemag.org SCIENCE
Downloaded from http://science.sciencemag.org/ on October 6, 2016
RESEARCH ARTICLE SUMMARY
RESEARCH ARTICLE
◥
HEALTH ECONOMICS
The impact of training informal health care providers in India: A randomized controlled trial Jishnu Das,1,2 Abhijit Chowdhury,3 Reshmaan Hussam,4 Abhijit V. Banerjee5* Health care providers without formal medical qualifications provide more than 70% of all primary care in rural India. Training these informal providers may be one way to improve the quality of care where few alternatives exist.We report on a randomized controlled trial assessing a program that provided 72 sessions of training over 9 months to 152 informal providers (out of 304). Using standardized patients (“mystery clients”), we assessed clinical practice for three different conditions to which both providers and trainers were blinded during the intervention, representative of the range of conditions that these providers normally diagnose and treat. Training increased correct case management by 7.9 percentage points (14.2%) but did not affect the use of unnecessary medicines and antibiotics. At a program cost of $175 per trainee, our results suggest that multitopic medical training offers an effective short-run strategy to improve health care.
I
n countries such as Nigeria, India, Bangladesh, and Thailand, health care providers without formal medical training account for between one-third and three-quarters of primary care visits (1). In rural India, these estimates range from 54% in West Bengal to 75% in states such as Rajasthan, Madhya Pradesh, Andra Pradesh, and Uttarakhand (2–5). The frequent use of informal providers reflects, in part, their widespread availability in rural areas and the absence of trained medical professionals. Despite legal prohibitions on their ability to practice, a census of providers in rural Madhya Pradesh counted 12 times as many informal providers as trained doctors with M.B.B.S. degrees (the equivalent of the M.D. degree in the United States) (3), and a census in rural West Bengal identified over 107,000 rural informal providers in the state (5). Proportionally scaled up to all of India, this would imply a population of 1.6 million rural informal providers compared with just under 1 million M.B.B.S. doctors (6), a large proportion of whom are concentrated in urban areas. It is therefore no surprise that in the majority of villages in Rajasthan, Madhya Pradesh, and West Bengal, informal providers are the only proximate source of health care. How to place these informal providers in the context of the health care system is now a highly charged debate among policy-makers and the 1
Development Research Group, The World Bank, 1818 H Street, NW, Washington, DC 20433, USA. 2Centre for Policy Research, New Delhi, India. 3Institute of Post Graduate Medical Education and Research, Seth Sukhlal Karnani Memorial Hospitals, 244 A.J.C. Bose Road, Kolkata, West Bengal, 700020 India. 4Economic Growth Center, Yale University, 27 Hillhouse Avenue, New Haven, CT 06511, USA. 5 Department of Economics, Massachusetts Institute of Technology, 40 Ames Street, Cambridge, MA 02139, USA. *Corresponding author. Email:
[email protected]
SCIENCE sciencemag.org
medical establishment in India. Since the Bhore Committee Report in 1946, India specifically eschewed the model followed in several other lowincome countries of allowing multiple cadres of medical professionals with varying degrees of training to diagnose and treat patients (7). In 25 of 47 countries in sub-Saharan Africa, for instance, officially recognized nonphysician clinicians play an active role in medical care, undertaking even specialty tasks such as Caesarean sections and anesthesia (8). The medical establishment in India has, however, relentlessly opposed any deviation from the standard degree requirement for practicing medicine. For example, attempts to introduce a 3-year diploma in the Indian state of Chhattisgarh for rural health care practitioners was attacked as a dilution of the standards of medical education and forced to stop (9). The Indian medical establishment is equally opposed to the view that training informal providers is a useful stopgap response to the acute shortage of trained providers, especially given that informal providers are already tightly linked with the communities that they serve. The view that such training can act as a complement to better regulation and a ramping up of the public health care system clashes with the position of the medical establishment, which argues that such training will legitimize an illegal activity and worsen population health outcomes. For instance, a large-scale training program in the state of Andhra Pradesh in 2009 had to be terminated in 2012 because of increasing resistance from the Indian Medical Association. The chairman of the Andhra Pradesh Medical Council argued that it was unlikely that informal providers would alter their behavior after a matter of months of training (10): “They are already violating rules. [After the training] they will violate them even
more.” Similarly, in 2016, the president of the Indian Medical Association’s Kolkata branch (Kolkata is the capital of West Bengal) equated training informal providers to “teaching burglars how to steal more effectively” (11). One reason for the current impasse in this debate is the dearth of evidence on either side. Although recent research provides new insights into the availability and practice of informal providers, at present there is no comprehensive evaluation of the impact of training informal providers on their clinical practice. We cannot develop effective policy without understanding the nature of the demand for informal providers, the kind of health care that they provide, and whether the quality of care that they provide can be improved. We report on a research project in the Indian state of West Bengal that attempts to bridge this evidence gap, building on a body of research in which some of us have been involved for over a decade. The study does three things: First, using a range of different approaches that we have developed in previous research, it provides detailed descriptive evidence on the clinical practice of informal providers and how that compares with the public M.B.B.S. doctors serving the same population. It then uses a randomized controlled trial (RCT) to measure the extent to which training can improve their clinical practice. Lastly, using the random variation brought about by the training, it asks whether potential patients react positively to improvements in quality by visiting trained informal providers more often. To assess the training program, we used a new blinded methodology that differs from previous evaluations. Although there is a small amount of RCT literature on the impact of training informal providers, it focuses on the evaluation of only those specific conditions for which the informal providers were explicitly trained [for instance, see Adu-Sarkodie et al. (12) on the impact of training pharmacists for urethral discharge, Garcia et al. (13) on sexually transmitted illnesses (STI) in Peru, Shah et al. (14) on STI and HIV-focused training in Pakistan, and Abuya et al. (15) on treatment for malaria]. However, showing that informal providers can successfully execute the specific tasks in which they have been trained is far from dispositive from the point of view of the present policy debate. Because informal providers deal with a variety of conditions of unknown origins—a fever can indicate either malaria, a flu, or a large number of other illnesses—the relevant training program must be able to demonstrate improvement across the spectrum of clinical tasks that informal providers routinely need to perform. These can range from (i) immediate treatment for certain acute conditions to (ii) triage into higher-quality care for more serious conditions to (iii) diagnosis and maintenance care for chronic patients. The training program and evaluation that we report here addresses this critical issue in two ways. First, the program offered a generalized curriculum, training providers on multiple topics such as basic physiology and anatomy, principles of harm reduction, and specific illnesses. Second, the program was evaluated using unannounced 7 OCTOBER 2016 • VOL 354 ISSUE 6308
aaf7384-1
Downloaded from http://science.sciencemag.org/ on October 6, 2016
R ES E A RC H
standardized patients, or trained actors playing the role of patients suffering from a particular condition. Our standardized patients, who were blinded to the group assignment of the providers that they visited, presented providers with a strategically chosen set of conditions that allowed us to assess provider ability across a broad range of the clinical tasks that they are expected to manage in their patient populations. Trainers and trainees in the program were both blinded to the conditions chosen for assessment, and the standardized patients were neither anticipated nor, ex post, recognized as actors. In addition to standardized patient data on clinical practice, we also implemented day-long clinical observations to verify clinical practice for a broader sample of patients, and we collected patient caseload and fees data to examine the effect of training on patient demand for informal providers’ services. The particular design of our evaluation therefore allows us to overcome the limitations of previous studies of this kind. This study provides the first reliable evidence on the impact of a multitopic training program on diagnostic and treatment quality for conditions unanticipated by both trainers and providers. Intervention The training program was designed and executed by the Liver Foundation, a public health organization based in West Bengal. The organization invited 360 providers across its district of operation to participate, out of whom 304 providers expressed interest and were randomized equally into training and control groups. Members of the training group were offered admission to the Liver Foundation Rural Health Care Practitioner Training Program, and those in the control group were told that they would be eligible for the program the next year. The control group was indeed offered the training program after the evaluation was complete. Sample selection is described in further detail in the Methods section. Our sample was comparable to those of other studies of informal providers in India: 95% were male, with a mean age of 40 [95% confidence interval (CI): 39.16, 41.22] years and 13.1 (12.21, 14.07) years of experience; 62% had completed high school; and 75% reported zero formal training (table S1). The remaining providers were in possession of certificates of limited legal validity but of perceived credibility and value in the rural medical market. The training consisted of 72 sessions and 150 teaching hours over a 9-month period. It included a wide variety of topics, with an emphasis on basic medical conditions, triage, and avoidance of harmful practices. The Methods section details the structure of the program, and the supplement materials provide the program curriculum. From the beginning, the Liver Foundation stressed that informal providers would not receive any certificates on completion of the training and should not think of themselves as qualified doctors. The program was free to all students, each of whom was provided a transportation allowance of $1.30 and a meal at each training aaf7384-2
7 OCTOBER 2016 • VOL 354 ISSUE 6308
session. Throughout the training, providers continued to operate their clinics more or less as usual. Measurement and data To evaluate the program, we strategically chose three tracer conditions, targeting the multiple skills that need improvement, and used unannounced standardized patients as the primary means of assessment. Standardized patients are increasingly used to assess condition-specific quality of care in low-income countries (16–21) and regarded as being close to a gold-standard measure of clinical practice. The three tracer conditions that we chose—chest pain, respiratory distress, and child diarrhea—allowed us to assess the ability of the informal provider to triage a patient with a condition that is likely severe (chest pain); treat or refer a patient with a condition that requires management (respiratory distress); and assess and treat a patient with a condition that can potentially be managed at the primary level (child diarrhea). For each condition, we chose to teach the standardized patients the most obvious answers to history questions that should have led the provider, with proper questioning and examination, to conclude that the patient was suffering from angina (chest pain), asthma (respiratory distress), or dysentery (child diarrhea). Further details on standardized patient tracer conditions are included in the Methods section. Throughout the intervention, the implementers and trainers in the program did not know the conditions for which the informal providers would ultimately be evaluated, limiting the possibility of teaching to the test. During the evaluation, the standardized patients were blind to the training status of their providers, limiting reporting bias from the patients. Given the standardization of patients across providers, this methodology also allowed us to address the possibility of confounders in terms of patient characteristics and illnesses. Lastly, the fact that the patients were unannounced trained actors also limited the possibility of Hawthorne effects, whereby providers would alter their behavior because they knew that they were being observed. Further information on the standardized patient recruitment and training process is detailed in the Methods section. One limitation of the standardized patient approach is the small number of conditions (though wide in range) for which the providers can be evaluated. To extend our results to the typical patient who visits these informal providers, we therefore also assessed clinical practice by using trained observers who remained with the provider for 1 full day. Lastly, we collected data on the prices and fees charged by the informal providers in the training and control groups. (Some informal providers charge fees, whereas others sell medicine to their patients at a premium in lieu of a fee. We report the sum of these two.) We also collected data on their caseload, or the number of patients that they see in a day. These data were collected through day-long clinical observations as well as weekly provider diaries, as detailed in the Methods section. We did this because one important aspect
of the success of a training program is the effect of training on the demand for the services of the trainees. If improvements in clinical practice adversely affect the market share or earnings of informal providers, informal providers will either stop implementing what they have learned, or the decline in their caseload will affect their relevance and long-term sustainability. This is a legitimate concern, given that it has been documented that patients often make their health care choices on the basis of subjective theories that can be at odds with what science tells us (22, 23). Conversely, if the quality of their treatment, earnings, and market share increased as a result of training, we would be reassured about the sustainability of the program and the welfare of the patients. Baseline data were collected before the randomization and included information on provider backgrounds and practice characteristics. To allow for potential short-term decay in training skills, endline data collection commenced 3 to 6 months after the completion of training and 9 to 10 months after the completion of the illnessspecific portion of the training. Standardized patients were sent to the entire study population, as well as to the total of 11 public primary health centers (PHCs) in the 203 villages. The quality of health care delivered in the PHCs was used to benchmark the performance of trained informal providers. After standardized patient data collection was complete, a day-long clinical observation was conducted with each provider, and the baseline measures were collected once again. Because the use of standardized patients and clinical observations could have primed providers to expect such cases in the future, both were restricted to the endline survey data collection only. Our primary outcomes, pre-specified in our pre-analysis plan, are condition-specific metrics obtained from the standardized patient interactions. We assessed potential improvements in necessary care through condition-specific checklists of recommended care (supplementary materials) (24–26) and rates of correct case management. We present our results using three definitions of correct case management. The first is an inclusive binary definition, where the case is correctly managed as long as necessary care was provided, with or without additional components. In the second stricter binary definition, the case is correctly managed if only the necessary care was provided, without any unnecessary components. The third is a grade on a continuous scale, as evaluated by independent M.B.B.S. doctors blinded to providers’ training status, which has the advantage that both necessary and unnecessary components are evaluated jointly, allowing for a more nuanced gradation of case management. All three are described in detail in the Methods section. We also assessed potential reductions in unnecessary or harmful care through the use of antibiotics, injections, and polypharmacy, the latter defined as the total number of medicines dispensed or prescribed. Antibiotic use was assessed for all three conditions, as well as for sciencemag.org SCIENCE
Downloaded from http://science.sciencemag.org/ on October 6, 2016
R ES E A RC H | R E S EA R C H A R T I C LE
RE S E ARCH | R E S E A R C H A R T I C L E
Table 1. Impact of training on main standardized patient outcomes. History and exam checklist completion refers to the percent of items that were completed from the structured questionnaire. Correct case management is defined as an inhaler, corticosteroid, or referral for asthma; asking to see the child or recommending ORS for child diarrhea; and aspirin or referral for angina. Unnecessary or harmful medicines are any other medication treatment; a single case can be categorized as either or both correct and unnecessary or harmful treatment. “Correct management only” means correct case management without any unnecessary or harmful treatments. All regressions control for case presentation
Training group
Control group Mean
n
fixed effects and the age of the attending provider, with standard errors clustered at the level of the village. Ninety-five percent CIs are presented in parentheses below the means and estimated coefficients. Estimates that are significant at the 90% level of confidence are marked with an asterisk, at the 95% level of confidence with two asterisks, and at the 99% level of confidence with three asterisks. OR, odds ratios. Marginal effects (ME) are computed at the mean of dependent variables for the logistic specification and are the coefficients on training (ITT) or attendance (IV) in the linear specifications. The F statistic for the first stage in IV regressions is >300. Wilson intervals without continuity correction are used for dichotomous variables.
n
Mean
ITT
ITT
logistic
logistic
OR
ME
Linear ME
IV Linear ME
Continuous outcome variables for desirable and nondesirable outcomes
History and exam checklist completion
0.273 (0.259,
396
(percent) Consultation
388
0.287) 3.252
0.314 (0.300,
0.041*** (0.017,
0.069*** (0.031,
0.328) 3.511
0.065) 0.247
0.107) 0.416
(3.326, 3.695)
(–0.046, 0.54)
(–0.064, 0.896)
2.222 (2.083,
0.065 (–0.162,
0.109 (–0.269,
............................................................................................................................................................................................................................................................................................................................................
length (minutes)
396
(3.079, 3.425)
388
............................................................................................................................................................................................................................................................................................................................................
Number of medicines
2.162 (2.033,
396
388
0.487) 0.291) 2.291) 2.36) Dichotomous outcome variables for desirable outcomes ............................................................................................................................................................................................................................................................................................................................................ 0.133** 0.079** 0.083** 1.402** 0.520 0.598 Correct case (0.009, (0.004, (0.004, (1.017, 396 (0.471, 388 (0.549, management 0.258) 0.155) 0.162) 1.931) 0.569) 0.647) ............................................................................................................................................................................................................................................................................................................................................ 0.020 0.012 0.012 1.124 Correct 0.109 0.124 ............................................................................................................................................................................................................................................................................................................................................
management
396
(0.078,
only Average-quality
388
0.139) 0.114
(0.091,
(0.703,
(–0.035,
(–0.036,
(–0.059,
0.157) 0.174
1.798) 1.679***
0.058) 0.060***
0.060) 0.062***
0.100) 0.104***
............................................................................................................................................................................................................................................................................................................................................
(0.03, case management 394 (0.083, 384 (0.136, (1.145, (0.017, (0.016, 0.178) or better 0.146) 0.213) 2.462) 0.104) 0.107) ............................................................................................................................................................................................................................................................................................................................................ 0.093 0.055 0.057 1.306 0.285 0.341 Referred case (–0.042, (–0.026, (–0.026, (0.881, 263 (0.234, 258 (0.283, (asthma or angina) 0.228) 0.137) 0.14) 1.937) 0.343) 0.399) ............................................................................................................................................................................................................................................................................................................................................
Dichotomous outcome variables for nondesirable outcomes
............................................................................................................................................................................................................................................................................................................................................
Lowest-quality case management
394
0.142 (0.108, 0.177) 0.477
384
0.102 (0.071,
0.664 (0.411,
–0.042 (–0.091,
–0.043 (–0.094,
–0.072 (–0.156,
0.132) 0.485
1.073) 1.059
0.007) 0.014
0.008) 0.011
0.012) 0.018
............................................................................................................................................................................................................................................................................................................................................
(–0.092, (–0.055, (–0.071, (0.752, (0.428, 388 (0.435, 0.129) 0.077) 0.099) 1.49) 0.527) 0.534) ............................................................................................................................................................................................................................................................................................................................................ 0.016 0.009 0.010 1.047 0.331 0.337 Antibiotics (–0.112, (–0.067, (–0.071, (0.718, 263 (0.274, 258 (0.279, (asthma or angina) 0.143) 0.086) 0.091) 1.526) 0.388) 0.395) ............................................................................................................................................................................................................................................................................................................................................ 0.012 0.007 0.004 1.612 0.011 0.019 Offered injection (–0.028, (–0.017, (–0.012, (0.337, 263 (0, 258 (0.003, (asthma or angina) 0.051) 0.031) 0.021) 7.717) 0.024) 0.036) ............................................................................................................................................................................................................................................................................................................................................ –0.007 –0.004 –0.004 0.978 0.707 0.701 Any unnecessary (–0.116, (–0.07, (–0.077, (0.673, 396 (0.662, 388 (0.655, or harmful medicine 0.102) 0.062) 0.068) 1.421) 0.752) 0.747) Antibiotics (all)
396
............................................................................................................................................................................................................................................................................................................................................
asthma and angina alone, because in these two instances, antibiotics are almost never required. These condition-specific quality metrics were complemented with secondary outcomes that were not condition-specific but that have been SCIENCE sciencemag.org
shown to relate to higher-quality care (16). The general measures of care assessed, obtained from both the standardized patient interactions and clinical observations, included consultation length, history-taking, and examinations performed.
We present age-adjusted intention-to-treat (ITT) estimates, as well as age-adjusted instrumental variable (IV) estimates to deal with partial compliance. Standard errors have been adjusted for clustering at the village (standardized 7 OCTOBER 2016 • VOL 354 ISSUE 6308
aaf7384-3
Downloaded from http://science.sciencemag.org/ on October 6, 2016
............................................................................................................................................................................................................................................................................................................................................
R ES E A RC H | R E S EA R C H A R T I C LE
Table 2. Clinical practice of control-group, training-group, and public providers, assessed using standardized patients. Shown (from left to right) are means for each group, estimated differences between informal providers in the control group and doctors in PHCs, and estimated differences between informal providers in the training group and doctors in PHCs. Definitions, asterisks, and the presentation of statistics are as in Table 1. All regressions include dummies for each condition, with standard errors clustered at the level of the village. Odds ratios could not be computed for lowest-quality case management because no interactions with PHCs fell into that category.
Means
Control group – PHC
PHC
Control
Training
(n = 33)
(n = 396)
(n = 394)
Training group – PHC
Linear regression
Logistic regression
Linear regression
Logistic regression
ME
OR
ME
OR
Continuous outcome variables for desirable and nondesirable outcomes ............................................................................................................................................................................................................................................................................................................................................ 0.111*** 0.071** 0.313 0.273 0.202 History and exam checklist completion (percent)
(0.16, 0.244)
(0.259, 0.287)
(0.299, 0.327)
(0.017, 0.125)
(0.055, 0.166)
1.735 (1.403,
3.252 (3.079,
3.495 (3.312,
1.519*** (1.077,
1.762*** (1.3,
2.067) 2.758
3.425) 2.162
3.677) 2.208
1.961) –0.595**
2.223) –0.548
(2.296, 3.219)
(2.033, 2.291)
(2.07, 2.346)
(–1.158, –0.031)
(–1.123, 0.026)
Consultation length (minutes)
............................................................................................................................................................................................................................................................................................................................................
Number of medicines
............................................................................................................................................................................................................................................................................................................................................
Dichotomous outcome variables for desirable outcomes 0.519 –0.147 0.594 0.520
............................................................................................................................................................................................................................................................................................................................................
Correct case management
0.667
–0.073
0.724
(0.353, (–0.23, (0.249, (–0.304, (0.545, (0.471, (0.505, 1.482) 0.085) 1.082) 0.01) 0.643) 0.57) 0.828) ............................................................................................................................................................................................................................................................................................................................................ Correct management
only Average-quality
0.109 (0.078,
0.127 (0.094,
0.018 (–0.077,
1.219 (0.398,
0.036 (–0.059,
1.456 (0.484,
0.182
0.139) 0.114
0.16) 0.174
0.112) –0.068
3.737) 0.580
0.131) –0.007
4.38) 0.954
(0.05, 0.314)
(0.083, 0.146)
(0.137, 0.212)
(–0.177, 0.042)
(0.267, 1.26)
(–0.118, 0.104)
(0.443, 2.054)
0.182 (0.02,
0.285 (0.23,
0.344 (0.286,
0.104 (–0.05,
1.843 (0.665,
0.162** (0.003,
2.435* (0.87,
0.343)
0.34)
0.401)
0.258)
5.106)
0.32)
6.816)
0.091 (0, 0.189)
.......................................................................................................................................................................................................................................................................................................................................
case management or better
............................................................................................................................................................................................................................................................................................................................................
Referred case (asthma or angina)
............................................................................................................................................................................................................................................................................................................................................
Dichotomous outcome variables for nondesirable outcomes ............................................................................................................................................................................................................................................................................................................................................ 0.142*** 0.102*** 0.103 0.142 Lowest-quality 0 (0.103, – (0.071, – (0.072, (0.108, case management (0, –) 0.181) 0.134) 0.133) 0.177) ............................................................................................................................................................................................................................................................................................................................................ 0.667 (0.505,
0.477 (0.428,
0.480 (0.43,
–0.191** (–0.348,
0.371** (0.156,
–0.188** (–0.346,
0.372** (0.156,
0.828) 0.636
0.527) 0.331
0.529) 0.332
–0.034) –0.306***
0.885) 0.244***
–0.029) –0.304***
0.885) 0.242***
(0.435, 0.838)
(0.274, 0.388)
(0.275, 0.389)
(–0.502, –0.11)
(0.095, 0.63)
(–0.503, –0.106)
(0.094, 0.621)
Offered injection (asthma or
0.045 (0,
0.011 (0,
0.019 (0.002,
–0.034 (–0.123,
0.233 (0.02,
–0.026 (–0.116,
0.403 (0.04,
angina) Any unnecessary
0.133) 0.879
0.024) 0.707
0.036) 0.695
0.054) –0.171***
2.674) 0.268**
0.063) –0.183***
4.06) 0.276**
(0.767, 0.99)
(0.662, 0.752)
(0.65, 0.741)
(–0.278, –0.063)
(0.095, 0.757)
(–0.289, –0.077)
(0.103, 0.738)
Antibiotics (all)
............................................................................................................................................................................................................................................................................................................................................
Antibiotics (asthma or angina)
............................................................................................................................................................................................................................................................................................................................................
............................................................................................................................................................................................................................................................................................................................................
or harmful medicine
............................................................................................................................................................................................................................................................................................................................................
patient data) or provider (clinical observation data) level. We show a CONSORT (Consolidated Standards of Reporting Trials) diagram of participant flow in fig. S1. Of the study population of 304 providers, standardized patients visited 267 (87.8%). There were no statistically significant differences in provider characteristics by training status between providers who were assessed at endline and those who were not (table S2). All aaf7384-4
7 OCTOBER 2016 • VOL 354 ISSUE 6308
baseline covariates were well balanced, except for provider age, which was slightly higher in the training group (table S1). We therefore controlled for age in our analysis. Results Attendance at training sessions Mean attendance, or the average attendance of training-group providers at each session, was 56% (95% CI: 51, 62%). No control providers
attended any session. Attendance in each session varied between 19 and 82% and was negatively correlated with distance to the training site and rainfall on the day of the training (fig. S2 and table S3). Outcomes using standardized patients Table 1 presents case management outcomes from standardized patient observations. Among providers in the control group, the mean standardized sciencemag.org SCIENCE
Downloaded from http://science.sciencemag.org/ on October 6, 2016
............................................................................................................................................................................................................................................................................................................................................
RE S E ARCH | R E S E A R C H A R T I C L E
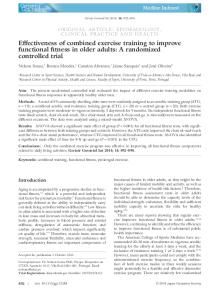
Respiratory Distress Prescribed or Offered Corticosteroid Referred to Hospital or Specialist Prescribed or Offered Inhaler Correct Case Management Average Quality Treatment or Better
0.01
0.1 ← Favors Control
1.0
Odds Ratio 1.22 1.28 10.23** 1.15 0.93
[95% Confidence] 2.05 ] [ 0.73 , 2.31 ] [ 0.71 , 85.36 ] [ 1.23 , 1.96 ] [ 0.68 , 2.1 ] [ 0.41 ,
P−value 0.4547 0.4085 0.0317 0.6046 0.8618
Odds Ratio 1.33 1.64* 1.33 1.45
[95% Confidence] [ 0.81 , 2.19 ] [ 0.96 , 2.81 ] [ 0.82 , 2.16 ] [ 0.69 , 3.07 ]
P−value 0.2588 0.0682 0.2538 0.3299
Odds Ratio 1.57 7.57*** 1.32 1.76** 2.61***
[95% Confidence] [ 0.85 , 2.91 ] [ 1.67 , 34.37 ] [ 0.81 , 2.15 ] [ 1.1 , 2.83 ] [ 1.46 , 4.65 ]
P−value 0.153 0.0088 0.2606 0.0194 0.0012
10 100 Favors Training →
Child Diarrhea Asked to See Child Oral Rehydration Salts Correct Case Management Average Quality Treatment or Better
0.1 ← Favors Control
1.0
10 100 Favors Training →
Chest Pain ECG Prescribed or Offered Aspirin Referred to Hospital or Specialist Correct Treatment Average Quality Treatment or Better
0.01
0.1 ← Favors Control
1.0
10 100 Favors Training →
Fig. 1. Impact of training on condition-specific components of correct case management. The odds ratios of the ITT estimator are computed from a logistic regression model relating each outcome variable to group status (training versus control), with condition-specific dummies and age of the provider as additional controls. Every component of correct case management improved in the training group, although the small sample size limits the precision of the estimates. Estimates that are significant at the 90% level of confidence are marked with a single asterisk, at the 95% level of confidence with two asterisks, and at the 99% level of confidence with three asterisks.
patient interaction lasted 3.3 (95% CI: 3.08, 3.43) min, and mean adherence to the checklist of recommended questions and examinations was 27.3% (25.9, 28.7%). Correct case management was offered in 52% (47.1, 56.9%) of interactions, with independent raters grading (only) 11.4% (8.3, 14.6%) of all treatments in the control group as “average quality or higher.” Polypharmacy and antibiotic use, the latter unnecessary in all cases, was high, with an average of 2.2 (2.03, 2.29) medicines dispensed per interaction. Unnecessary or harmful medicines were prescribed or dispensed in 70.7% (66.2, 75.2%) of standardized patient interactions, and antibiotics were prescribed or dispensed to 33.1% (27.4, 38.8%) of asthma and angina standardized patients, none of who should have been recommended such treatments. Control informal providers saw a mean of 8.4 (7.21, 9.53; clinical observations) to 10.6 (9.43, 11.72; provider diaries) patients per day and charged between 46.6 (40.07, 53.18; observations) and 73.1 (64.14, 81.98; diaries) rupees per visit. Caseloads are lower in the clinical observations data because they were conducted in a low-morbidity season, with less severe illnesses, relative to the provider diaries (table S5). Correct case management was significantly higher among providers in the trained group [7.9 (0.4, 15.5) percentage points], as was the likelihood of providing “average-quality or higher” treatment [6.2 (1.6, 10.7) percentage points] (Table 1). Higher correct case management rates were also accomSCIENCE sciencemag.org
panied by greater adherence to condition-specific checklists (Table 1) among trained providers [4.1 (1.7, 6.5) percentage points]. Because the average provider attendance per session over the duration of the training course was 56%, we also used group assignment to estimate what would have happened if all the informal providers in the training group had attended every class. Only training-group providers were permitted to attend the training, so our setting is one of one-sided noncompliance— i.e., there are no noncompliers in the control group. Therefore, the local average effect of training in an IV analysis is equivalent to the “treatment on the treated,” or in other words, the effect for an informal provider who attended every class (27). Identifying the impact of training on providers had they had 100% attendance is especially relevant because attendance rates were highly correlated with distance to the training center and might therefore be substantially improved by bringing the center closer to the program participants. The IV results suggest that, with perfect attendance, correct case management rates would have been 13.3 (0.9, 25.8) percentage points higher in the training group than in the control group (Table 1). This is equivalent to a 25.6% increase in correct case management relative to the control group. However, neither the ITT nor the IV specifications show statistically significant differences in the use of antibiotics, injections, or polypharmacy
or the likelihood of very low-quality case management, as assessed by the independent raters (Table 1). With regard to specific process indicators across the three conditions presented by the standardized patients, providers assigned to the training group were more likely to prescribe inhalers and refer patients for symptoms of respiratory distress; recommend oral rehydration salts (ORS) for the child with diarrhea; and administer aspirin and refer patients for chest pain (Fig. 1). Encouragingly, out of 110 referrals for chest pain, 70 were to cardiologists or chest specialists, in line with recognition of a potentially serious heart condition. However, because the study was not powered to detect condition-specific differences, these results are imprecisely estimated and therefore generally not statistically significant, except in the use of inhalers for respiratory distress and correct case management for chest pain. Outcomes calculated using clinical observations Data from 2311 observations of clinical practice with real patients collected 3 months or more after the conclusion of training show similar improvements, with trained informal providers asking 0.65 (0.06, 1.24) or 13.0% more recommended history questions and conducting 0.42 (0.15, 0.68) or 18.3% more recommended examinations than their control counterparts. As in the case 7 OCTOBER 2016 • VOL 354 ISSUE 6308
aaf7384-5
Downloaded from http://science.sciencemag.org/ on October 6, 2016
0.01
R ES E A RC H | R E S EA R C H A R T I C LE
Benchmarking with public-sector performance among standardized patients Table 2 presents results relative to the benchmark of the performance of the public-sector providers, all of whom have M.B.B.S. qualifications. Relative to public-sector providers in the same villages, untrained and trained informal providers were respectively 7.1 (1.7, 12.5) and 11.1 (5.5, 16.6) percentage points more likely to adhere to condition-specific checklists than public providers, who completed an average of 20.2% of checklist items (Table 2). Both trained and untrained informal providers also spent more time with their patients: Trained informal providers spent more than twice the amount of time as public providers, who averaged 1.74 min per patient. Polypharmacy, offers of injections, and antibiotic prescriptions were also substantially lower among informal providers, trained and untrained, relative to the public providers. For example, trained providers were 18.8 (7.7, 28.9) percentage points, or 28.2%, less likely than public providers to prescribe antibiotics to standardized patients. However, public-sector doctors were 14.7 (–1.0, 30.4) percentage points more likely to correctly manage a case compared with untrained informal providers, with this difference halved for informal providers in the training group (neither difference is statistically significant because of the small total of 11 public-sector doctors). The likelihood of “correct case management only” as well as “averageor higher-quality case management” was equally high among public providers and informal providers in the training group, although the likelihood of “very low-quality case management” was lower for public doctors. Heterogeneity in training impact It is possible that these average effects mask heterogeneity linked to various provider characteristics. We explore the heterogeneity of training effects in five dimensions. Two of these proxy for prior learning (whether the provider had any formal training, which could include some months of distance education or training received through the government for community health work, and the provider’s prior experience), one relates to the provider’s connection to the community (whether the provider owned rather than rented his or her clinic), one proxies for local competition (whether there were other providers in the same village), and one measures provider caseload (table S6). Across all five dimensions, we find no evidence of heterogeneous effects in the training group. We do, however, find evidence suggestive of differential training effects related to case management rates predicted on the basis of providers’ baseline characteristics. Providers who were predicted to perform poorly absent the training show larger training effects (table S7). For example, those providers in the middle tercile of correct aaf7384-6
7 OCTOBER 2016 • VOL 354 ISSUE 6308
case management had a response to the training that was four times as large [12.4 (–2.3, 27.1) percentage points] as those in the highest tercile [3.0 (–11.5, 17.5) percentage points], which is significant at the 10% level. This suggests that providers with lower quality of care improved the most through the program. Furthermore, we find a strong dose response related to attendance among providers in the training group (fig. S3). Rates of correct case management remain roughly constant at the same level as the average of the control group until attendance reaches 40% and then rise continuously, peaking at nearly the level of PHCs by 90% attendance. Although attendance was not randomly allocated and more motivated providers likely had higher attendance, the dose response is consistent with training as the key channel for the impacts we observed. Impact of training on demand and revenue The number of patients counted on the day of clinical observation and in provider diaries suggests an increase in patient caseload. The IV estimate, which is the estimate relevant for assessing the provider’s potential revenue gain from attending the training, is 1.30 (–1.33, 3.94) more patients per day based on our observations and 3.05 (0.24, 5.86) more patients per day based on the diaries (table S5). This implies an increase in patient demand of 15.5 to 28.9%. We do not find evidence of a change in the prices that providers charged, with positive but statistically insignificant estimates from standardized patients and negative but statistically insignificant estimates from clinical observations. The increased patient caseload is consistent with multiple channels of impact: Patients could be reacting to the improved treatment by returning to the same provider or recommending the provider to others; patients may have also heard that the provider received training and updated their expectations of the providers’ ability. Although providers did not explicitly advertise their training (for example, by displaying a certificate—they received none), some providers reported informing their patients that their office was closed 2 days per week for the purpose of attending a training course in the district capital. Program costs On the cost side of the program, total costs included training center rent, staff salaries, materials, travel stipends, and meals for the providers. Assuming at least 50% attendance (comparable to the 56% actually attained), the per-student cost of the program was 10,528 rupees ($175 at 60 rupees to $1). A conservative estimate of a 10% increase in caseload (which is below our lowest estimate) with no change in prices charged (which is what we observed) suggests that the provider would earn 50.2 rupees ($0.84) extra per day, and 210 working days would be required to recoup the training costs, assuming no opportunity cost of training time and travel or the ability to shift additional patients to other times of the day. At
the higher end of the caseload increase estimates, the cost of training would be fully recouped within 66 days. Although we did not experiment with providers’ willingness to pay for the program, a priori, there appears to be a sufficient revenue gain for the program to be self-financing. Limitations Our study faces limitations inherent to the use of standardized patients to evaluate clinical practice. In addition, there is a question of generalizability, because the impact of training is estimated for those who expressed interest in the program, rather than all those who were approached. Lastly, in the absence of a household survey, we can only assess the change in caseload as an impact of the training; we cannot determine the quality of the provider that the marginal patient would have seen in the absence of training. We discuss each of these limitations in turn. Extrapolation from standardized patients The use of standardized patients restricts our primary outcomes to conditions for which (i) the lack of physical symptoms does not undermine the claim of an underlying condition, (ii) invasive examinations are not required, and (iii) a child need not be present at the clinic. Therefore, though our findings are considerably broader than those in the existing literature, we cannot extend them to all cases that informal providers may be required to manage. The results from standardized patients also pertain to the specific characteristics of those individuals, which in our case could include a sense by the provider that the patient was more educated than the average villager and resided outside the village. Although this should not affect internal validity because both training- and control-group providers faced the same standardized patients, we cannot automatically extrapolate the findings to the entire patient population that informal providers treat in their clinics. However, it is worth pointing out that previous studies have found little influence of standardized patient characteristics on provider behavior (19). Moreover, the parallel evidence from our clinical observations, showing that more history-taking and physical examinations were performed for real patients by the trained providers, suggests that the findings from the standardized patients may hold for a wider set of illnesses and patients. It must be acknowledged, however, that to conclusively prove this, we would need to use a larger and more diverse population of standardized patients or obtain measures of populationlevel health outcomes. Lastly, the impact of training beyond the 9-month period is uncertain and depends on whether the effect of training decays over time (alternatively, it could be reinforced by the improved results) and, if so, the rate at which such decay (or reinforcement) occurs. Extrapolations to training effects in the population We are also limited in our ability to extrapolate training effects to the population of informal sciencemag.org SCIENCE
Downloaded from http://science.sciencemag.org/ on October 6, 2016
of standardized patients, there is no evidence of a difference in the use of polypharmacy, injections, or antibiotics (table S4).
providers, because this would have required a separate study design in which randomization occurred at the population level rather than among those informal providers who expressed an interest in the program. We can nevertheless make use of the fact that, out of the 360 informal providers who were approached, 304 consented to be part of the study. Assuming that the training effect would have been zero among the remaining 56, the estimated impact of training on correct case management in the population would have been 6.5 (95% CI: 3.9, 8.9) rather than 7.9 percentage points (fig. S4). However, this may be too pessimistic. As we discussed previously, the distance to the training center was the single most important determinant of attendance (table S3 and fig. S2). It is not unreasonable to assume that, were the policy to be implemented on a larger scale, there would be more than one training center and they would be in different locations. If we make the (brave) assumption that the relation between distance and attendance that we estimate is causal, it implies that we could achieve around 80% attendance if a training center were within 5 km of each informal provider. If we additionally assume that the relation that we estimate between attendance and the training effect (fig. S5) is causal, we could conclude that those who attend 80% of the time have a training effect that is close to the IV estimate of 13.3 percentage points. Therefore, the IV estimate may well be the policy-relevant estimate. Alternately, if these providers were somehow different from those observed in the sample and continued to not attend the training despite greater proximity to the training center, their training effect would be zero. In this case, applying the IV estimate only to the 304 providers who chose to participate in the program and appropriately reweighting would suggest an IV estimate of 10.6 percentage points for the effect on correct case management. Health care quality for patients who switched providers The gap in correct case management rates between public and informal providers presents an additional concern to those explored above: Given that patient demand increased for trained informal providers, overall quality of care may have declined if patients switched away from the public sector toward trained informal providers. This is a concern in the 11 villages with a public PHC, because patients rarely seek primary care outside the surroundings of their own village (16). In fact, our data show that in the villages where both options exist, the training had no effect on the informal providers’ caseloads; the caseloads of trained informal providers increased only in villages without a public-sector clinic. In addition, when we asked patients where they would seek care for a variety of conditions, including the conditions evaluated using standardized patients, 90% said they would use a local provider, with no difference between patients treated by providers in the training and control groups (table S8). This suggests that our increased SCIENCE sciencemag.org
caseload results for the trained providers must have come from an increased retention of existing patients or patients switching from other informal providers rather than from public M.B.B.S. doctors. Discussion Even with a relatively inclusive definition of correct case management that ignores the prescription of unnecessary medications, only 52% of control informal providers can be said to manage the cases of the standardized patients correctly, compared with 66% correct management for the 11 M.B.B.S. doctors. Both rates are very low, especially given that the cases were designed with no complications and the most obvious diagnosis, but broadly consistent with other studies from India and China that used standardized patients. In particular, using the same tracer conditions, Das et al. (16) reported correct case management rates of 42% among a representative sample and 50.7% among trained M.B.B.S. providers in rural Madhya Pradesh; Sylvia et al. (17) reported correct case management rates of 52 to 53% among village clinicians in rural China for chest pain and child diarrhea; and Mohanan et al. (18) reported that only 3.5% of providers recommended ORS for child diarrhea in Bihar. Low rates have also been reported for other tracer conditions; for tuberculosis, correct case management rates were 21% for a sample of providers from Delhi, India (19). Against this worrying backdrop, our results offer some grounds for optimism. Despite an average of 13 years of experience, the clinical practice of informal providers appears to be highly malleable across multiple topics. Although proportions of correct case management are higher in PHCs than in informal provider clinics, this difference was cut in half through training, and our IV estimates suggest that it would have been nearly eliminated if attendance rates had been close to perfect. Our estimates provide the first evidence that can inform an ongoing debate in India about the utility of multitopic training programs for informal providers. At the same time, any such debate also has to take into account important considerations regarding (i) the allocative efficiency of funding training programs for informal providers, rather than improving the public sector; (ii) the impact of training on health outcomes; and (iii) the absence of an effect of training on the use of unnecessary medicines or antibiotics. Our discussion brings in additional information and some speculation on each of these issues. Training or investment in the public sector? It is difficult at first to countenance the fact that, based on our IV estimates, 72 sessions of training can lead to equivalent or even better care than in the public sector (“better” because although the correct case management rates were similar among public-sector doctors and those informal providers who had high attendance rates, the use of unnecessary antibiotics and medicines was lower
among all informal providers). This should not be interpreted to mean that the knowledge gained through this short training program is equivalent to the knowledge obtained from a professional medical degree granted by a reputed medical college. The equivalence that we document here points to two different explanations. First, as has been previously documented, medical knowledge among doctors with a M.B.B.S. degree can vary dramatically, arguably because of differences in the quality of training among medical colleges (28). Second, low quality in the public sector is a reflection of poor governance that leads to very high levels of absence (2) and low effort (29). The mean consultation length in the public clinic was only 1.74 (95% CI: 1.40, 2.07) min, a result that has also been documented in samples from Delhi (the national capital) and the state of Madhya Pradesh (16, 30). This is consistent with the fact that the quality of care from the same public-sector doctors is markedly higher when they practice in their private clinics rather than in their public role (16). Despite this lack of effort, the superior knowledge of the publicsector doctors allowed them to provide higherquality care than our control-group informal providers; however, the training was sufficient to improve the clinical practice of the most regular attendees to the point where the performance of these informal providers matched that of bettertrained, but presumably poorly motivated, publicsector doctors. Given the greater knowledge of M.B.B.S. providers in the public sector, one could ask whether alternate (nontraining) investments that improved their effort and/or increased the use of the public system would yield higher dividends relative to training private-sector informal providers. In theory, this is an attractive option. In practice, it has turned out to be very hard to do. In terms of trying to directly influence provider effort, Banerjee et al. (30), in the state of Rajasthan and Dhaliwal and Hanna (31) in Karnataka worked closely with state governments to try to improve the simplest measure of governance—nurse and doctor attendance—but as their studies show, this has proven to be inordinately difficult owing to the combination of resistance from staff and the reluctance of the administration to enforce the programs. In terms of trying to manipulate the demand for care from the formal health care system, studies by Powell-Jackson, Mazumdar, and Mills (32) and Mohanan et al. (33) of large government programs that provided conditional cash transfers to households to encourage institutional births suggest that there was no impact on health outcomes. We pair this literature with the reality that public health care infrastructure is exceedingly scarce in rural Indian villages relative to the ubiquity of informal providers (in our study’s setting, the 203 villages had only 11 PHCs but at least 360 informal providers). This suggests that the magnitude of resources required to expand the care of public doctors to the full patient population would be considerable. A back-of-theenvelope calculation estimates that, at the average 7 OCTOBER 2016 • VOL 354 ISSUE 6308
aaf7384-7
Downloaded from http://science.sciencemag.org/ on October 6, 2016
RE S E ARCH | R E S E A R C H A R T I C L E
R ES E A RC H | R E S EA R C H A R T I C LE
Potential impact of training on health outcomes Improved health care provision is only relevant if it generates improved patient health outcomes. This study was designed to assess the impact of training on the former rather than the latter, but now we explore two channels through which patient health may have been substantively affected. At the very least, training improved correct case management rates for the tracer conditions that we evaluated using standardized patients; in this case, the impact on health outcomes will depend on the prevalence of these conditions in the population and the health benefits accruing from the increase in correct case management. More optimistically, given that the conditions were blinded from the implementers and therefore did not receive special emphasis in the training, it is also plausible that the training generated improvements in correct case management for the broader range of conditions that informal providers see in their clinics, yielding a greater breadth of impact on the health of the patient population. We focus first on the tracer conditions only. Diarrheal disease kills more than 200,000 children per year in India, and it is especially prevalent in low-lying areas with heavy rainfall, such as our study area (36, 37). India has also seen a sharp increase in the prevalence of noncommunicable diseases (38). Although asthma prevalence is lower than the self-reported European Union (17-state) rate of 3.8% (39), the nationwide prevalence rate of 2.05% among adults in 2012 is consistent with a substantial burden in the population (40). With regard to angina, South Asians are particularly prone to the condition relative to Caucasians; for instance, the Whitehall-II study in the United Kingdom suggests a cumulative frequency of typical angina of 17.0% among South Asians versus 11.3% among Caucasians (41). Within India, the few existing epidemiological studies have all been conducted around the national capital of Delhi. In rural samples, two studies published 20 years apart suggest that the prevalence of probable chronic heart disease increased from 17 to 26 per 1000 (42). Nevertheless, these statistics, given that they are drawn from very few epidemiological studies aaf7384-8
7 OCTOBER 2016 • VOL 354 ISSUE 6308
spread throughout the country, may not be relevant for our population. In interviews with providers (carried out after the standardized patient work), we therefore asked directly how often they saw patients with the symptoms that our standardized patients presented. Fifty-seven percent reported seeing a case of diarrhea or dysentery every day, 40% reported seeing a patient with symptoms consistent with asthma at least once every week, and 59% reported seeing a case of chest pain at least once every month (table S9). The relative frequencies are consistent with the underlying burden of disease from epidemiological studies. Equally, they suggest that the tracer conditions that we used are of more than marginal importance in this population. It is difficult to benchmark the effect sizes that we observe on the treatment of these tracer conditions against health outcomes. This is because it is difficult to use clinical trials to compare the health outcomes of people with and without a correct diagnosis; typically, this would require the researcher to know the correct diagnosis but not inform the patient, which has obvious ethical implications. Nevertheless, systematic reviews conclude that the use of ORS and appropriate referral for diarrhea, the use of inhaled corticosteroids for asthma, and the use of aspirin and especially appropriate actions in the first day after a myocardial infarction can all have significant effects on subsequent health outcomes and mortality (43–47). In our data, ORS use increased by 9.5 percentage points, inhaled corticosteroids by 5.2 percentage points, referrals for angina [either for an electrocardiogram (ECG) or to higher care] by 8.0 percentage points, and aspirin prescription by 7.5 percentage points (table S10). If we take the more optimistic view and look beyond the tracer conditions, we find some evidence that the training increased correct case management rates for the broader range of conditions that informal providers see in their daily practice. There was a significant increase among training-group providers in history-taking and examinations in clinical observation data with real patients. In our standardized patient data, greater history-taking and examinations measured through the checklist completion rate is consistently highly correlated with the rate of correct case management; correlational regression analysis suggests that a 100% increase in the checklist increases correct case management rates by 99.5 (72.7, 126.3) percentage points. Previously in the literature, an increase in checklist scores has been linked with improvements in health outcomes among children. Gertler and Vermeesch (48) showed that a 0.16-standard-deviation increase in the checklist score among Rwandan health care providers was associated with a 0.53-standarddeviation increase in the weight-for-age of children less than 1 year old and a 0.25-standard-deviation increase in the height-for-age of children between 2 and 4 years of age (48). In our data, the equivalent increase in the checklist score was 0.29 standard deviations. These facts taken together given us reason to believe that there was an improvement in correct case management for a broad
range of conditions. It must be acknowledged, however, that without data on health outcomes, the potential impact on patient and population health remains speculative and open to multiple interpretations. Why was there no effect on unnecessary medicines or antibiotics? At the same time, the lack of any effect of training on the use of unnecessary medicines, injections, or antibiotics is worrying, particularly because it does not reflect a lack of adequate focus in the training program. In fact, one of the stated aims of the program was what the Liver Foundation calls “harm reduction,” which specifically involved reducing the use of unnecessary medicines and antibiotics. We believe that these null results are directly tied to the revenue model of informal providers. In focus groups, informal providers clarified that their profits depended both on consultation fees and the medicines that they dispense in the clinic; patients pay a single price for the consultation and medicines. The medicines are either purchased directly from wholesale providers in big cities or from sales representatives of pharmaceutical companies. In our sample, 97% of the providers reported that they dispense at least some drugs. 75% reported purchasing from wholesale providers or sales representatives, with the bulk (70%) purchasing from the former only. A standard result in economic models of health care is that in settings where providers can earn profits through medicine sales that are tied to their diagnoses, overtreatment is a natural outcome (49). This has led, for instance, to regulators in the West legislating a split between diagnosis and treatment; typically, primary care providers in the West are not allowed to profit from drug sales. Conversely, in our setting, an exit survey of 2318 patients collected on the same day as the clinical observation shows that 83% of all medicines were directly dispensed by the providers in our sample rather than prescribed. Therefore, it is likely that decreasing the use of unnecessary medicines and antibiotics would have a large effect on their revenues, and we find that training alone was insufficient to overcome this hurdle. In past studies, delinking drug purchases from the process of diagnosis has been shown to dramatically reduce the use of antibiotics (50). We do not claim that this is the only reason for the lack of impact on unnecessary medicine use. Given that unnecessary or harmful practices are higher in the public sector, such behavior may also be driven by perceived (or active) patient demand for such drugs (51, 52). Alternately, beliefs about the efficacy of antibiotics among providers may have been too rigid to change during this training; this remains an area of active research. Conclusion Our results provide the first evidence on the impact of non–disease-specific training for informal providers, an approach that is being considered by several Indian states as a complement to regulation (53). We do not find that training sciencemag.org SCIENCE
Downloaded from http://science.sciencemag.org/ on October 6, 2016
yearly salary for a public M.B.B.S. doctor in West Bengal of $6000, the government could hire just 11 additional M.B.B.S. doctors for the same cost as training 360 informal providers yearly in training centers 5 km from their residences (34, 35). We would expect this high-intensity repeated training to durably bring these informal providers to near-M.B.B.S. case management rates. In addition, this estimate ignores the costs of infrastructure for the PHCs and the various benefits (e.g., pensions and health care) that government doctors receive. Although speculative, the difficulty of improving the quality of public health care, combined with the scarcity and cost of such doctors, suggests that investing in the clinical practice of informal providers is at least an equally efficient allocation of resources.
informal providers leads them to violate rules with greater frequency or to worsen their clinical practice, which are both concerns that have been raised by representatives of the Indian Medical Association. In all dimensions, we either find significant improvements in clinical practice or no discernable change. It is noteworthy that the practices that do not change with training (for instance, the unnecessary use of antibiotics) are considerably worse among the fully trained public M.B.B.S. doctors in our sample, a result that has also been noted previously (16). Both the evidence of a potential beneficial effect of informal provider training as well as that of persistence in certain provider practices should be important inputs into the formulation of strategies regarding informal provider regulation and integration in low-income countries. Methods Training program sample selection Between May and June 2012, the Liver Foundation invited 360 informal providers who had been practicing for at least three years in 203 villages across Birbhum district (one of 20 districts in the state) to participate in the training. This list of 360 providers was the outcome of a census conducted across three community development blocks (Illambazar, Labpur, and Sainthia) between 2011 and 2012. This census listed all untrained health workers who practiced modern (allopathic) medicine, and therefore did not include traditional healers, those who mostly practiced homeopathy or ayurveda, or veterinarians. It also excluded those providers who were not living in the villages in which they were working. Of these, 304 agreed to participate and were randomized into training and control groups with equal allocation to each. Providers randomized into the training group were offered admission to the Liver Foundation Rural Healthcare Practitioner Training Program, which commenced in January 2013. The providers randomized into the control group were informed that they would be eligible for the program at a later date. They were contacted again after the completion of the evaluation in June 2014 and offered enrollment into the next training program. Structure of the training program The objective of the training program was to improve the quality of curative care provision in rural areas, including primary, lifesaving, and referral services, by training the existing health care human resources of the informal sector within the community. Instruction focused on how to identify common ailments, provide early primary remedy, identify cases that required higher-level care, refer such cases to doctors and health facilities, and manage emergencies within a provider’s locality before stabilizing the patient for transport to a facility. Emphasis was placed on the role of informal providers, not as “doctors,” but as health workers who have the respect of the community as well as on “harm reduction” among informal providers. The program covered a broad range of topics, ranging from anatomy and physiology to first aid SCIENCE sciencemag.org
in trauma and public health programs. All instruction was in the regional language (Bengali). Theoretical classes were supplemented with periodic patient simulations and clinical demonstrations of problems encountered in primary care. The 9-month program was taught through two sessions a week, on two different days, with each session consisting of ~2 hours of interaction. Classes were taught at the district capital, which was 9 to 45 km from the providers’ clinics. The program totaled 72 sessions and 150 hours of interaction. Trainees maintained their clinics as usual during the training period, though some had to close on the days of training given the long time commitment inclusive of travel. Teachers were all medical doctors with extensive work experience in rural areas. Training on specific health conditions was conducted between the third and sixth months of the course, preceded by an introduction to medicine and followed by a focus on community medicine and humanity in medicine (table S11). Standardized patient tracer conditions and correct case management Three tracer conditions were used to assess the impact of the multitopic training for informal providers. These were: (i) Chest pain suggestive of unstable angina: The 40- to 45-year-old standardized patient begins his interaction with the provider with the opening statement: “Doctor, this morning I had pain in my chest.” (ii) Respiratory distress suggestive of asthma: The 25to 30-year-old standardized patient begins his interaction with the provider with the opening statement: “Doctor, last night I had a lot of difficulty with breathing.” (iii) Diarrhea in a child sleeping at home: The father of the child begins his interaction with the provider with the opening statement: “My child has been having loose motion. Can you give me some medicines?” Whether a standardized patient case was managed correctly was assessed in three ways. First, we defined correct case management for each standardized patient interaction (1 if correctly managed, 0 otherwise) on the basis of critical case-specific actions, even if paired with additional unnecessary treatments. Second, we defined “only correct case management” as 1 if correctly managed on the basis of critical case-specific actions without the prescription of additional unnecessary treatments, and 0 otherwise. To account for the widespread use of unnecessary medicines and allow for finer assessments, our third definition employed three independent medical professionals (blinded to provider identity) at a leading teaching hospital in the state capital, Kolkata, who rated the quality of case management using a five-item Likert scale ranging from “Lowest quality case management” (1) to “Case management of choice” (5). Using these ratings, we construct two additional outcome variables: whether case management was “average quality or higher” and whether case management was the “lowest quality.”
For the binary characterizations, we employed definitions of correct management appropriate for informal providers, which in practice implies that for conditions such as asthma, “referral” is coded as appropriate. Table S12 documents the conditionspecific definitions used in the manuscript. Alternatively, the treatment grading assigned by the raters allows for finer distinctions as well as the consideration of additional medicines that may have been unnecessary. The results in Table 1 therefore suggest that the findings are robust to alternate methods of assessing the quality of the treatment. Nevertheless, robustness to alternate definitions was also assessed. For instance, for diarrhea, the provision of ORS alone could be used as correct case management; for angina, referral or referral for an ECG could be used as the appropriate definition for correct case management. Depending on the specific definitions used, the most conservative estimate for the mean effects for the intention to treat estimator was 7.6 (95% CI: 0.4, 14.8) percentage points compared to 7.9 (0.4, 15.5) percentage points in the main text. Standardized patient recruitment and training An initial group of candidates was extensively screened, and a total of 16 standardized patients was recruited from this pool and trained for 150 hours by a multidisciplinary team. Protocols developed for a past deployment in rural India were followed in this study (21). There were no adverse events for standardized patients during the fieldwork, reflecting the standardized patients’ ability to use evasion techniques developed during training to successfully avoid any such situations. During the interactions, standardized patients noted if the provider challenged the presentation, forcing them to disclose that the interaction was part of the standardized patient study; no such challenges were recorded so that detection rates were effectively zero. Previous studies have documented low interrater differences in quality of clinical practice assessed using standardized patients (19). Nevertheless, in order to minimize potential bias from variation in care across different standardized patients, we ensured that each standardized patient visited multiple providers and each provider was visited by multiple standardized patients. The assignment allows us to use an additional full set of standardized patient indicators to control for potential inter-rater differences that may be correlated with the assignment to the training group. Including the full set of indicators does not alter any of the results, although there is a marginal decline in precision for some outcome variables (results available on request). Clinical observation The clinical observation tool assesses the behavior of health care providers with real patients using observers who remain in the providers’ clinics for the entire duration of their practice for one day. Since providers saw patients at multiple times, and often at night, observer timings could vary, starting at 08:00 when the clinic 7 OCTOBER 2016 • VOL 354 ISSUE 6308
aaf7384-9
Downloaded from http://science.sciencemag.org/ on October 6, 2016
RE S E ARCH | R E S E A R C H A R T I C L E
opened and finishing as late at 23:00 if the provider closed the clinic late. During the interaction with each patient, a structured questionnaire was completed by the observer with details such as the number and type of examinations completed, the number of questions asked, and the consultation time. Observers were not allowed to speak to the provider or patient at any time during the consultation. At the end of the consultation, the provider would list the medicines dispensed or prescribed for the patient, which would be noted in the structured observation form. The clinical observation tool was adapted for this study from previous use in a number of studies (20). We recognize that clinical observations may be subject to Hawthorne effects as well as potential confounds—e.g. the patient population may be different for trained and untrained providers. It is also the case that the true underlying patient condition remains unknown to the observer. Nevertheless, clinical observations provide information on a broader sample of conditions that affect real patients and allow assessments of the impact of training on the actual use of injections and IVs, which were intentionally avoided by standardized patients.
11.
12.
13.
14.
15.
16.
17.
18.
19.
Caseload and fees data collection Caseload data was collected through clinical observations as well as provider diaries, in which informal providers recorded the number of patients seen one day of each week for three months between months 6 to 9 of the training program. Patient fees were assessed through clinical observations, standardized patient reports, and provider diaries. Further methodological details are provided in the supplementary materials.
20.
21.
22.
23. 24.
RE FE RENCES AND N OT ES
1. M. Sudhinaraset, M. Ingram, H. K. Lofthouse, D. Montagu, What is the role of informal healthcare providers in developing countries? A systematic review. PLOS ONE 8, e54978 (2013). doi: 10.1371/journal.pone.0054978; pmid: 23405101 2. A. Banerjee, A. Deaton, E. Duflo, Wealth, health, and health services in rural Rajasthan. Am. Econ. Rev. 94, 326–330 (2004). doi: 10.1257/0002828041301902; pmid: 19305517 3. A. De Costa, V. Diwan, ‘Where is the public health sector?’ Public and private sector healthcare provision in Madhya Pradesh, India. Health Policy 84, 269–276 (2007). doi: 10.1016/j.healthpol.2007.04.004; pmid: 17540472 4. M. Gautham et al., Informal rural healthcare providers in North and South India. Health Policy Plan. 29, i20–i29 (2014). doi: 10.1093/heapol/czt050; pmid: 25012795 5. B. Kanjilal, S. Mondal, T. Samanta, A. Mondal, S. Singh, “A parallel health care market: Rural medical practitioners in West Bengal, India” (Future Health Systems Research Brief No. 2, Institute of Health Management Research, 2007). 6. “India has 9.36 lakh doctors of modern medicine,” India Medical Times, 13 March 2015; www.indiamedicaltimes.com/2015/03/13/ india-has-9-36-lakh-doctors-of-modern-medicine/. 7. Government of India, Report of the Health Service and Development Committee (Manager of Publications, Delhi, 1946). 8. F. Mullan, S. Frehywot, Non-physician clinicians in 47 subSaharan African countries. Lancet 370, 2158–2163 (2007). doi: 10.1016/S0140-6736(07)60785-5; pmid: 17574662 9. S. Raha, T. Bossert, M. Vujicic, “The Chhattisgarh experience with a three-year course for rural health care practitioners” (Health, Nutrition and Population Discussion Paper, The World Bank, 2010). 10. P. Pulla, “Andhra Pradesh: The state that dared to train ‘quacks’ in medicine,” Mosaic: The Science of Life, 5 November
aaf7384-10
7 OCTOBER 2016 • VOL 354 ISSUE 6308
25.
26.
27.
28.
29.
30.
31.
32.
33.
2015; http://mosaicscience.com/extra/andhra-pradeshquacks. P. Pulla, “India is training ‘quacks’ to do real medicine. This is why,” Mosaic: The Science of Life, 3 November 2015; http://mosaicscience.com/story/india-quacks. Y. Adu-Sarkodie, M. J. Steiner, J. Attafuah, K. Tweedy, Syndromic management of urethral discharge in Ghanaian pharmacies. Sex. Transm. Infect. 76, 439–442 (2000). doi: 10.1136/sti.76.6.439; pmid: 11221125 P. Garcia, J. Hughes, C. Carcamo, K. K. Holmes, Training pharmacy workers in recognition, management, and prevention of STDs: District-randomized controlled trial. Bull. World Health Organ. 81, 806–814 (2003). pmid: 14758407 N. M. Shah, W. R. Brieger, D. H. Peters, Can interventions improve health services from informal private providers in low and middle-income countries? A comprehensive review of the literature. Health Policy Plan. 26, 275–287 (2011). doi: 10.1093/heapol/czq074; pmid: 21097784 T. Abuya et al., Impact of Ministry of Health interventions on private medicine retailer knowledge and practices on antimalarial treatment in Kenya. Am. J. Trop. Med. Hyg. 80, 905–913 (2009). pmid: 19478247 J. Das, A. Holla, A. Mohpal, K. Muralidharan, Am. Econ. Rev. www.aeaweb.org/articles?id=10.1257/aer.20151138&&from=f (2015). S. Sylvia et al., Survey using incognito standardized patients shows poor quality care in China’s rural clinics. Health Policy Plan. 30, 322–333 (2015). doi: 10.1093/heapol/czu014; pmid: 24653216 M. Mohanan et al., The know-do gap in quality of health care for childhood diarrhea and pneumonia in rural India. JAMA Pediatr. 169, 349–357 (2015). pmid: 25686357 J. Das et al., Use of standardised patients to assess quality of tuberculosis care: A pilot, cross-sectional study. Lancet Infect. Dis. 15, 1305–1313 (2015). doi: 10.1016/S1473-3099(15) 00077-8; pmid: 26268690 J. Das, J. Hammer, Quality of primary care in low-income countries: Facts and economics. Annu. Rev. Econ. 6, 525–553 (2014). doi: 10.1146/annurev-economics-080213-041350 J. Das et al., In urban and rural India, a standardized patient study showed low levels of provider training and huge quality gaps. Health Aff. 31, 2774–2784 (2012). doi: 10.1377/ hlthaff.2011.1356; pmid: 23213162 MAQARI Team, “Mapping medical providers in rural India: Four key trends” (Policy Brief, Center for Policy Research, New Delhi, India, 2011). A. Banerjee, A. Deaton, E. Duflo, Health care delivery in rural Rajasthan. Econ. Polit. Wkly. 39, 944–949 (2004). S. K. Jindal, D. Gupta, A. N. Aggarwal, R. Agarwal; World Health Organization, Government of India, Guidelines for management of asthma at primary and secondary levels of health care in India (2005). Indian J. Chest Dis. Allied Sci. 47, 309–343 (2005). pmid: 16255405 Ministry of Health and Family Welfare, Government of India, “Integrated management of neonatal and childhood illness: Physician chart booklet,” 2009; www.medbox.org/integratedmanagement-of-neonatal-and-childhood-illness/download.pdf. “Ischaemic heart disease: Acute myocardial infarction,” http://cghealth.nic.in/ehealth/2013/QA_website/ 5StandardTreatmentGuidelines/AcuteMyocardialInfarction.pdf. J. D. Angrist, J. S. Pischke, “IV with heterogeneous potential outcomes” in Mostly Harmless Econometrics: An Empiricist's Companion (Princeton Univ. Press, 2008), pp. 117–119. J. Das, J. Hammer, Which doctor? Combining vignettes and item response to measure clinical competence. J. Dev. Econ. 78, 348–383 (2005). doi: 10.1016/j.jdeveco.2004.11.004 J. Das, J. Hammer, Money for nothing: The dire straits of medical practice in Delhi, India. J. Dev. Econ. 83, 1–36 (2007). doi: 10.1016/j.jdeveco.2006.05.004 A. V. Banerjee, E. Duflo, R. Glennerster, Putting a band-aid on a corpse: Incentives for nurses in the Indian public health care system. J. Eur. Econ. Assoc. 6, 487–500 (2008). doi: 10.1162/ JEEA.2008.6.2-3.487; pmid: 20182650 I. Dhaliwal, R. Hanna, “Deal with the devil: The successes and limitations of bureaucratic reform in India” (NBER Working Paper 20482, National Bureau of Economic Research, 2014). T. Powell-Jackson, S. Mazumdar, A. Mills, Financial incentives in health: New evidence from India’s Janani Suraksha Yojana. J. Health Econ. 43, 154–169 (2015). doi: 10.1016/ j.jhealeco.2015.07.001; pmid: 26302940 M. Mohanan et al., Effect of Chiranjeevi Yojana on institutional deliveries and neonatal and maternal outcomes in Gujarat, India: A difference-in-differences analysis. Bull. World Health
34.
35.
36.
37. 38.
39.
40.
41.
42.
43.
44.
45.
46.
47.
48.
49.
50.
51.
52.
53.
Organ. 92, 187–194 (2014). doi: 10.2471/BLT.13.124644; pmid: 24700978 West Bengal Recruitment Board, “Recruitment to the posts of Medical Officer (Specialist),” 2016; http://wbhrb.eadmissions. net/Images/WBHRB-MO-Specialist-March-4-2016.pdf. The program costs ~$175 per provider ($2.3 per session), inclusive of all teacher salaries, training hall rentals, and transportation and meal fees. These costs are comparable to those of other published training programs, which range from $50 for 2 days of training to $200 for a longer-duration program designed to improve specific practices among pharmacists (cost calculations for the latter may not have included the time of government employees) (15, 54). R. E. Black et al., Global, regional, and national causes of child mortality in 2008: A systematic analysis. Lancet 375, 1969–1987 (2010). doi: 10.1016/S0140-6736(10)60549-1; pmid: 20466419 Society for Health and Demographic Surveillance, 2015 Annual Report, 2015; www.shds.in/pdfs/publication_2015_1.pdf V. Patel et al., Chronic diseases and injuries in India. Lancet 377, 413–428 (2011). doi: 10.1016/S0140-6736(10)61188-9; pmid: 21227486 OECD (Organization for Economic Co-operation and Development), “Asthma and COPD prevalence,” in Health at a Glance: Europe 2012 (OECD Publishing, 2012); www.oecdilibrary.org/social-issues-migration-health/health-at-a-glanceeurope-2012/asthma-and-copd-prevalence_978926418389619-en. S. K. Jindal et al., Indian study on epidemiology of asthma, respiratory symptoms and chronic bronchitis in adults (INSEARCH). Int. J. Tuberc. Lung Dis. 16, 1270–1277 (2012). doi: 10.5588/ijtld.12.0005; pmid: 22871327 M. J. S. Zaman et al., Incidence and prognosis of angina pectoris in South Asians and Whites: 18 years of follow-up over seven phases in the Whitehall-II prospective cohort study. J. Public Health (Oxf.) 33, 430–438 (2011). doi: 10.1093/ pubmed/fdq093; pmid: 21045007 N. Ahmad, R. Bhopal, Is coronary heart disease rising in India? A systematic review based on ECG defined coronary heart disease. Heart 91, 719–725 (2005). doi: 10.1136/ hrt.2003.031047; pmid: 15894760 M. K. Munos, C. L. Walker, R. E. Black, The effect of oral rehydration solution and recommended home fluids on diarrhoea mortality. Int. J. Epidemiol. 39, i75–i87 (2010). doi: 10.1093/ije/dyq025; pmid: 20348131 S. Suissa, P. Ernst, Inhaled corticosteroids: Impact on asthma morbidity and mortality. J. Allergy Clin. Immunol. 107, 937–944 (2001). doi: 10.1067/mai.2001.115653; pmid: 11398069 P. Ernst et al., Risk of fatal and near-fatal asthma in relation to inhaled corticosteroid use. JAMA 268, 3462–3464 (1992). doi: 10.1001/jama.1992.03490240070039; pmid: 1460737 D. M. Cutler, M. McClellan, J. P. Newhouse, What has increased medical-care spending bought? Am. Econ. Rev. 82, 132–136 (1998). M. McClellan, B. J. McNeil, J. P. Newhouse, Does more intensive treatment of acute myocardial infarction in the elderly reduce mortality? Analysis using instrumental variables. JAMA 272, 859–866 (1994). doi: 10.1001/ jama.1994.03520110039026; pmid: 8078163 P. Gertler, C. Vermeersch, “Using performance incentives to improve health outcomes” (Impact Evaluation Series No. 60, Policy Research Working Paper 6100, The World Bank, 2012). U. Dulleck, R. Kerschbamer, On doctors, mechanics and computer specialists: The economics of credence goods. J. Econ. Lit. 44, 5–42 (2006). doi: 10.1257/002205106776162717 J. Currie, W. Lin, W. Zhang, Patient knowledge and antibiotic abuse: Evidence from an audit study in China. J. Health Econ. 30, 933–949 (2011). doi: 10.1016/j.jhealeco.2011.05.009; pmid: 21733587 X. Sun, S. Jackson, G. A. Carmichael, A. C. Sleigh, Prescribing behaviour of village doctors under China’s New Cooperative Medical Scheme. Soc. Sci. Med. 68, 1775–1779 (2009). doi: 10.1016/j.socscimed.2009.02.043; pmid: 19342138 D. Bennett, C. Hung, T. Lauderdale, Health care competition and antibiotic use in Taiwan. J. Ind. Econ. 63, 371–393 (2015). doi: 10.1111/joie.12075 J. Varghese, The new rural doctor: Qualified quack or appropriate healthcare provider? Indian J. Med. Ethics 7, 70–72 (2010). pmid: 20432877
sciencemag.org SCIENCE
Downloaded from http://science.sciencemag.org/ on October 6, 2016
R ES E A RC H | R E S EA R C H A R T I C LE
RE S E ARCH | R E S E A R C H A R T I C L E
54. J. Chalker, N. T. Chuc, T. Falkenberg, G. Tomson, Private pharmacies in Hanoi, Vietnam: A randomized trial of a 2-year multi-component intervention on knowledge and stated practice regarding ARI, STD and antibiotic/steroid requests. Trop. Med. Int. Health 7, 803–810 (2002). doi: 10.1046/j.13653156.2002.00934.x; pmid: 12225513 ACKN OW LEDG MEN TS
data and replication materials are available on request. J.D., R.H., and A.V.B. declare no conflicts of interest. A.C. is a volunteer at the Liver Foundation and has no further conflicts to disclose. SUPPLEMENTARY MATERIALS
www.sciencemag.org/content/354/6308/aaf7384/suppl/DC1 Materials and Methods Supplementary Text Figs. S1 to S5 Tables S1 to S10 Reference (55) 22 March 2016; accepted 25 August 2016 10.1126/science.aaf7384
Downloaded from http://science.sciencemag.org/ on October 6, 2016
This study was funded through grants from the West Bengal National Rural Health Mission and The World Bank’s Knowledge for Change Program, as well as a Bristol-Myers Squibb Foundation award under the Delivering Hope program to the Liver Foundation, West Bengal, India. At the Liver Foundation, the training program was implemented by S. Mazumdar and K. Chatterjee. R. Ghosh and P. Mukherjee were involved in the organization of the training.
A. Barik, P. Goswami, and A. Dutta provided invaluable assistance in grading all the treatments received by standardized patients. We thank Purshottam, R. Singh, Devender, C. Nanda, S. Bajaj, Geeta, the standardized patients, and members of the Institute for Socioeconomic Research on Democracy and Development (ISERDD) in New Delhi for implementing the field work; V. Das and R. K. Das at ISERDD for their assistance in finalizing all field work material and overseeing the field work; D. D. Roy and S. Chakraborty of J-PAL (The Abdul Latif Jameel Poverty Action Lab) for project management; B. Daniels for excellent research assistance; and M. Pai, Z. Obermeyer, S. Satyanarayana, and A. Wagstaff for helpful comments. The findings, interpretations, and conclusions expressed in this paper are those of the authors and do not necessarily represent the views of The World Bank, its executive directors, or the governments that they represent. All
SCIENCE sciencemag.org
7 OCTOBER 2016 • VOL 354 ISSUE 6308
aaf7384-11
The impact of training informal health care providers in India: A randomized controlled trial Jishnu Das, Abhijit Chowdhury, Reshmaan Hussam and Abhijit V. Banerjee (October 6, 2016) Science 354 (6308), . [doi: 10.1126/science.aaf7384]
Delivering health care to mystery patients Many families in developing countries do not have access to medical doctors and instead receive health care from informal providers. Das et al. used ''mystery'' patients (trained actors) to test whether a 9-month training program improved the quality of care delivered by informal providers in West Bengal (see the Perspective by Powell-Jackson). The patients did not identify themselves to the providers and were not told which providers had participated in the training program. The results of this blinded assessment showed that medical doctors delivered better care than informal providers but that the training program closed much of the gap. Science, this issue p. 80; see also p. 34
This copy is for your personal, non-commercial use only.
Article Tools
Permissions
Visit the online version of this article to access the personalization and article tools: http://science.sciencemag.org/content/354/6308/aaf7384 Obtain information about reproducing this article: http://www.sciencemag.org/about/permissions.dtl
Science (print ISSN 0036-8075; online ISSN 1095-9203) is published weekly, except the last week in December, by the American Association for the Advancement of Science, 1200 New York Avenue NW, Washington, DC 20005. Copyright 2016 by the American Association for the Advancement of Science; all rights reserved. The title Science is a registered trademark of AAAS.
Downloaded from http://science.sciencemag.org/ on October 6, 2016
Editor's Summary