The evolution of banking competition in Mexico (1991-2005) Joaquín Maudosa,b Liliana Solísa
Abstract This paper analyses the evolution of competition in the Mexican banking system in the period 1991-2005, a period of deregulation, liberalisation and consolidation of the sector. For this purpose we use two indicators of competition from the theory of industrial organization (the Lerner index and the Panzar and Rosse´s H-statistic). The empirical evidence does not permit us to reject the existence of monopolistic competition. The Lerner index shows a decrease in competitive rivalry in the loans market and an increase in the deposits market, a loss-leader type of strategy being observed. The results obtained call into question the effectiveness of the measures implemented hitherto, aimed at increasing the competitiveness of the Mexican banking system.
Key words: banking, competition JEL: G21, L10
a
Universitat de València, Departamento de Análisis Económico, Edificio departamental oriental, Avda. de los Naranjos, s/n; 46022 Valencia (SPAIN). Email:
[email protected]
b
Instituto Valenciano de Investigaciones Económicas (Ivie), c/ Guardia civil, 22, Esc. 2ª, 1º, 46020 Valencia (SPAIN). Fax: 34 96 319 00 55; Email:
[email protected] [corresponding author]
1
1. Introduction∗ In recent years the Mexican banking system has undergone major changes, such as its nationalisation in 1982, privatisation in 1991, the financial crisis of December 1994 and its gradual opening-up to foreign investment, beginning in 1994. It was not until December 1998 that the restrictions on banking activity were completely lifted. In this context, several studies have analysed the effect on the Mexican banking system of the events occurring during this period. Thus, in the case of privatisation, Unal and Navarro (1999) show that the Mexican government was very careful to ensure due process and transparency through the entire bank privatisation process. However, the lack of a legal and regulatory framework and lax oversight shadowed the success of the technical process. For his part, Haber (2005) analyses the privatisation of the banking system and argues that the government’s objective was to privatise an oligopolistic banking industry and maximise its revenue. In relation to the opening-up of the Mexican banking market to foreign capital, though there are no studies referring exclusively to the case of Mexico, the literature on emerging countries does not show any conclusive results. On the one hand, authors such as Levine (1996), Demirgüç-Kunt et al. (1998) and Claessens et al. (2000) offer arguments and evidence favourable to opening-up, while other authors (such as Kaminsky and Reinhart, 1999) show arguments against. The events described above can affect the degree of competition in the Mexican banking markets, and consequently the country’s economic development. In this respect, the analysis of competition in the banking sector is important, since the exercise of market power brings with it a social inefficiency that translates into a loss of social welfare (the so-called Harberger triangle), an increase in financial intermediation costs, and consequently slower growth of investment and production. Conscious of the importance of the analysis of banking competition, other studies have focussed on the analysis of the effect of the events described on the evolution of competition in the specific case of the Mexican banking system. Thus, Gruben and McComb (2003) estimate an index of market power with aggregate data ∗
The authors acknowledge the financial support of the Valencian Institute of Economic Research (Ivie). Liliana Solis also thanks the Banco de Mexico for the information provided and the National Council for Science and Technology (CONACYT) and Carolina Foundation for their financial support. The study has been carried out within the framework of the research programs of the Spanish Ministry of Science and Technology-FEDER (SEJ2005-02776 and SEJ2004-00110).
2
and identify a change in competitive behaviour due to privatisation. The results obtained by the authors suggest bank behaviour that is consistent with competitiveness before the privatisation but with super-competitiveness after privatisation in which banks run at levels of output where marginal costs exceed marginal revenues. Dueñas (2003) measures competition and banking profitability in Mexico following the entry of foreign capital (Jan97-Sept02), using the Panzar and Rosse´s H-statistic. Their results indicate deterioration in competition in the banking system and a corresponding increase in the profitability of financial institutions as a result of the opening-up to foreign banks. In the field of measurement of banking competition, other studies referring to emerging countries include Mexico in their samples. Thus, Gelos and Roldós (2004) find that their results are compatible with the existence of monopolistic competition in the period from 1994 to 1999, and that there was no change in the competition following the process of consolidation.1 In this context, the objective of the paper is to measure the degree of competition in the Mexican banking system in the period between 1991 and 2005, a longer period than that analysed in previous studies and one that covers the processes of deregulation, liberalisation and consolidation of the sector. For this we use two indicators taken from the so-called new empirical industrial organization: the Lerner index and the H-statistic. In relation to other studies referring to the Mexican banking system, the novelties of this study are as follows. Firstly, the Lerner index is used for the first time in the Mexican banking system to measure the evolution of market power. The advantage of using it is that it permits the evolution of competition to be analysed annually, and allows market power to be measured separately for the loans and deposits markets. Secondly, the analysis covers a period long enough to be able to observe whether the measures adopted (both privatisation and opening-up to foreign investment) increased competition in the Mexican banking system. It has to be taken into account that studies carried out before now have analysed only the consequences of privatisation (Gruben and McComb, 2003) or the opening-up to foreign investment (Dueñas, 2003). And thirdly, the sensitivity of the results is tested using two measurements of competition (the H-statistic of Panzar and Rosse, and the Lerner index). The results obtained permit us to conclude that the measures adopted and the transformations undergone by the Mexican banking system during recent years have had diverse effects on market power. Specifically, the results indicate that once the sale 1
However, this result is not robust as it uses 1997 as the start of the second sub-period and considers an unscaled revenue equation, since for these cases a decline in competition is found.
3
of the commercial banks to the private sector had been completed, the intensity of competition increased, though with differential behaviour in the loan market (where competition increased) and deposit market (where market power increased). Subsequently, the exchange rate crisis had an adverse effect on inflation and on interest rates, inducing an increase in market power in loans and a decrease in deposits. Finally, once the restrictions on the entry of foreign capital had been completely eliminated in 1998, market power increased in loans, while it decreased in the deposits market, consolidating the following of a loss-leader strategy. Consequently, it is possible that part of the recent growth in the levels of profitability of the Mexican banking system is due to a decrease in competitive rivalry in the banking markets, which calls into question the effectiveness of the measures hitherto implemented. The structure of the rest of the paper is as follows. Section 2 describes the recent evolution of the Mexican banking system. Section 3 details the instruments used to measure banking competition. Section 4 specifies the variables and sample used, and presents the empirical results. Finally, section 5 presents the conclusions.
2. The evolution of the Mexican banking system The Mexican commercial banking system was nationalised in 1982 in the context of a macroeconomic crisis. Fifty eight banks were nationalised, and only eighteen of these remained in 1990, when the process of privatisation began. Specifically, privatisation began with the reform of articles 28 and 123 of the constitution, so that the private sector once more had the possibility of participating in banking activities. The government sold its 18 banks in 14 months (June 91-July 92) at a high price compared to their book value (ratio: 3.49).2 López de Silanes and Zamarripa (1995) suggest that private financial groups paid high prices because they expected limited competition among banks. At that time the entry of foreign capital was not permitted. Haber (2005) defends another position, arguing that although bankers faced a risk of expropriation (since previously the government had already expropriated the banks) they accepted that price because much of the money that they risked was not their own, but came from Mexican small investors, commercial paper, foreign banks, other Mexican banks and in some cases the same bank that had been purchased.
2
A detailed description of the process of privatisation of the Mexican banking system can be found in Gruben and McComb (1997 and 2003) and Haber (2005).
4
With the privatisation of the banking system, the public deficit was reduced, and with it the funding requirements of the public sector, enabling more resources of the banking system to be devoted to financing the private sector. Total loans to the private sector thus increased after the privatisation and decreased following the crisis. Throughout 1994 and particularly at the start of 1995, macroeconomic conditions deteriorated. Foreign investment, in particular portfolio investment, decreased, which given the high level of deficit of the balance of payments, occasioned the devaluation of the exchange rate. This collapse caused two problems in the Mexican banking system: on the one hand, since loans in dollars represented approximately a third of the total loans made by Mexican banks and many of them were taken out by firms without dollar revenue, the non-performing loans grew 156% in a single year, representing approximately 15% of the total loan portfolio (Source: Asociación de Banqueros Mexicanos). The peso value of their debts nearly doubled in the space of a few days once the exchange rate was allowed to float; in addition, foreign investors pulled their funds out of Mexico. Consequently the banks became insolvent, so the financial authorities of Mexico had to implement various programmes to prevent a banking crisis.3 One of the programmes implemented was the Temporary Capitalisation Programme (PROCAPTE) aimed at guaranteeing in the Mexican banking system indices of capitalisation of at least 8 per cent of assets with risk. The banks with a level of capitalisation below the limit established issued convertible debentures that were acquired by the Fund for the Protection of Bank Savings (known by its Spanish acronym FOBAPROA). A special dollar credit window was also implemented since the majority of the banks had problems for the renewal of their credits in foreign currency. Additionally, the programme of capitalisation with purchase of portfolio was implemented for the following entities: BBV, Banca Serfín, Bancomer, Banamex, Banco del Atlántico, Banca Bital, Banca Promex, Bancrecer, Banorte, Banco Confía and Banco Mexicano. Also, the commercial banks’ portfolio of credits was restructured into Investment Units (UDIs). This unit of account reflects the behaviour of the consumer price index, so the amount of the credits denominated in the new currency remains constant in real terms. In this way, the banks transferred the credits that could be converted into UDIs to funds that they themselves managed. These funds, thanks to the 3
Haber (2005) points out that many of the Mexican banks already had problems before the crisis. The reason is that in Mexico institutions and property rights were weak.
5
loans granted by the government, converted the credits to the new currency; thus the government assumed the interest rate risk, while the banks retained only the risk of default. In exchange, the commercial banks took up bonds issued by the government.4 The National Banking and Securities Commission (known by its Spanish acronym CNBV), through Fobaproa, intervened in some banks with solvency problems and capitalised them; in others it only cleaned the bank’s balance sheets of nonperforming loans.5 The total cost to the taxpayer associated with the bailout programs was 19.3 % of the Gross Domestic Product (GDP). For a long time the Mexican banking system was protected from foreign competition. With the signing of the North American Free Trade Agreement (NAFTA), a gradual opening-up to foreign investment was established. Foreign banks could not buy Mexican banks whose market share exceeded 1.5%. Moreover, the total participation of foreign banks had to be less than 8%, though this was gradually increased to a ceiling of 15%. Subsequently, the laws were modified in 1995 with the aim of increasing the limits of foreign participation established in the NAFTA. The individual limit rose from 1.5% to 6% and the final aggregate limit of 15% to 25% (Murillo, 2002). In December 1998, the Mexican Congress approved modifications to allow the foreign investment in Mexican banks to reach 100%, thus permitting the largest banking institutions (Bancomer, Banamex and Serfín) to be acquired by foreign groups. As a consequence of the change in the rules, foreign investment entered the market, establishing new banks in Mexico or merging with Mexican banks. This led to foreign participation rising from 5.5% in 1993 to 52.4% in 1996 and 67.2% in 2000 (see Murillo, 2002). Also, there were other reforms in the financial sector.6 4
Other debtor support programmes are: Agreement for Immediate Support to Bank Debtors (ADE), Complementary Programme of Support for Mortgage Credits, Programme of Support for the Agriculture Livestock and Fisheries Sector (FINAPE), Programme of Support for Medium, Small and Micro Firms (FOYME) and the “Full Stop” Programme. See Murillo (2002) for more detail on the programmes for the reorganisation of the banking system. 5 The CNBV implemented three schemes for the sale of banks with financial problems: sale of branches of the bank in question to commercial banks; whole or part sale of the bank to commercial banks; and part sale of the intervened bank to commercial banks with the option for the latter to subsequently increase their shareholding. 6 In 1997 new accounting criteria and rules were implemented, relating mainly to the recognition of inflation in the financial statements of banks, very similar to international norms. In 1998, the Law on Protection of Bank Savings was passed, establishing the Institute for the Protection of Bank Savings (IPAB). New criteria were issued for calculating the capital requirements of financial institutions, consistent with international standards, as well as new accounting principles and rules relating to greater financial transparency of banking institutions. In 2000 the Law on Protection and Defence of Users of Financial Services and the Mexican Commercial Insolvency Law were passed, aimed at regulating the relationship between debtors and creditors, among others.
6
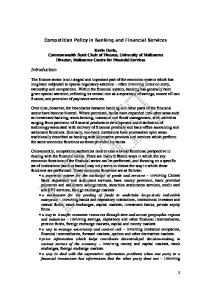
The mergers and acquisitions caused an increase in concentration, which had decreased following the privatisation7 and the banking crisis. As can be observed in Figure 1, there is a downward trend from 1991 to 1996 and a subsequent increase from 1997 onwards. The participation of the three biggest banks (CR3) during 1991-2005 varies between 52 % and 72 %. In order to analyse the effect of the changes described above on the behaviour of the Mexican banking system, it is of interest to analyse the evolution of costs, banking margins and profitability in the period analysed. In the first case, the high personnel costs, and those necessary to endow the banks with advanced technology, heavily influence the increase in average operating costs from 1997 onwards. Nevertheless, the increase in margins permitted the rise in average costs to be absorbed, thus improving operating efficiency (Figure 2). In the case of banking margins, the Mexican banking system is characterised by its high margins. Specifically, an increase in margins is observed as a result of the crisis and of the raising of interest rates, increasing again in 1998 due to the rise in the price of money. At the end of the period, we continue to observe a tendency for the interest margin to increase, propitiated by a context of rising interest rates (see Figure 3). Also, the crisis caused returns on assets (ROA) to decrease, although subsequently, once the banking system had recovered from the crisis, profitability showed an increasing trend, reaching a maximum value in 2005. The overall view of the recent behaviour of the efficiency and the profitability of the Mexican banking system shows that gains in efficiency may have translated into extraordinary profits for the banks and not necessarily into benefits for the rest of the economy. As the Governor of the Bank of Mexico has recently affirmed,8 this situation points to the existence of an uncompetitive banking system with high margins that prevents the economy from attaining the rates of growth that the gains in efficiency would have permitted. Consequently, it is of great importance to evaluate the intensity of competition in financial services. 7
Mexico began to open its markets to new domestic entrants in 1993, and in 1995 the operation of 13 new foreign subsidiaries was authorised. 8 The words of Dr. Guillermo Ortiz, Governor of the Bank of Mexico, at the 69th banking convention held in Acapulco, Gro., March 24th 2006 (http://www.banxico.gob.mx/gPublicaciones/FSPublicaciones.html ).
7
3. The measurement of banking competition The instruments for measuring banking competition can be classified into two groups. The first includes the use of structural indicators (market concentration) and the estimation of the well-known Structure-Conduct-Performance (SCP) vs. the efficient structure hypothesis. The second approach, known as New Economics of Empirical Industrial Organisation, includes the H-statistic of Panzar and Rosse (1987) and the Lerner index of market power. Of the two groups of instruments, this paper focuses on the second, since they are indicators of competition derived from problems of banking optimisation, and therefore present a solid theoretical basis.
3.1 Panzar and Rosse’s H Statistic The essence of the Panzar and Rosse test is to analyse the elasticity of revenue to variations in the prices of the factors of production, by estimating a reduced revenue equation. Specifically, Panzar and Rosse (1987) show that the sum of the revenue elasticities of a firm, relative to the price of its inputs (habitually known as the Hstatistic) provide an evaluation of the competitive structure of a market. Let R be the reduced form of a revenue function that depends on the price of inputs (w) of exogenous variables (z):
R = R( w, z )
(1)
The H- statistic is defined as: H =∑
∂R wi ∂wi Ri
(2)
Panzar and Rosse demonstrate that the H-statistic is negative for monopoly, collusive oligopoly or conjectural variation oligopoly; equal to unity for perfect competition; and between 0 and 1 for monopolistic competition. In empirical applications, the rejection of the null hypothesis that H≤0 eliminates the possibility that a monopoly exists. Rejection of the null hypothesis that H≤1 implies
8
rejection of the three models, while rejection of both hypotheses (H≤0 and H=1, but not H≤1) implies that only monopolistic competition is consistent with the data.9 One way of estimating the H-statistic is by using a log-linear regression of the revenue function used by Bikker and Haaf (2002) and Claessens and Laeven (2004): 3
3
J =1
k =1
ln( Pit ) = α + ∑ β j ln witJ + ∑ γ j ln Yitk + ε it
(3)
where P is the quotient of financial revenue and total assets, w is the prices of the factors of production (labour, lendable funds and physical capital), and Yitk are bankspecific control variables. Specifically, Yit1 are the total assets (scale variable that measures the degree of utilisation of installed capacity at which each bank operates and controls for potential size effects), Yit² are the net loans as a proportion of total assets and Yit³ is the ratio of equity to total assets. This instrument for measuring competition is used in various studies: Nathan and Neave (1989) for the Canadian financial system; Molyneux et al. (1994) for 12 European countries; Shaffer (2002 and 2004) for a bank that has a monopoly in Kent County, Texas; and for a highly concentrated market in the USA, respectively; Carbó et al. (2003a, b and c) use the test to measure competition in the Spanish banking system; Gelos and Roldós (2004) for emerging countries from 1994 to 1999 (including Mexico); and Claessens and Laeven (2004) for 50 countries (including Mexico). For the case of Mexico, Dueñas (2003) uses the test for the period between Jan97 and Sep02.
3.2 Lerner Index
The model most widely used to calculate the Lerner index of market power in the specific case of banking firms is the Monti-Klein model. This model analyses the behaviour of a monopolistic bank that is facing a demand curve for loans with a negative slope L(rL ) and a supply of deposits with a positive slope D(rD ) . The decisionmaking variables are the quantity of the loans (L) and the quantity of the deposits (D). These variables influence their interest rates ( rL and rD , respectively) and their level of capital is taken as given. Another case considered in this model is that the bank is price –taker in the interbank market (r). 9
The validity of the test requires the condition of long term equilibrium. A simple way to test this condition is to replace the dependent variable by ROA in equation (3), so that if the sum of the elasticities of the prices of the inputs is not statistically different from zero the existence of long term equilibrium cannot be rejected.
9
The profit of bank π is the sum of the intermediation margins of loans and deposits minus operating costs (C).
π = π ( L, D) = (rL − r )L + (r − rD )D − C ( D, L)
(4)
Given a value of the elasticities of the demand for loans ε L and of the supply of deposits ε D , the first order conditions of the problem of optimisation are as follows: rL* − r − mcL 1 = * ε L (r *L ) rL
(5)
r − rD* − mcD 1 = * ε D (r *D ) rD
Equations (5) are simply the adaptation to the banking sector of the equalities between the Lerner index (price minus marginal cost divided by the price) and the inverse elasticity. We observe that the lower the elasticity the greater the intermediation margin, i.e. the greater the market power and the higher the Lerner index. As shown by Freixas and Rochet (1997), it is possible to reinterpret the MontiKlein model as a model of imperfect competition (Cournot) among a finite number (N) of banks. In this case, the Cournot equilibrium of the banking sector is an N-tuple of
vectors (Dn* , L*n )n =1,... N , such that for every n, each bank maximises its profit given the
volume of deposits and of loans of the other banks: max rL Ln + ∑ Lm − r Ln + r − rD Dn + ∑ Dm Dn − C (Dn , Ln ) Dn , Ln m≠n m≠ n
so that there is a single equilibrium where each bank sets Ln =
(6)
L D and Dn = . n n
From the first order conditions of the optimisation problem (6) we obtain: r * L − r − mcL 1 = * rL N ε L (r *L )
r − r * D − mcD 1 = * rD N ε D (r *D )
(7)
When N=1, it represents the case of a monopoly and when N=∞ it is perfect competition.
10
The estimation of the Lerner index has been applied, among others, in the studies by Angelini and Cetorelli (2003) for the Italian banking sector; Maudos and Pérez (2003) and Carbó et al. (2003a and b) for the Spanish banking sector; Fernández de Guevara et al. (2005) for the case of five European countries; and Maudos and Fernández de Guevara (2006) for 15 European countries.
4. Empirical approach and results 4.1 Variables, sample and empirical approach
The sample used is formed by an unbalanced panel data from 327 annual observations corresponding to 43 commercial banks for the period between 1991 and 2005, which represent an average 94% of the total assets of the Mexican commercial banking system during the period of study.10 The data is obtained from the Statistical Bulletin of the Multiple Banking system of the National Banking and Securities Commission and from the Basic Banking Information System of the Bank of Mexico. The variables used in the estimation of the H statistic and the Lerner index are as follows: a) Financial revenues / Total assets (Pit). b) Price of labour (w1), obtained as the ratio of personnel expenditure to the number of workers. c) Price of lendable funds (w2), proxied as the ratio of financial costs to deposits. d) Price of physical capital (w3), proxied as the ratio of operating expenses other than personnel costs to fixed assets, e) Interest rate on loans (rL), calculated as the ratio of financial revenue to the value of loans. f) Interest rate on deposits (rD), calculated as the ratio of financial costs to the volume of deposits.11 g) Money market interest rate (r), calculated as the annual average of the interest rate on Federation Treasury Certificates (CETES) at 28 days.12
10
Observations whose information is of doubtful reliability, and banks that did not report information for some of the variables necessary for estimating the indicators of competition, were eliminated from the sample. 11 Given the unavailability of information on interest rates at bank level, these are estimated as the ratio of financial revenues (costs) to the volume of loans (deposits). Thus the problems of availability of data oblige us to work with average interest rates instead of marginal rates.
11
h) Average price of banking assets (rTA), proxied as the ratio of total revenues to total assets. Given the availability of a panel data, the estimation of revenue function (3) includes individual fixed effects in order to capture the influence of specific variables of each bank and time effects that capture the influence of factors common to all the banks and specific to the different years of the period analysed. The Lerner index is estimated separately for loans and deposits, according to expressions (7). Likewise, marginal operating costs are estimated separately for loans and deposits on the basis of the estimation of a translogarithmic cost function: ln cit = ∑ γ h ln whit + γ L ln Lit + γ D ln Dit +
1 ∑∑ γ hm lnwhit ln wmit +γ LD ln Lit ln Dit 2
1 1 + γ LL (ln Lit ) 2 + γ DD (ln Dit ) 2 + ∑ γ hL ln whit ln Lit + ∑ γ hD ln whit ln Dit 2 2 1 + µ1Trend + µ2Trend 2 + µ LTrend ln Lit + µ DTrend ln Dit 2 + ∑ µ hTrend ln whit + vit + uit
(8)
where C are the operating costs, w the prices of the two inputs (labour and capital), L the loans and D the deposits, T is a trend that captures the effect of technical progress. The restrictions of symmetry and grade one homogeneity in input prices are imposed in the estimation. As with the estimation of the revenue function, the estimation of the cost function includes individual fixed effects. On the basis of the estimation of equation (8), marginal operating costs are calculated for loans and deposits for each bank and year of the period analysed according to the following equations:
mcLit =
mcDit =
∂cit c = γ L + γ LL ln Lit + ∑ γ hL ln whit + γ LD ln Dit + µ LTrend it ∂Lit Lit
∂cit c = γ D + γ DD ln Dit + ∑ γ hD ln whit + γ LD ln Lit + µ DTrend it ∂Dit Dit
(9)
12
The most appropriate indicator would be the interbank interest rate (TIIE), but the TIIE has only been published since 1995.
12
In addition, with the aim of comparing the results obtained with the two indicators of competition (Lerner index and H-statistic) it is of interest to calculate a joint or aggregate Lerner index of banking activity. For this we follow the approach used in Maudos and Fernández de Guevara (2004) and Fernández de Guevara et al. (2005 and 2006) who proxy banking production by means of total assets. The joint Lerner index for the total banking activity is thus estimated as follows:
LTA =
rTA − mcTA rTA
(10)
where rTA is the average price of banking activity (proxied as the ratio of banking revenue and assets), and mcTA is the total marginal cost (operating + financial). This last is estimated from a translog total cost function with one output (total assets) and 3 inputs (labour, physical capital and lendable funds).
4.2 Results 4.2.1 Panzar and Rosse’s H- Statistic
Table 1 shows the results of the estimation of the revenue function and the Hstatistic. The value of the H-statistic (0.62) is statistically greater than zero and less than one at 1% significance, reflecting the existence of market power compatible with a situation of monopolistic competition. This result is consistent with that obtained by Dueñas (2003) for the period between 1997 and September 2002, Claessens and Laeven (2004) for the period 1994 to 2001 and Gelos and Roldós (2004) from 1994 to 1999. < Insert Table 1> As commented earlier, the validity of the test requires the existence of long term equilibrium. For this, following Molyneux et al. (1994) and Claessens and Laeven (2004), we re-estimate equation (3) replacing the dependent variable by the return on assets (ROA). As Table 1 shows, it is not possible to reject the hypothesis that the sum of the elasticities of ROA to the prices of inputs is different from zero, so the condition of long term equilibrium is guaranteed.
13
4.2.2 Lerner Index
Figure 4 shows the evolution of the Lerner index and of its determining factors. In the case of the interest rates on loans and deposits, the evolution is in turn determined by the behaviour of the inflation rate, with a steep rise until 1995 and a fall thereafter.13 The marginal operating cost of loans increased from 0.014 in 1991 to 0.027 in 2005, while the marginal operating cost of deposits decreased from 0.033 in 1991 to 0.026 in 2005. In the case of absolute margins (numerator of the Lerner index), the temporal evolution is very different in loans and in deposits. Thus, whereas the absolute margin on loans increased from 1991 to 2005, the margin on deposits decreased in the period analysed. In both cases we observe a steep rise (fall in the liability margin) in 1995 as a consequence of the high inflation rate in that year.14 The decomposition in the period analysed of the change in the absolute margin on loans into a spread with respect to the interbank interest rate rL-r, plus the change in the marginal cost, indicates that the increase of 5.04 percentage points (p.p.) in the absolute margin is due to an increase in the spread of 6.40 p.p. and to an increase of 1.36 p.p. in the marginal cost. In the case of deposits, the spread r-rD decreased 6.60 p.p. and the marginal cost fell 0.67 p.p. so the absolute margin decreased 5.93 p.p. Consequently, the change in the absolute margin, in both loan and deposit markets, is due more to the change in the spread with respect to the interbank interest rates than to the change in marginal costs. In terms of relative margins, market power increased in the loans market while it decreased in that of deposits. This conclusion arises from Figure 4: the Lerner index for loans rose from -0.12 in 1991 to 0.19 in 2005 and fell from 0.10 to -0.40 in deposits. In the loans (deposits) market we observe a negative (positive) relative margin between 1994 and 1998. From 1992 to 1994 and from 1999 to 2005, a loss leader strategy was followed, consisting in capturing liabilities with very small and even negative margins
13
The evolution of asset and liability interest rates calculated with data at bank level using the information from the CNBV is similar to the aggregate interest rates reported by the Bank of Mexico (weighted average rate of short term private securities, and Commercial Bank's Average Cost of Funds known by its Spanish acronym CCP- in domestic currency). 14 The atypical behaviour of margins in that year was also motivated by the fact that, because of problems of availability of information, the interest rates calculated are average rates (obtained as the ratio of revenue/ financial costs to volume of loans /deposits) and not marginal rates.
14
with the aim of attracting or keeping clients who would demand loan services, recovering on the assets side the losses incurred in liabilities.15 With the aim of analysing whether the variation of the Lerner index responds more to the variation of margins relative to the interbank interest rate or relative to marginal costs, it is of interest to decompose the Lerner index as follows: LernerL = 1 −
r mcL − rL rL
mc r LernerD = − 1 − D rD rD
(11)
On the basis of this decomposition, the variation in the Lerner index in loans is due to a decrease of 42 p.p. of the ratio of the interbank interest rate to the interest rate on loans and to an increase of 11 p.p.. in the ratio of marginal cost to interest rate, so the Lerner index increased by 31 p.p. In the case of deposits (which decreased by 50 p.p.), the ratio of the interbank rate to the rate of interest on deposits decreased by 49 p.p., while their marginal operating cost increased by 1 p.p. In consequence, the above decomposition shows that, as in the absolute margin, the variation of the Lerner index in both loans and deposits is due more to the changes in interbank margins than to changes in marginal costs. In terms of total banking activity, Figure 5 shows the evolution of the Lerner index for total assets. A relatively stable value for the index is observed from 1991 to 1998, compatible with the different evolutions of the Lerner indices in loans and deposits during that period. Thus the asymmetric behaviour of market power in both markets -as Figure 4 shows, the evolution of the indices is asymmetrical so that when one increases (decreases) the other decreases (increases)-, explains how in the aggregate market power was relatively stable during this period. On the other hand, from 1998 the Lerner index of market power in banking activity as a whole increased substantially, tripling its value to reach the highest value of the index in 2005. This result, as well as demonstrating an increase in the market power of the Mexican banking system, shows that the loss-leader strategy is highly profitable for the banks, as shown by the fact that the levels of profitability (ROA) have increased substantially since 1998 (see Figure 3).
15
Carbó et al. (2005) and Maudos and Fernández de Guevara (2006) also find evidence of the existence of a loss-leader strategy in the European banking sectors.
15
The evolution of the Lerner index shows that the changes undergone by the Mexican banking system in recent years have had diverse effects on market power. Thus, the results allow us to conclude that, once the sale of the commercial banks to the private sector had been completed, an increase in competition took place.16 During the exchange rate crisis and the period of recuperation, the level of competition presents a certain stability, though with differential behaviour in the markets for loans (where it increased) and deposits (where it decreased). Finally, once the restrictions on the entry of foreign capital were completely lifted and the main banking institutions were acquired by foreign groups, competitive rivalry decreased, perhaps as a consequence of the mergers of the principal banks. This result is consistent with the evidence presented by Dueñas (2003) who finds deterioration in competition and an increase in the profitability of Mexican financial institutions as a consequence of the opening-up of the banking sector to foreign banks.
4.2.3 Robustness test
With the aim of testing the sensitivity of the results obtained, in this section we carry out two robustness tests. The first analyses the sensitivity of results to changes in the period of time analysed. In the second case, we analyse whether the inclusion of non-financial revenues (using therefore total revenues) affects the robustness of the results obtained so far in terms of financial revenues. In the first case, we divide the sample into two sub-periods: from 1991 to 1996 and from 1997 to 2005. There are three reasons for choosing these two sub-samples. Firstly, as commented earlier, from 1997 to 2005 there was a process of consolidation of the Mexican banking system in which foreign investment was allowed entry through mergers and acquisitions. Secondly, and closely related to the previous point, from 1997 onwards there was an increase in the degree of concentration of the market, which could affect the intensity of competition. And thirdly, from 1997 onwards new accounting criteria were applied that could affect the homogeneity of financial statements before and after that date. As shown in Table 2, in both sub-samples, the Panzar and Rosse H-statistic is statistically greater than zero and less than one at 1% of significance, so in both cases 16
The fall in the Lerner index in the period following privatisation is consistent with the supercompetition found by Gruben and McComb (2003) for the same period.
16
the results are compatible with the existence of monopolistic competition.17 The comparison of the H-statistic in the sub-period 1991-96 (0.66) with the value corresponding to the sub-period 1997-2005 (0.63) shows a slight reduction, which would point to less competitive rivalry. In terms of the evolution of the Lerner index (Figure 6), the results for both subperiods are consistent with those obtained for the complete period 1991-2005, though with differences of level. Thus, the separate estimation for the first sub-period shows a negative value of the Lerner index for deposits only in 1993. In the second sub-period, we observe a more significant increase (decrease) in the Lerner index for loans (deposits) in the last year than that observed in the same year in the sample referring to the complete period. The second test of robustness uses total revenue as the dependent variable in equation (3) instead of financial revenues (Table 3). Both in the complete period 19912005 and in the sub-periods 1991-96 and 1997-2005 the H-statistic is statistically greater than zero and less than one, results compatible with the existence of monopolistic competition. The comparison of the H-statistic in the sub-period 1991-96 (0.69) with the value corresponding to the sub-period 1997-20005 (0.61) shows a reduction, again reflecting a reduction in competitive rivalry. Non-financial revenue is likewise included in the calculation of the Lerner index. Since it is not possible to separate the part of non-interest revenue that is generated on the asset side from that arising from liability products, it is allocated entirely to loans. As can be appreciated in Figure 7, the profile of the Lerner index is very similar, so the results are maintained when the total revenue is considered. It is also of interest to analyse the robustness of the Lerner index estimated for banking activity as a whole to variations in the period of time (Figure 8) and to the inclusion of non financial revenue (Figure 9). In the first case, the results show a decrease in market power in the mid-1990s and a subsequent increase, the Lerner index reaching its maximum value in 2005. In the second case, the temporal evolution is
17
In neither of the two sub-periods is it possible to reject the hypothesis that the sum of the elasticities of ROA to input prices is equal to zero, thus guaranteeing long term equilibrium.
17
similar although, logically, the value of the Lerner index increases when non-financial revenue is incorporated into the calculation of the average price of loans. Finally, the temporal evolution of the Lerner index estimated for banking activity as a whole permits us to test the robustness of the results using the two indicators of competition. In this sense, the increase in the value of the Lerner index since 1998 is compatible with the fall in the value of the Panzar and Rosse H statistic, thus demonstrating an increase in market power18.
5. Conclusions
The Mexican banking system has been subjected to major transformations as a consequence of the processes of nationalisation (1982), privatisation (1991), exchange rate crisis (December 1994), gradual opening-up to foreign investment (starting in 1994), and its consolidation from 2000 onwards with mergers among the principal banks. In this context of structural change, this paper analyses the evolution of the degree of competition in the Mexican banking system from 1991 to 2005 using two instruments from the theory of industrial organization: the Panzar and Rosse H statistic and the Lerner index of market power. Compared to other studies of the Mexican banking system, this one presents various novelties. Firstly, and for the first time in the Mexican banking system, it uses the Lerner index to measure the evolution of market power. The advantage of using it is that it permits the evolution of competition to be analysed with greater precision, and market power to be measured separately for the loans and deposits markets. Second, the analysis covers a long period, over which it can be observed whether the measures adopted (both privatisation and the opening-up to foreign investment) have increased competition in the Mexican banking system. Previous studies have analysed the consequences only of privatisation (Gruben and McComb, 2003) or of the opening-up to foreign investment (Dueñas, 2003). And third, the sensitivity of the results is tested using two alternative indicators of competition. The empirical evidence offered by the H-statistic does not permit us to reject the existence of monopolistic competition, a result that is consistent with those of Dueñas (2003) for the period from January 1997 to September 2002, Claessens and Laeven 18
As Panzar and Rosse (1987) show, if the bank faces a demand with constant elasticity and a CobbDouglas technology, then the magnitude of H can be interpreted as an inverse measure of the degree of monopoly power (Lerner index).
18
(2004) for the period 1994 to 2001 and Gelos and Roldós (2004) from 1994 to 1999. The estimation of the H-statistic separately for the sub-periods 1991-96 and 1997-2005 does not permit rejection in either case of the existence of a situation of monopolistic competition, the value of the statistic having decreased slightly from 1997 onwards, which may indicate a lower level of competitive rivalry. The evolution of the H-statistic is compatible with that of the Lerner index of market power when it is estimated (in the aggregate) for the total of banking activity. Thus, the Lerner index presents a clearly increasing evolution from 1998 onwards, so that the value of the index more than triples until it reaches its highest value in 2005. The separate evolution of the Lerner index for each of the two banking markets analysed shows that, from 1991 to 2005, market power increased in the loans market while it decreased in the deposits market. By sub-periods, from 1992 to 1994 and from 1999 to 2005, the results show that the Mexican banking system followed a loss-leader strategy, consisting of capturing deposits by setting liability interest rates that generate negative margins in order to attract or keep clients to whom they grant loans at higher interest rates than those corresponding to a competitive market, thus exercising market power in the latter market. The robustness tests carried out show that the results are sustained in all cases. Thus, the results are very similar when replicated separately for the sub-periods 1991-96 and 1997-05 (before and after the entry of foreign capital into the Mexican banking system) or when the total revenue is considered (including therefore financial and nonfinancial revenue). The results obtained permit us to conclude that the measures adopted and the transformations experienced by the Mexican banking system during recent years have not in general translated into greater competitive rivalry. Specifically, the results indicate that once the sale of the commercial banks to the private sector had been completed, the intensity of competition increased, though with differential behaviour in the markets for loans (where competition increased) and for deposits (where market power increased). Subsequently, the exchange rate crisis had an adverse effect on inflation and on interest rates, inducing an increase in market power in loans and a decrease in that of deposits. Finally, once the restrictions on the entry of foreign capital had been completely eliminated in 1998, market power increased in loans, while it decreased in the deposits market, consolidating the following of a loss-leader strategy. Consequently, it is possible that part of the recent growth of the profitability levels of the Mexican banking system is due to a decrease in competitive rivalry in the banking 19
markets, which would permit us to call into question the efficacy of the measures so far implemented.
20
References
Angelini, P. and Cetorelli, N. (2003). “The effects of regulatory reform on competition in the banking industry”. Journal of Money, Credit and Banking, 35, 663-684 Asociación Mexicana de Banqueros. La Banca en México, Historia 1982-1996 (http://www.abm.org.mx/banca_mexico/historia.htm). Bikker, J.A. and Haaf, K. (2002). “Competition, concentration and their relationship: an empirical analysis of the banking industry”. Journal of Banking and Finance, 26, 21912214. Carbó, S. and Rodriguez, F. (2003a). “Medición de la competencia en los mercados bancarios de las regiones españolas”. Revista de Economía Aplicada, 3 (9), 5-33. Carbó, S., Humphrey D., and Rodriguez, F. (2003b). “Bank deregulation is better than mergers”. Journal of International Financial Markets, Institutions and Money, Vol. XIII, nº 5,. 429-449. Carbó, S., Humphrey D., and Rodriguez, F. (2003c). “Deregulation, Bank Competition and Regional Growth”. Regional Studies, 37(3), 227-237. Carbó, S., Fernández de Guevara, J., Humphrey, D. and Maudos, J. (2005). “Estimating the intensity of price and non-price in banking: an application to the Spanish case”. DT 05-02, Fundación BBVA. Claessens, S. Demirgüç-Kunt, A., and Huizinga, H. (2000). “How does foreign entry affect domestic banking markets?” Journal of Banking and Finance, 25(5), 891-911. Claessens, S. and Laeven, L. (2004). “What Drives Bank Competition? Some International Evidence”. Journal of Money, Credit, and Banking, Vol. 36, No. 3, 563583. Comisión Nacional Bancaria y de Valores. (several years). “Boletín Estadístico de Banca Múltiple”. México. Demirgüç-Kunt, A. Levine, R. and Min, H.-G. (1998). “Opening to Foreign Banks: Issues of Stability, Efficiency and Growth” in The Implications of Globalization of World Financial Markets, The Bank of Korea. 21
Dueñas, R. (2003). “Metodología de Panzar y Rosse para la medición de competencia en la banca mexicana a partir de la entrada de capital extranjero (1997-2002)”. Gaceta de Economía, Año 9, Núm. 17, 141-170. Fernández de Guevara, J., Maudos, J. and Pérez, F. (2005). “Market Power in European Banking Sectors”. Journal of Financial Services Research, Vol. 27 (2), 109-138. Fernández de Guevara, J., Maudos, J. and Pérez, F. (2006). “Integration and competition in European banks”. Journal of International Money and Finance, fourthcoming. Freixas, X and Rochet, J.C. (1997). Microeconomics of Banking, Massachussetss Institute of Technology, MIT Press. Gelos, R.G. and Roldós, J. (2004). “Consolidation and market structure in emerging market banking system". Emerging Markets Review, 5, 39-59. Gruben, W and McComb, R. (1997). “Liberalization, privatization, and crash: Mexico's banking system in the 1990”. Federal Reserve Bank of Dallas Economic Review, First Quarter, 21-30. Gruben, W. and McComb, R. (2003). “Privatization, competition and supercompetition in the Mexican commercial banking system”. Journal of Banking & Finance, 27, 229249. Haber, S. (2005). “Mexico's experiments with bank privatization and liberalization, 1991-2003”. Journal of Banking and Finance, 29, 2325-2353. Kaminsky, G. and Reinhart, C. (1999). “The Twin Crises: The Causes of Banking and Balance of Payments Problems”. American Economic Review, 89 (3), 473-500. Levine, R. (1996). “Foreign Bank, Financial Development, and Economic Growth”. International Financial Markets: Harmonization versus Competition, Edited by C.E. Barfield. Washington, D.C. The American Enterprise Institute Press. 224-254. Lopez de Silanes, F., and Zamarripa, G. (1995). “Deregulation and Privatization of Commercial Banking”. Revista de Analisis Económico, 10 (November): 113-164.
22
Maudos, J. and Pérez, F. (2003). “Competencia versus poder de mercado en la banca española". Moneda y Crédito, 217, 139-166. Maudos, J. and Fernández de Guevara, J. (2004). “Factors explaining the interest margin of the banking sectors of the European Union”. Journal of Banking and Finance, 28(9), 2259-2281 Maudos, J. and Fernández de Guevara, J. (2006). “The cost of market power in the European banking sectors: social welfare loss vs. inefficiency cost”, Working Paper 248, FUNCAS. Molyneux, P., Lloyd-Williams. W., and Thornton, J. (1994). “Competitive Conditions in European Banking”. Journal of Banking and Finance, 18, 445--459. Murillo, J. (2002). “La banca en México: privatización, crisis y reordenamiento”. Working Paper, Banco de Mexico. Nathan, A. Neave, E. (1989). “Competition and contestability in Canada's financial system: empirical result”. Canadian Journal of Economics XXII, No. 3, 576-594. Panzar J. and Rosse, J. (1987). “Testing for Monopoly' Equilibrium”. Journal of Industrial Economics, 35, 443-456 Shaffer, S. (1993). “A test of competition in Canadian Banking”, Journal of Money, Credit and Banking, Vol. 25, No. 1, 49-61. Shaffer, S. (2002). “Conduct in a banking monopoly”. Review of Industrial Organization, 20, 221-238. Shaffer, S. (2004). “Patterns of competition in banking”. Journal of Economics and Business, 56, 287-313. Unal H. and Navarro M. (1999). “The Technical Proces of Bank Privatization in Mexico”. Journal of Financial Services Research, 16 (1), 61-83.
23
Figure 1. Concentration of the Mexican banking markets 2000
75%
1900 70% 1800 65%
1700 1600
60%
1500 55%
1400 1300
50%
1200 45% 1100 1000
40% 1991
1992
1993
1994
1995
1996
1997
1998
1999
Herfindahl Index
2000
2001
2002
2003
2004
2005
CR(3) (right axis)
Source: Calculations were made using data from Comisión Nacional Bancaria y de Valores.
Figure 2. Average operating costs and efficiency of the Mexican banking system 6%
90%
80%
70%
5%
60%
50%
40%
4%
30%
20%
10%
3%
0% 1991
1992
1993
1994
1995
1996
1997
Operating Expenses / Total Assets
1998
1999
2000
2001
2002
2003
2004
2005
Operating Expenses / Gross Income (right axis)
Source: Own elaboration with data from Comisión Nacional Bancaria y de Valores.
24
Figure 3. Margins and profitability
9% 8% 7% 6% 5% 4% 3% 2% 1% 0% 1991
1992
1993
1994
1995
1996
1997
1998
1999
2000
2001
2002
2003
2004
2005
-1% -2%
Net interest income / Total Assets
Gross operating income / Total Assets
Net operating income / Total Assets
ROA / Total Assets
Source: Own elaboration with data from Comisión Nacional Bancaria y de Valores .
25
Figure 4. The evolution of the Lerner index Marginal operating costs
Interest rates 0.04
0.6
0.035
0.5 0.03
0.4 0.025
0.3
0.02
0.015
0.2 0.01
0.1 0.005
0 1991
1992
1993
1994
1995
1996
1997
Loans
1998
1999
2000
Deposits
2001
2002
2003
2004
2005
0 1991
1992
1993
1994
1995
1996
1997 mc
inflation
1998
1999
2000 mc
L
2001
2002
2003
2004
2005
D
Source: Own elaboration based on data from Comisión Nacional Bancaria y de Valores and Banco de México.
Source: Own elaboration based on data from Comisión Nacional Bancaria y de Valores and Banco de México.
Lerner Index
Absolute margins 0.6
0.15
0.1
0.4
0.05 0.2
0 1991
1992
1993
1994
1995
1996
1997
1998
1999
2000
2001
2002
2003
2004
2005
0 1991
1992
1993
1994
1995
1996
1997
1998
1999
2000
2001
2002
2003
2004
2005
-0.05 -0.2
-0.1 -0.4
-0.15
-0.6
-0.2 Loans
Deposits
Source: Own elaboration based on data from Comisión Nacional Bancaria y de Valores and Banco de México .
Loans
Deposits
Source: Own elaboration based on data from Comisión Nacional Bancaria y de Valores and Banco de México.
26
Figure 5. Lerner index in total banking activity 1991-2005 0.4
0.025
0.35 0.02 0.3
0.25
0.015
0.2 0.01 0.15
0.005
0.1
0.05 0 0 1991
1992
1993
1994
1995
1996
1997
1998
1999
2000
2001
2002
2003
2004
2005 -0.005
-0.05 rTA
mc TA
Lerner TA
r TA - mcTA (right axis)
Source: Own elaboration based on data from Comisión Nacional Bancaria y de Valores and Banco de México.
27
Figure 6. Lerner index: estimation by sub-periods 1991-1996
0.5 0.4 0.3 0.2 0.1 0 1991
1992
1993
1994
1995
1996
-0.1 -0.2 -0.3 -0.4 -0.5 Loans
Deposits
Source: Own elaboration based on data from Comisión Nacional Bancaria y de Valores and Banco de México .
1997-2005
0.4
0.3
0.2
0.1
0 1997
1998
1999
2000
2001
2002
2003
2004
2005
-0.1
-0.2
-0.3
-0.4
-0.5
Loans
Deposits
Source: Own elaboration based on data from Comisión Nacional Bancaria y de Valores and Banco de México .
28
Figure 7. Lerner index: total revenues 1991-2005 0.6
0.4
0.2
0 1991
1992
1993
1994
1995
1996
1997
1998
1999
2000
2001
2002
2003
2004
2005
-0.2
-0.4
-0.6
Loans
Deposits
Source: Own elaboration based on data from Comisión Nacional Bancaria y de Valores and Banco de México.
29
Figure 8. Lerner index in total banking activity: estimation by sub-periods 1991-1996 0.045
0.35
0.04
0.3
0.035 0.25 0.03 0.2
0.025
0.15
0.02 0.015
0.1 0.01 0.05
0.005
0
0 1991
1992 rTA
1993 mc TA
1994 LernerTA
1995
1996
rTA - mcTA(right axis)
Source: Own elaboration based on data from Comisión Nacional Bancaria y de Valores and Banco de México .
1997-2005 0.05
0.3
0.045 0.25
0.04 0.035
0.2
0.03 0.15
0.025 0.02
0.1
0.015 0.01
0.05
0.005 0
0 1997
1998
1999 r
TA
2000 mc
TA
2001 Lerner
TA
2002 r
TA
- mc
2003
TA
2004
2005
(right axis)
Source: Own elaboration based on data from Comisión Nacional Bancaria y de Valores and Banco de México .
30
Figure 9. Lerner index in total banking activity: total revenues 1991-2005 0.4
0.05 0.045
0.35
0.04
0.3 0.035
0.25
0.03
0.2
0.025 0.02
0.15
0.015
0.1 0.01
0.05
0.005
0
0
1991
1992
1993
1994
1995 r TA
1996
1997 mc
TA
1998
1999 Lerner
2000
TA
2001 r TA- mc
2002
2003
2004
2005
(right axis)
TA
Source: Own elaboration based on data from Comisión Nacional Bancaria y de Valores and Banco de México.
31
Table 1: H-statistic Variable ln(w1) ln(w2) ln(w3) ln(Y1) ln(Y2) ln(Y3) Hausman Test p-value Observations 2 R H-statistic H=0 (p-value) H=1 (p-value) E p-value E=0
91-05 0.035 (1.49) 0.600 * (17.72) -0.017 (-0.87) -0.166 * (-5.47) 0.178 * (4.64) -0.012 (-0.28) 172.81 (0.000) 327 0.949 0.618 MC [0.000] (0.000) -0.198 LR [0.557]
Dependent variable: ln(Financial income / Total Assets) Estimations with fixed effects and time effects The reported t-statistics are based on robust standard errors t-statistics are in parentheses * Significant at 1%,** significant at 5%, and *** significant at 10% E: Sum of elasticities of ROA of the firm with respect to the firm's input prices MC: Monopolistic Competition ( H>0 and H0 and H