JULY, 2012
The ELI-D function as a tool to characterize the chemical bond in crystalline solids Alfonso Gallo Bueno Master Thesis
European Master in Theoretical Chemistry and Computational Modelling
JULIO, 2012
´ ELI-D en el La funcion estudio del enlace qu´ımico ´ en solidos cristalinos Alfonso Gallo Bueno ´ Tesis de master
´ Master europeo en ´ ´ Computacional Qu´ımica Teorica y Modelizacion
´ D. Angel Mart´ın Pend´ as, Catedr´atico del Departamento de Qu´ımica F´ısica y Anal´ıtica de la Universidad de Oviedo y Coordinador del M´aster Europeo en Qu´ımica Te´orica y Modelizaci´on Computacional,
CERTIFICA: Que el trabajo titulado La funci´ on ELI en el estudio del enlace qu´ımico en s´ olidos cristalinos ha sido realizado por Alfonso Gallo Bueno, bajo la tutela ´ del catedr´atico D. Angel Mart´ın Pend´as con el fin de optar al t´ıtulo que otorga el M´aster Europeo en Qu´ımica Te´orica y Modelizaci´on Computacional.
Oviedo, 25 de julio de 2012
´ Fdo.: Angel Mart´ın Pend´as Coordinador del M´aster Europeo en Qu´ımica Te´orica y Modelizaci´on Computacional
´ D. Angel Mart´ın Pend´ as, Catedr´atico de Qu´ımica F´ısica del Departamento de Qu´ımica F´ısica y Anal´ıtica de la Universidad de Oviedo,
CERTIFICA: Que el trabajo titulado La funci´ on ELI en el estudio del enlace qu´ımico en s´ olidos cristalinos, ha sido realizado bajo su direcci´on por Alfonso Gallo Bueno, constituyendo su Tesis de M´aster, cuya presentaci´on autoriza.
Oviedo, 25 de julio de 2012
´ Fdo.: Angel Mart´ın Pend´as
Aknowledgments ´ I wish to thank Angel Mart´ın Pend´as for the inestimable teaching and help and for supervising my work dedicating me his time. Many thanks to Victor Lua˜ na Cabal for the fruitful conversations. To Miroslav Kohout and Alexey Baranov for the prompt and inestimable help with the theoretical and computational dificulties. Thanks as well to Evelio Francisco Migu´elez for carefully reading my work. I want to express my gratitude to Nuno Galamba for receiving me in Lisbon, where I wish to return. Beautiful city, awesome people. I also want to warmly thank my lab collegues Mamel, Miriam, David and Roberto for helping any time necessary and making a enjoyable atmosphere everyday. To pinche Marco and Alberto, to encourage them to return. Specially warm thanks to Marcos, my collegue of adventures during the master. I would like to send also a big hug to Ana, for being her. Finally many thanks to David, for vehemently showing me his musical preferences in Valencia. A friend.
ix
To my mother To Tati y Tata, “¿qu´e tengo yo, que mi amistad procuras?” L. de V.
Abstract The Electron Localizability Indicator (ELI) is a scalar field able to resolve the atomic shell structure of atoms, molecules and solids. One of its specific forms ELI-D allows for partitioning of the space into extremely small space-filling nonoverlapping regions enclosing a fixed amount of electron pair density. Such localization domains are of three types corresponding to the valence region —bonding regions—, the atomic core —non-bonding regions— or the lone pairs. Localization (LI) and Delocalization Indices (DI) result from the evaluation of the overlap integrals within such regions and yield information about how the valence electrons arrange forming covalent, ionic or metallic bonds. We have examined the performance of the ELI-D as computed with the DGrid code [1] in representative systems for metals (bcc K), ionic systems (NaF and LiCl) and semiconductors (SnTe) and compared it with the standard results of the Quantum Theory of Atoms In Molecules. As model systems of each type the crystals bcc K (metal), NaF and LiCl (ionic) and SnTe (covalent) were chosen. From the results obtained we can conclude that evaluation of LIs and DIs within ELI-D basins arises as a tool to quantitatively determine the nature of the chemical bond in crystal structures.
xiii
Contents 1. Introduction
3
2. Theoretical methods 2.1. The Schr¨odinger equation . . . . . . . . . . . . . . . . . . . . . . 2.1.1. The antisymmetry or Pauli exclusion principle . . . . . . . 2.1.2. The Hartree-Fock approximation . . . . . . . . . . . . . . 2.2. Density Functional Theory . . . . . . . . . . . . . . . . . . . . . . 2.2.1. First Hohenberg-Kohn theorem . . . . . . . . . . . . . . . 2.2.2. Second Hohenberg-Kohn theorem . . . . . . . . . . . . . . 2.2.3. The Kohn-Sham Approach . . . . . . . . . . . . . . . . . . 2.2.4. Electron Distribution and Density Matrices . . . . . . . . 2.3. Chemical bond descriptors in real space . . . . . . . . . . . . . . . 2.3.1. QTAIM . . . . . . . . . . . . . . . . . . . . . . . . . . . . 2.3.2. Restricted Space Partitioning . . . . . . . . . . . . . . . . 2.4. Localization and Delocalization indices . . . . . . . . . . . . . . . 2.4.1. Delocalization indices from solid state APW DFT calculations 2.4.2. QTAIM Vs. ELI-D space partitioning . . . . . . . . . . . .
7 7 8 9 13 13 14 14 20 25 25 28 38 41 42
3. Computational methods 3.1. The family of (L)APW methods . . . . . . . . . . . 3.1.1. The APW method . . . . . . . . . . . . . . 3.1.2. Linearized Augmented Plane-Wave method . 3.1.3. LAPW with Local Orbitals: LAPW + LO . 3.1.4. The APW-lo method . . . . . . . . . . . . . 3.1.5. Mixed basis sets . . . . . . . . . . . . . . . . 3.2. Computational details . . . . . . . . . . . . . . . .
. . . . . . .
43 43 44 45 46 47 48 49
. . . . . .
55 55 57 57 62 65 68
4. Applications 4.1. Metals . . . . . 4.2. Insulators . . . 4.2.1. NaF . . 4.2.2. LiCl . . 4.3. Semiconductors 4.4. Topology of ρ . 5. Conclusiones
. . . . . .
. . . . . .
. . . . . .
. . . . . .
. . . . . .
. . . . . .
. . . . . .
. . . . . .
. . . . . .
. . . . . .
. . . . . .
. . . . . .
. . . . . .
. . . . . .
. . . . . .
. . . . . .
. . . . . .
. . . . . .
. . . . . .
. . . . . .
. . . . . . .
. . . . . .
. . . . . . .
. . . . . .
. . . . . . .
. . . . . .
. . . . . . .
. . . . . .
. . . . . . .
. . . . . .
. . . . . . .
. . . . . .
. . . . . . .
. . . . . .
73
1
2 | Contents 6. Bibliography
75
A. DGrid input files A.1. PREVIOUS STEP: Elk output transformation A.2. STEP 1: Property file . . . . . . . . . . . . . A.3. STEP 2: Space partitioning . . . . . . . . . . A.4. STEP 3 . . . . . . . . . . . . . . . . . . . . . A.4.1. Overlap integrals evaluation . . . . . . A.4.2. Critical points search . . . . . . . . . .
i i ii iii iv iv v
. . . . . .
. . . . . .
. . . . . .
. . . . . .
. . . . . .
. . . . . .
. . . . . .
. . . . . .
. . . . . .
. . . . . .
. . . . . .
1. Introduction Most of our chemical and physical knowledge of nature is sustained upon the invariant behaviour of interacting atoms or ions when forming part of different compounds. These atoms retain their individuality when they are transferred which confers the materials well-defined properties. When treating quantummechanically molecules or condensed phases a new and very different interpretation than the classical, traditional chemical undestanding has arisen, giving rise to the longly debated issue of how to recover the basic chemical concepts from quantum descriptions. Atomic charges, chemical bonds, covalency, ionicity, resonance, etc., as examples among these traditional concepts, are firmly rooted for the chemist or physicist and exploited everyday in chemistry. Due to their relevance and importance much effort is being done to recover these concepts from multi-electron wave functions or to univocally define them. Moreover, it commonly happens that the quantities used to quantify these concepts tend to weaken or even disappear as the accuracy of wave functions increases. Within this context, a new paradigm has arisen in the chemical interpretation of quantum mechanics since it became clear for the scientific community that sophisticated analyses based on the electron density, ρ, might give sound physical meaning to the aforementioned although fuzzy, yet chemically appealing concepts. After Hohenberg and Kohn’s theorem that was the first step towards the nowadays known as Density Functional Theory (DFT) [2], and the developement of the Quantum Theory of Atoms In Molecules (from now on referred to as QTAIM) by R.F.W. Bader [3], it was made possible to give rigorous physical interpretation to chemical bonding concepts through electron densities. The observable character of ρ, amenable to be experimentally determined, also helped to introduce this concept to a broad audience. The need to partition physically every global system property into distinct, isolated contributions is so deeply rooted for the chemist and physicist. Traditional theories of bonding consist of partitioning the electron charge into the nuclear centers under study, usually by means of Mulliken analyses. Many of the interpretative models of chemical behaviour are based on very badly defined concepts, mainly dependent on a whole hierarchy of approximations. Daudel and co-workers have reasoned that there should be some “best” decomposition of the physical space of a system into mutually exclusive regions called loges [4] and [5]. With “best” loges it was meant the most probable division of
3
4 | INTRODUCTION the physical space of a system into localized groups of electons. The best loges were defined in a different sense by Bader el al. in [6]. In real space, the 3D partitioning of space induced by the topology of scalar fields like the electron density have provided a means to deal with the above-mentioned chemical notions. However, due to the sucess of the Electron Localization Function (ELF), it is becoming clearer that the electron density alone is not powerful enough to give solution to all of our most beloved chemical concepts. Most notions used in the work described here depend on quantum mechanical objects that cannot be derived from the electron density alone. Thus, density matrices from which not only one-particle but also two-particle properties such as the electron pair density D2 , may be derived need to be considered. We will use in this work two procedures to partition space. The QTAIM method and the ω-restricted scheme of M. Kohout and coworkers. The former partition is coarse-grained and associates every spatial region usually with atoms; the latters fine-grained with extremely small and of variable size regions defined in such a way that a quantum mechanical property is conserved within them. Based on the one-particle electron density ρ(r), the partition of the space of the QTAIM imposes the condition that a region must be bounded by a surface ~ is zero. Regions subject whose flux of the gradient of the electron density ∇ρ to such constraint are called atomic basins, which are arranged fully occupying the whole volume under study and which are non-overlapping among each other. Each basin, in general, contains only one nucleus: it is usually assigned to an atom [3]. The use of the Fermi hole to measure the Fermi correlation has been pioneered by the works of Lennard-Jones [7] and Bader and Stephens[6]. On the other hand, I will also use a different partition of the space according to the quantity which named Electron Localizability Indicator (ELI), first introduced by M. Kohout [8]. ELI is a common name to a whole family of functionals describing the effect of local correlation of electronic motion in momentum [9] or coordinate space [8]. Here we will use one of its forms, ELI-D ΥσD which is among the most common (for more detailed information about other ELI functionals see [8] and references therein). It is a so called ω-restricted space partitioning which consists on a space decomposition into a huge number of extremely small cells constrained through certain rules. A control function is chosen that determines the cell volumes by imposing the condition that they must enclose the same (infinitesimally) small fixed amount of the control quantity. Once the regions are defined a second sampling function is integrated within each region, whose discrete distribution is further examined [10]. In this work the ELI-D partition has been chosen, meaning that the electron pair density γ(r 1 , r 2 ) as a two-particle quantity is used as the control function whereas the electron density ρ(r) is sampled over the regions.
| 5
Bader’s own background has conditioned the diffusion of his theory, restricted mainly to molecular quantum chemistry, and seldom never applied to condensed matter (for some exceptions see the series [11], [12] and [13], and in [14]). Neither ELI-D has been yet much applied in solid state since it has been recently introduced and its implementation has just been achieved (an exception can be found in [15]. In this exploratory work we have chosen four different crystals to which QTAIM and ELI-D space partitioning has been applied: bcc K as a metal, NaF and LiCl as ionic crystals (insulators) and SnTe as semiconductor. Single point calculations at the experimental geometries of the above crystals have been done using the one-electron full-potential linearized augmented-plane wave (FP-LAPW) code Elk [16]. In the next step the output of Elk was processed by the DGrid program, developed by M. Kohout [1] to create a grid of the electron density and ELI-D values. From these grids the corresponding basins have been searched for and graphically represented. Over the resulting basins, according either to the electron density ρ(r) or to the ELI-D indicator ΥσD , fluctuations, localization and delocalization indices have been evaluated from overlap integrals and used to characterize the bonding situation of the crystals. The structure of the present work is as follows: in Chapter 1 the theoretical methodology used at every step to finally calculate the indices is briefly presented, from the Schr¨odinger equation to the bond descriptors of the chemical bond in real space QTAIM and ELI-D. In Chapter 2, the computational methods and resources used in the different calculations are described. Chapter 3 presents the results for the 4 systems: the critical points (for 3 of the 4 systems), a pictorical representation of the basins and the localization and delocalization indices as well as electron population fluctuations. Finally in Chapter 4 a number of conclusions are gathered.
6 | INTRODUCTION
2. Theoretical methods 2.1. Many electrons wave functions and the Schr¨ odinger equation In quantum mechanics, all the information we can possibly have about a system is contained in the system’s wave function Ψ. The calculation of the wave function not considering relativistic effects nor time dependency consists on solving the Sch¨odinger equation: ˆ = EΨ. HΨ
(2.1)
E is the energy of the system, which results from applying the Hamiltonian ˆ to the aforementioned wave function Ψ. When considering a manyoperator H body problem, i.e., having more than one electron, equation 2.1 becomes: ˆ HΨ(r 1 , r 2 . . . , r N ) = EΨ(r 1 , r 2 . . . , r N ),
(2.2)
where electron 1 is located at position r 1 , electron 2 at r 2 and so on. The ˆ for a system consisting on M nuclei and N electrons Hamiltonian operator H described by position vector RA and ri , respectively, addopts the form:
ˆ =− H
N X 1 i=1
2
∇2i −
M X
N X M N N M M X 1 ZA X X 1 X X ZA ZB ∇2A − + + . (2.3) 2M r r R A iA ij AB i=1 A=1 i=1 j>i A=1 A=1 B>A
The M nuclei and N electrons are designated by A, B and i, j, respectively. Nucleus A has the nuclear charge ZA while MA is the ratio of its mass to the mass of an electron, all in atomic units. The Laplacian operators ∇2i and ∇2A involve second derivation with respect of the space coordinates of the ith electron and the Ath nucleus. The first two terms in the previous equation describe the kinetic energy of electrons and nuclei, respectively. The remaining three terms are the potential of the Hamiltonian and represent the attractive electrostatic interaction nucleus-electron and the potential describing the repulsion nucleus-nucleus and electron-electron, respectively. In our case we will be concerned only with the electronic structure of matter,
7
8 | THEORETICAL METHODS more precisely of solids. Hence the expression for the system’s Hamiltonian Eq. 2.3 can be further simplified by means of the well known Born-Oppenheimer approximation. The mass of an electron is very small compared to that of a nucleus 1 . That big difference between both particle masses makes the electrons move much faster than nuclei do, which allows us to approximate the speed of the nuclei as if they were static. Within the Born-Oppenheimer approximation electrons are considered to move within a field of fixed nuclei and therefore the nuclear kinetic energy (second term in Eq. 2.3) vanishes. The last term, which accounts for the nucleus-nucleus repulsion can be considered to be constant. Since, according to the quantum mechanics rules, the addition of a constant to an operator only adds to the operator eigenvalues but leaves the eigenfunctions unaffected, this term can also be neglected:
ˆ elec = − H
N X 1 i=1
2
∇2i
−
N X M X ZA i=1 A=1
riA
N X N X 1 + = Tˆ + VˆN e + Vˆee , r i=1 j>i ij
(2.4)
which is the electronic Hamiltonian describing the motion of N electrons in the field of M nuclei now represented by point charges. The Sch¨odinger equation becomes now: ˆ elec Ψelec = Eelec Ψelec , H
(2.5)
where the electronic energy Eelec results from the application of the electronic ˆ elec on the electronic wave function Ψelec . And of course the total Hamiltonian H energy is found as: Etot = Eelec + Enuc .
(2.6)
A more detailed description of the nuclear part of the Schr¨odinger equation and the total Hamiltonian can be found anywhere in the literature, as for example [17, 18].
2.1.1. The antisymmetry or Pauli exclusion principle To completely describe an electron we would need to consider not only its spatial but also its spin coordinates. The wave function will then be Ψ(x1 , x2 . . . , xN ), where x1 = (r 1 , σ1 ) are the spatial and spin coordinates, respectively. The wave function itself is not observable. The only physical interpretation that can be obtained out of it is related to the square of it, that yields the probability of finding electron 1 in dx1 , 2 in dx2 , . . . and N in dxN , simultaneously: 1
The nucleus-electron mass ratio for the lightest nucleus (proton 1 H) is of 1,800. For very common atoms as C, the ratio is increased to 20,000.
¨ 2.1. THE SCHRODINGER EQUATION | 9
|Ψ(x1 , x2 . . . xN )|2 dx1 dx2 . . . dxN .
(2.7)
For indistiguishable particles this probability does not change if the coordinates of two of them are exchanged. The nature offers two possibilities regarding the permutation of the coordinates of two particles: either the resulting wave function is identical, in which case we are considering bosons or it is antysimmetric (has opposite sign), and then we are facing fermions. Electrons are fermions with spin = 1/2 and the wave function Ψ is antysimmetric: Ψ(x1 , x2 . . . xN ) = −Ψ(x2 , x1 . . . xN ).
(2.8)
The last expression is the quantum-mechanical generalization of the Pauli exclusion principle. The system wave function will be of course normalized, being the probability to find the N electrons in the whole space equal to the unity: Z |Ψ(x1 , x2 . . . xN )|2 dx1 dx2 . . . dxN = 1. (2.9)
2.1.2. The Hartree-Fock approximation In the search for approximate solutions to the electronic Schr¨odinger equation as described in Eq. 2.5 the Hartree-Fock procedure still represents not only the corner stone of all conventional, i.e., wave function based quantum chemical methods, but also a conceptually very relevant theory as a first step towards more accurate approximations. The simplest antisymmetric, i.e., fulfilling the Pauli exclusion principle wave function describing the ground state (indicated by the subindex) of an N -electron system, is a single Slater determinant2 : |Ψ0 i = |χ1 χ2 · · · χN i,
(2.10)
where χi are spin orbitals 3 . The variational principle states that the best wave function satisfying the above equation that can be found is the one which yields 2
For a system with just two electrons occupying spin orbitals χi and χj a normalized linear combination of both spin orbitals can be found, in such a way that the antisymmetry principle is satisfied: � Ψ(x1 , x2 ) = 2−1/2 χi (x1 )χj (x2 ) − χj (x1 )χi (x2 ) . This linear combination can be written as a determinant into what is known as a Slater determinant. It can easily be generalized for a N -electron system. −1/2 χi (x1 ) χj (x2 ) Ψ(x1 , x2 ) = 2 χi (x2 ) χj (x1 ) .
3
Spin orbitals are one-electron functions built from a spatial orbital φi (r) and one of the two
10 | THEORETICAL METHODS the lowest energy: E0 = hΨ0 |H|Ψ0 i.
(2.11)
The variational flexibility that will allow us to find the wave function with the lowest associated energy resides within the choice of spin orbitals. The energy E0 has to be variationally minimized with respect to the choice of spin orbitals. An eigenvalue equation is derived, termed the Hartree-Fock equation, which determines the optimal eigenvalues: f (i)χ(xi ) = ε(i)χ(xi ).
(2.12)
f (i) is an effective one-electron operator known as Fock operator and ε(i) is the corresponding energy for this state. The Hartree-Fock approximation consists of a substitution of the complicated many-body problem into a more simple one-electron situation, in which the electron-electron repulsion is averaged. The electronic Hamiltonian in Eq. 2.4 is transformed approximating the last term, which accounts for the electron-electron repulsion by a potential: M 1 2 X ZA + viHF , f (i) = − ∇i − 2 r iA A=1
(2.13)
where the sum over the N electrons has been removed since the Fock operator f (i) is already defined for ith electron. viHF is the average potential experienced by the electron i due to the influence of the remaining electrons. Explicitly, viHF is composed by the two components: v
HF
N � X
� ˆ ˆ Jj (x1 ) − Kj (x1 ) .
(2.14)
XZ χj (x2 ) 2 1 dx2 . = r12 j6=i
(2.15)
(x1 ) =
j
The first term has the form: vicoul (x1 )
It has a clear meaning. Electron i is described by the spin orbital χi and experiences a one-electron coulomb potential. This potential is dependent on the instantaneous position of electron 2 within χj , the region it occupies. It is hence a −1 two-electron potential. However if we average the interaction r12 between electron spin functions α(s) or β(s): χ(x) = φi (r)σ(s) σ = α, β
¨ 2.1. THE SCHRODINGER EQUATION | 11 1 and electron 2 integrating over all space and spin coordinates x2 of electron 2, the two-electron potential is transformed into a one-electron potential by doing an average. The 2 interaction between electrons 1 and 2 are weighted by the probability dx2 χj (x2 ) of electron 2 to be found in the volume element dx2 . Nevertheless the electron located at χi suffers all interactions arising from the N − 1 electrons. By summing over j 6= i spin orbitals, the total averaged potential acting on the electron in χi is obtained. A coulomb operator can be defined neglecting the sum, which adopts the form: Z 2 1 ˆ dx2 , (2.16) Ji (x1 ) = χj (x2 ) r12 which is the average local potential at x1 due to the electron located at χj . The second term in Eq. 2.14 is called the exchange contribution to the HF potential. It arises from the antisymmetry of the single determinant and has no classical meaning. It can only be understood through its effect when operating on a spin orbital: hZ i ∗ −1 ˆ Kj (x1 )χi (x1 ) = χj (x2 )r12 χi (x2 )d(x2 ) χj (x1 ). (2.17) It can be seen comparing the previous equation with Eq. 2.16 that the action ˆ produces an exchange of the variables in the two spin orbitals. Now χi is of K related to x2 , and the result of the application of the exchange operator depends on the value of χi in all points of space. It is hence said to be nonlocal unlike the coulomb operator. The potential viHF seen by electron i depends on the spin orbitals of the remaining electrons. In other words, the Fock operator depends on its own eigenfunctions. Thus we need to know the solution to solve the equation. The problem has to be solved by means of an iterative procedure named Self-Consistent-Field method. Every SCF loop starts with a initial guess of the spin orbitals that allows for the calculation of the mean potential viHF seen by each electron. Eq. 2.12 is then solved and a new set of spin orbitals obtained, from which a new field viHF is found closing one SCF loop and starting the iteration again until convergence in the χ’s and ε’s is attained (a schematic description of the SCF iterative process can be seen in Fig. 2.1). We have already mentioned that the second term in Eq. 2.4 is also a potential that describes the interaction electron-nucleus. The spatial arrangement of the nuclei is the unique part of the whole equation that changes with the system under consideration. Hence whether our system is a solid, a molecule or an atom
12 | THEORETICAL METHODS is determined by the spatial arrangement of the nuclei, which is specified in the potential v(x) accounting for the electron-nucleus interaction.
Electron correlation The Hartree-Fock approximation simplifies the problem by treating the manybody problem as an effective single-body one. Thus, the HF approach neglects most of the correlation that exists between electrons. Electron correlation arises from the instantaneous repulsion of electrons which is not treated by the effective HF potential. Since the electron-electron interaction is considered as an average the electrons approach too much to each other leading to a higher repulsion than in the real situation. Consequently the HF system is less stable than it really is |EHF | < |E0 |. The correlation energy will be the energy difference between the exact, non-relativistic energy and the HF system Ecorr = E0 − EHF .
(2.18)
Correlated energies have usually two different contributions. The first one, related to the motion of electrons, is called dynamic correlation. In many instances, however, a one Slater determinant description is not possible even in the simplest approximation, i.e., when degenerate or quasi-degenerate states exist. This is called static correlation. In spite of its inherent errors the HF theory is still widely used due to its not too demanding computational requirements. For further and more detailed description of the fundamentals of Quantum Mechanics as well as HF and methods beyond HF, the reader is referred to the writings used to compose this Chapter [19], [20], [17] and [21].
2.2. DENSITY FUNCTIONAL THEORY | 13
2.2. Pos-Hartree-Fock methods: Density Functional Theory The wave function of a system depends on 4N variables (3 spatial and 1 spin coordinates) which makes it a complicated object only able to be fully analyzed in very small systems, and hence automatically excluding most of the systems of interest in biology, material sciences, etc. In addition, this complexity increases the difficulty of having a clear description of the system and makes it hard to find an intuitive interpretation. On the other hand, the Hamiltonian of the system ˆ is at most dependent on 2-particle operators, which suggests that the high H complexity of the wave function contains redundant information that does not need to be considered ˆ elec = Tˆ H |
+ VˆN e {z }
1−particle
+
Vˆee . |{z}
2−particle
Using the electron density ρ —a real space quantity depending on only 3 coordinates— as an alternative option to solve the Schr¨odinger equation makes it possible, in principle, to overcome these problems.
2.2.1. First Hohenberg-Kohn theorem Many attempts were performed in order to find a practical way of solving the Schr¨odinger equation using ρ. The most successful one is established by the first Hohenberg-Kohn theorem. The electron density ρ is firstly proved to be a suitable quantity to solve the Schr¨odinger equation (Eq. 2.1) in the paper published by Hohenberg and Kohn in 1964 [2]. It —quoting literally [2]— states that “the external potential Vext (r)) is (to within a constant) a unique functional of ρ(r); since in turn Vext (r) fixes ˆ we see that the full many body particle ground state is a unique functional of H ρ(r)”. A proof for this statement is easily done by reductio ad absurdum. A sketch runs as follows: � ˆ −→ Ψ0 −→ E0 ρ0 −→ N, ZA , RA −→ H
(2.19)
ˆ The electron density ρ0 uniquely determines the hamiltonian of the system H, and consequently both the wave function Ψ0 and the energy E0 of the system in its ground state are fully determined by the electron density, as well as all the ˆ is the same for any state, all states of the properties of the system. But since H system are as well determined by the ground state electron density ρ0 . Z (2.20) E0 [ρ0 ] = ρ0 (r)VN e dr + T[ρ0 ] + Eee [ρ0 ] . {z } | {z } | System dependent
Universal
14 | THEORETICAL METHODS From the above equation it can be seen that as the electron kinetic energy T as the electron-electron repulsion Vee are independent of the considered system. However the term accounting for the electrostatic interaction nucleus-electron VN e is what determines which kind of system is being treated. Eq. 2.20 can be rewritten, including the universal part into a new functional: the Hohenberg-Kohn functional : Z E0 [ρ0 ] = ρ0 (r)VN e dr + FHK [ρ0 ]. (2.21) FHK is the part which remains unchanged no matter the system. Apart from the electron kinetic energy T it contains information about the electron-electron interaction: Z Z ρ(r 1 )ρ(r 2 ) 1 dr 2 + Encl [ρ]. (2.22) dr 1 Eee [ρ] = 2 r12 The first term is the classical part of the equation, called the Coulomb repulsion J[ρ]. The second part Encl [ρ] is non-classical and accounts for the self-interaction correction and the interparticle correlation.
2.2.2. Second Hohenberg-Kohn theorem We already know by the first H-K theorem that the ground state electron density suffices to determine any of the properties of the system. The next step, also solved by Hohenberg and Kohn in [2], is to ensure that the electron density ρ we are using is indeed the density of the ground state that we are looking for. In that sense the second H-K theorem establishes that the energy E0 delivered by the H-K functional will be the lowest only if the density ρ is the density of the ground state ρ0 . This theorem is a variational principle which can be expressed as ˆ +V ˆ Ne + V ˆ ee |Ψi. E0 = min hΨ|T Ψ→N
(2.23)
In other words, for any trial density the E obtained is an upper limit to the true ground state energy E0 : E0 ≤ E[ρ] = T[ρ] + EN e [ρ] + Eee [ρ].
(2.24)
2.2.3. The Kohn-Sham Approach Many attempts have been performed to attain a practical solution to the H-K equation 2.21. The most successful one is formulated in the second most important article within the developement of the density functional theory by W. Kohn
2.2. DENSITY FUNCTIONAL THEORY | 15 and L. Sham in 1965 [22]. The success of this new approach starts by considering that most of the problems making DFT inaccurate were related to the way the kinetic energy is treated. In their article, Kohn and Sham proposed a Hartree-Fock-like method —since the kinetic energy is more exactly determined within this approach— to more accurately calculate the kinetic energy. A part of it is then determined exactly by introducing the concept of a non-interacting reference system built from a set of orbitals (one-electron functionals), i.e., the electrons are treated as non-interacting fermions. The remaining contribution to the kinetic energy, a small part of the total, is treated by a non-classical approximate functional. Kohn-Sham orbitals The HK functional, expressed in equation 2.21 has the form F[ρ(r)] = T[ρ(r)] + J[ρ(r)] + Encl [ρ(r)].
(2.25)
J[ρ] is a classical term and can be exactly determined but the other two terms remain unkown. Regarding the kinetic energy T[ρ] it became clear that it was not properly described by the simple expression used by other approaches such as the Thomas-Fermi-Dirac model (see [18] for further information on alternative methods to the Kohn-Sham one). The Kinetic energy is now treated by a hamiltonian of a non-interacting system in which the electrons do not interact with each other, ˆfKS named Kohn-Sham operator. A new effective local potential VS is added to account for the electronˆ S has electron interaction with the Hamiltonian of the non-interacting system H the form: ˆS = −1 H 2
N X i
∇2i
+
N X
VS (ri ),
(2.26)
i
where consequently no electron-electron term appears. A pseudo-wave function ΘS is now constructed in a Hartree-Fock manner: ϕ1 (x1 ) · · · ϕN (x1 ) 1 . . . . . . ΘS = √ (2.27) , . . . N ! ϕ1 (xN ) · · · ϕN (xN ) such that the density is exactly recovered from the Kohn-Sham orbitals ϕi ρS (r) =
N X X i
s
|ϕi (r, s)|2 = ρ0 (r).
(2.28)
16 | THEORETICAL METHODS The Kohn-Sham orbitals As mentioned above the main idea of the Kohn-Sham Ansatz consists of finding a new way to more accurately determine the kinetic energy, calculating as most as possible of it exactly. The kinetic energy of the non-interacting system is described as in the true, interacting one with a expression equivalent to the one used within the Hartree-Fock theory (using KS orbitals instead of the HF ones 2.27) N
TS = −
1X hϕi |∇2 |ϕi i. 2 i
(2.29)
The non-interacting kinetic energy TS does not carry all the kinetic energy T 6= TS . The difference with the interacting system is included into a new functional named EXC that contains all the non-classical interactions � � EXC [ρ] = T[ρ] − TS [ρ] + Eee [ρ] − J[ρ] = TC [ρ] + Encl [ρ].
(2.30)
The exchange-correlation functional EXC still remains unknown and the search for the exact one is the main challenge of DFT. It includes:
◦ effects of the self-interaction correction ◦ exchange (antisymmetry) ◦ correlation ◦ a portion belonging to the kinetic energy
After this the expression for the energy of the true, interacting system is written as follows: E[ρ(r)] = TS [ρ] + J[ρ] + EXC [ρ] + ENe [ρ],
(2.31)
where J is the Coulomb term, TS the part of the kinetic energy exactly determined by the non-interacting system, EXC the unknown non-classical exchangecorrelation functional and the external potential that accounts for the nucleielectron interaction ENe . The next step will be to find the proper orbitals for the non-interacting system. To that end we will expand Eq. 2.31 to:
2.2. DENSITY FUNCTIONAL THEORY | 17
N
1X E[ρ(r)] = − hϕi |∇2 |ϕi i+ 2 i N N Z Z 1 1 XX + |ϕi (r 1 )|2 |ϕj (r 2 )|2 dr 1 dr 2 + 2 i j r12 N N Z X X ZA + EXC [ρ(r)] − |ϕi (r 1 )|2 dr 1 . r 1A i A Note that the unknown exchange-correlation term cannot be given any explicit form. LCAO Ansatz for the resolution of the Kohn-Sham Equations By variationally minimizing the true energy expression 2.31 with respect to the KS single-particle orbitals, we get the following 1-electron equation
εi ϕi (r 1 ) =
" N Z #! M X X |ϕj (r 2 )|2 ZA 1 2 dr 2 +VXC (r 1 )− ϕi (r 1 ), (2.32) − ∇1 + 2 r r 12 1A j A
or εi ϕi = ˆfKS ϕi .
(2.33)
The set of KS orbitals, as within the Hartree-Fock context are expanded in terms of a finite basis set that does not provide the exact orbitals but approximates them. The larger the basis set the better the approximation but also the more expensive the calculation. For an infinite basis set every KS orbital will be exactly described. Eq. 2.33, with the orbitals expanded as a linear combination of the basis set has to be solved. The Coulomb operator J and the exchange-correlation operator EXC of Eq. 2.31 are dependent on the electron density ρ, which is function of the orbitals ϕ. However these orbitals are being searched in order to determine the electron density entering in that way in a Self-Consistency problem (Fig. 2.1). A guessed initial density ρ0 is introduced since it is needed to calculate the orbitals, that of course will not be the correct ones. The KS hamiltonian HKS is found from the Coulomb (also called Hartree-Fock potential) and the exchangecorrelation potentials. There are many different approaches to approximate this exchange-correlation potential as LDA, LSDA, GGA, meta-GGA. . . not discussed here. For a more detailed description of these approximations to EXC functional the reader is referred to [18], [24] and [25]. When the KS hamiltonian, named ˆfKS
18 | THEORETICAL METHODS
guessed ρ0
INPUT ρn−1
-
?
determination of J and VXC
HKS
-
� � � � � � � � � + �
solve H KS ϕn εn ϕ n
=
ϕn
-
� � � � � � �� +
construction of ρn from ϕn
no
?
ρn = ρn−1 ? yes ?
ρ self-consistency attained Figure 2.1.: Scheme of the iterative self-consistent procedure to solve the KohnSham equations [23].
2.2. DENSITY FUNCTIONAL THEORY | 19 within the Kohn-Sham approach has been found, the secular equation (see Eq. 2.33) is solved yielding a set of orbitals ϕn . From these orbitals a new density ρn is obtained which will be different from the previous one ρn−1 . Once we have arrived to a point where the difference between both densities is under a threshold the self-consistent loop is thought to be converged and the calculation comes to an end.
20 | THEORETICAL METHODS
2.2.4. Electron Distribution and Density Matrices We will include in this section just a brief selection of the ideas explained in [26]. For a discussion more in detail the reader is referred to the cited work. Due to the increasingly improved computational facilities wave functions for chemical systems become so complicated that they provide no clear information of the electron distribution. Many chemical and physical properties of the system are inferred from this electron distribution and therefore information about it must be somehow extracted from the wave function. This relevant information is in fact contained in a few density functions normally easy to get a clear physical picture from. The wave function of a one-electron system ψA (x) is known as a spin orbital, meaning that it consists of a function termed orbital that describes the region of the space occupied by the electron φA (x), and by another function describing the spin of the electron σA (s). s can be α —spin-up— for s = + 21 or β —spin-down— for s = − 12 . The wave function itself is not observable. Only from the square of this wave function, the density function, can be obtained some physical information: ρ(x) = |ψA (x)|2 .
(2.34)
It determines the probability of finding one electron in the volume element dr with spin between s and s + ds. Decomposing the spin orbital it adopts the form: ρ(x)dx = |φA (r)|2 |α(s)|2 drds.
(2.35)
Summing over all spin possibilities —integrating over spin— we obtain the probability of finding the electron in the volume element dr regardless of the spin. The above equations can be generalized to the N electron case. The many-body wave function looks like Ψ(x1 , x2 . . . xN ) and the squared of it is the probability of finding electron 1 in dx1 , 2 in dx2 , . . . and N in dxN , simultaneously: Ψ(x1 , x2 . . . xN )Ψ∗ (x1 , x2 . . . xN )dx1 dx2 . . . dxN .
(2.36)
Integrating over the space coordinates and spins of all electrons but one we get, due to the indistiguishable character of electrons, N-times the probability of finding one electron of any spin in dx1 whereas the rest of the electrons may be anywhere in space. This quantity is known as the electron density 4 4
Strictly speaking it is a probability density but it is usually given the name electron density, since the electrons can be understood as “smeared out” within the volume element, with a certain density P .
2.2. DENSITY FUNCTIONAL THEORY | 21
Z ρ1 (r 1 ) = N
Ψ(x1 , x2 . . . xN )Ψ∗ (x1 , x2 . . . xN )ds1 dx2 . . . dxN .
(2.37)
The electron density is a non-negative quantity and also an observable —can be obtained by acting on the wave function with the corresponding operator— that integrates to the total number of electrons N and vanishes at infinity: Z ρ(r)dr = N, (2.38) ρ(r → ∞) = 0.
(2.39)
Up to now only one particle has been considered but similar concepts, mutatis mutandis may be extended to higher number of particles. The pair function corresponds to a probability density for two electrons: the electron pair density Z ρ2 (r 1 , r 2 ) = N(N − 1)
|Ψ(x1 , x2 . . . xN )|2 ds1 ds2 dx3 . . . dxN .
(2.40)
The electron pair density is defined as the probability of finding one electron within the volume element dr 1 and simultaneously another one in dr 2 whereas the remaining N−2 electrons are anywhere in space, regardless of spin. How the motions of two electrons are correlated is described by the pair function. It is normalized to the total number of electron pairs that can be formed N(N − 1) and as the electron density is non-negative. For non-iteracting particles the probability of finding one particle at one point of the space and simultaneously another one at any other point, would be just the product of the individual probabilities: N−1 ρ(x1 )ρ(x2 ). (2.41) N The term (N − 1)/N arises due to the indistiguishability of the electrons. ρ2 (x1 , x2 ) =
Density Matrices It can be useful to slightly generalize the density functions from Eq. 2.37 and 2.40. For a 1-electron system, the expectation value of any operator F when the electron is located in the spin orbital ψ is given by Z hF i = ψ ∗ (x)F ψ(x)dx. (2.42) When F is a real operator that acts only on the right ψ(x), ψ ∗ (x) being unaffected by it. Hence the factors order matters and it cannot be expressed as
22 | THEORETICAL METHODS
Z hF i =
F ψ ∗ (x)ψ(x)dx.
This can be solved by changing the name of the variables in ψ ∗ from x to x making them immune to the action of F. The previous equation can now be expressed as Z hF i = F ρ(x; x0 )dx, (2.43) 0
x0 =x
where the electron density from Eq. 2.37 is now generalized to the non-diagonal reduced 1-density matrix, which takes the form
ρ1 (r 1 ; r 01 )
Z =N
Ψ(x1 , x2 . . . xN )Ψ∗ (x01 , x2 . . . xN )ds1 dx2 . . . dxN .
(2.44)
The prime keeps its special character during the action of the operator F and loses it just before the integration. In that way F acts only on the unprimed wave function while the subsequent integration affects all terms. Of course the same applies to the two-electron case, where the non-diagonal reduced 2-density matrix, has the following expression.
ρ2 (r 1 , r 2 ; r 01 , r 02 )
Z = N(N−1)
Ψ(x1 , x2 . . . xN )Ψ(x01 , x02 . . . xN )ds1 ds2 dx3 . . . dxN .
(2.45) Both the electron density and the electron pair density are recovered as the diagonal part of the corresponding density matrices ρ1 (r) = ρ1 (r 1 ; r 1 ),
ρ2 (r 1 , r 2 ) = ρ2 (r 1 , r 2 ; r 1 , r 2 ).
The information about the correlation of electronic motion is understood to be contained in the electron pair density function. This electron correlation can be of two distinct types: - Fermi or exchange correlation: In Eq. 2.45 is defined the generalized reduced density matrix for two electrons, where the primed coordinates are not integrated. The antisymmetry of the wave function established by the Pauli principle states that interchanging the positions of two electrons (x1 and x2 ) for example, will cause ρ2 (r 1 , r 2 ; r 01 , r 02 ) to have its sign changed ρ2 (r 1 , r 2 ; r 01 , r 02 ) = −ρ2 (r 2 , r 1 ; r 01 , r 02 ) In the specific case where we take the diagonal part of this matrix (x1 = x01 and x2 = x02 , cf. section 2.2.4) we recover the pair density ρ2 (r 1 , r 2 ) as
2.2. DENSITY FUNCTIONAL THEORY | 23 defined in Eq. 2.40. For the special case in which both electrons are sharing not only the same position but also the same spin x1 = x2 , ρ2 (r 1 , r 1 ) = −ρ2 (r 1 , r 1 ).
(2.46)
which is the probability that both electrons are identical and occupy exactly the same location, relation that is satisfied solely by the condition ρ2 (r 1 , r 1 ) = 0. This is the exchange correlation which is considered by the HF approach as a consequence of the antisymmetry of a Slater determinant, but has nothing to do with the correlation included in the correlation energy ECHF in the previous chapter (see Eq. 2.18). - Coulomb correlation: However electrons of opposite spin do not suffer the Fermi correlation but are subject to an electrostatic interaction coming from the term 1/rij in Eq. 2.4. There is a repulsion force that applies to all electrons —no matter the spin— due to their charge that prevents them to approximate to each other. This correlation between the motions of the electrons due to their charge is the Coulomb correlation or simply the electron correlation and is not treated at all by the HF approach. In that case, the expansion of the determinants, whereas for the parallel spin 1 =σ2 situation the Pauli principle is fulfilled, as already mentioned ρHF,σ (r 1 , r 2 ) = 2 0. But if the electrons have opposite spin the pair probability equals the product of the individual probabilities and does not take into account the 1 6=σ2 electron correlation ρHF,σ (r 1 , r 2 ) = ρ1 (r 1 )ρ1 (r 2 ). 2 The Fermi and Coulomb correlation can now be included into a correlation factor f (x1 ; x2 ), a term that allows the correlation of electronic motion to be separed from the non-interacting situation, yielding an alternative definition of the pair density expression, which is as follows: � � ρ2 (x1 , x2 ) = ρ(x1 )ρ(x2 ) 1 + f (x1 ; x2 ) .
(2.47)
This correlation factor will vanish in case the electrons do not see each other. A new function can now be defined: the conditional probability Ω(x1 ; x2 ). As its name indicates, it describes the probability of finding one electron at position x2 subject to the condition that another one is already at x1 Ω(x1 ; x2 ) =
ρ2 (x1 , x2 ) . ρ1 (x1 )
(2.48)
This conditional density integrates to N-1, the total number of electrons except the reference electron at x1 . If we make the difference between the conditional density and the uncorrelated probability of finding an electron at x2 , we get the exchange-correlation hole
24 | THEORETICAL METHODS
hXC (x1 ; x2 ) =
ρ2 (x1 , x2 ) − ρ(x2 ). ρ1 (x1 )
(2.49)
The function known as exchange-correlation hole describes the change in the conditional probability provoqued by the correction for self interaction, Fermi and Coulomb correlation in comparison to the totally uncorrelated situation. This quantity is called a hole since it normally caused depletion of electron density at x2 compared to the independent particle situation. It can be understood as a hole the electron creates around itself where no other electron is likely to be found. Since the pair density integrates to N-1 and the density at x2 to N, the exchange-correlation hole integrates to -1. In other words, it contains exactly the charge of one electron Z hXC (x1 ; x2 )dx2 = −1. There are no many-body interactions among electrons in the Coulomb approximation. As a consequence there is no need to consider distribution functions of higher number of electrons than the pair function ρ2 .
2.3. CHEMICAL BOND DESCRIPTORS IN REAL SPACE | 25
2.3. Chemical bond descriptors in real space 2.3.1. Quantum Theory of Atoms In Molecules QTAIM Many chemical concepts introduced on an empirical basis can be assigned a physical explanation through the QTAIM theory. Taking the electron density ρ as the central property QTAIM is able to confer physical meaning, via the topology of the electron density, to basic chemical concepts as bonds or atoms. A full, authoritative account of the theory may be found in [3] and [27].
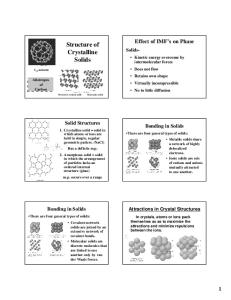
ρ = 0.0026
ρ = 0.002499
ρ = 0.00249
ρ = 0.00235
Figure 2.2.: Progression of the electron density isosurface for K bcc at four different [ρ] = electronsbohr−3 values.
The electron density ρ forms a uniform distribution around the atoms of the system. In Fig. 2.2 can be visualize a density isosurface where all points have the same electron density value. Four different figures can be observed for four different density values of bcc K, specified in the figure. If the isosurface attains higher values than ≈ 0.0025 each atom is surrounded by a spherical shell that corresponds to the atomic basins. Each one of these
26 | THEORETICAL METHODS domains is irreducible and includes only one critical point (see below). But as the isovalues are reduced and approximate to 0.0025 the sphericity around the atoms is lost and the spheres come together establishing contact in one point, termed critical point (in 2.2 see figure with ρ = 0.002499). When isovalues are further reduced the single spheres form a single one as can be seen in the last figure ρ = 0.00235 which forms a single domain including more than one attractor. It can not be assigned to only one atom and consequently loses its topological meaning.
Critical Points The critical points (CP) of ρ are points in real space where the electron density ~ gradient vanishes ∇ρ(r) = (0, 0, 0) and mark special positions in space. CPs can be local minima, maxima or saddle points of the electron density. The differentiation among the different sorts of critical points can be achieved by means of the associated hessian matrix H(ρ(r)), which is a real, symmetric 3 × 3 matrix formed by the pure and mixed second derivatives of the electron density: ∂2 ∂2 ∂2 H(~r ) =
∂x2 ∂2 ∂y∂x ∂2 ∂z∂x
∂x∂y ∂2 ∂y 2 ∂2 ∂z∂y
∂x∂z ∂2 ∂y∂z ∂2 ∂z 2
Diagonalization of the hessian matrix Hρ(r) yields the eigenvalues hxx , hyy , hzz . That allows us to classify a critical point by its ’rank’ and ’signature’. The rank is defined as the number of non-zero eigenvalues of the hessian matrix; in other words, the maximum number of rows (or columns) P hii that are linearly independent . In case one or more hessian vectors. The signature is defined as s = |hii | eigenvalues are equal to zero, i.e., one or more rows (columns) can be expressed as a linear combination of the others, the point is a degenerate critical point. However we will only disscuss here the “nondegenerate critical points”, which can be of four types: Minimum also known as repelor or (3, +3) critical point, if all principal curvatures of the electron density are positive. They can also be given the name Cage Critical Points (CCP). Maximum attractor or (3, −3) critical point, for cases with all curvatures being negative. Saddle point two situations can occur: Bond critical point (BCP) or (3, −1) critical point, for hessian matrices with one principal curvature positive and two negative.
2.3. CHEMICAL BOND DESCRIPTORS IN REAL SPACE | 27 Ring critical point (RCP) or (3, +1) critical point, in case one principal curvature negative and two positive. In order to obtain a well-behaved quantum-mechanical description of an open region of a quantum system, it must be bounded in any way and enclose a finite volume [11]. Eq. 2.50 will be the condition neccessary to limit the extension of the non-overlapping regions defining a basin: ∇ρ(r s ) · n = 0,
(2.50)
where n is the vector normal to the boundary surface, namely the exterior normal and r s indicates that the electron density is evaluated at each point of the surface. A basin is then a region of space where all gradient paths (trajectories) of a chosen scalar field such as electron density terminate at the same ω-limit that is a maximum. In general, each of these basins contains only one nucleus which corresponds to the aforementioned maxima or attractors: a basin usually represents an atom. Otherwise the basin is associated with so called non-nuclear attractor [28]. Every of the basins of a system is bounded by zero-flux surfaces defined by the condition described in Eq. 2.50, which are trajectories terminating at a ω-limit that now is a saddle-point. The partition of the space can however be done according to scalar fields other than the electron density. The Electron Localizability Indicator ELI ΥσD (r) will be explained in the next section 2.3.2. It can as well be used to partition the space into basins (localization domains) that have dissimilar interpretations to the basins defined according to the QTAIM.
28 | THEORETICAL METHODS
2.3.2. Restricted Space Partitioning A ω-restricted partitioning (ωRSP) of the space consists of a subdivision of the system volume into non-overlapping space-filling regions of maximum compactness in such a way that the integral of the control property over any region yields ω.
One strategy to extract information about a system is the examination of a certain property over samples characterized by the same (chosen) quantity, thus allowing the sampled results to be compared. The restricted space partitioning into extremely small regions, namely the samples over the system under study for us, is done according to a chosen quality ω known as control property. This results in a ω-restricted division of the space into regions named µi of volume Vi centered at a chosen position ai . The control property regulates the space partitioning and hence determines the regions volume by satisfying the condition that a fixed ω value will be enclosed within them. Each region will attain such volume that this condition, the ω restriction, is fulfilled. The sampling property is then evaluated at each of the region’s center ai . Although the shape of the sample regions can in principle freely adopt any shape, the partitioning of the space is not arbitrarily done (Fig. 2.3). The system is divided into non-overlaping, spacefilling regions complying the restriction ω and being as compact as possible. In spite of being the most Figure 2.3.: Schematic representations of the recompact isolated region a sult of a ω-restricted partition of the sphere, the shape of the respace. Every region µi is centered gions cannot be spherical when at ai and has a volume Vi imposed constricted to the conditions by the ω-restriction and arbitrary we just mentioned. They will shape. rather adapt the most compact form given that neighbouring regions present maximal compactness as well. Nevertheless, the shape the ωpartitioned regions can adopt is still infinite. A simplified scheme of the way from the base, the restricted population approach, to the top of the ω-restricted partitioning can be found below.
2.3. CHEMICAL BOND DESCRIPTORS IN REAL SPACE | 29 The control function fc : the ω-Restricted Space Partitioning The number of sampling regions is determined by the ω Rvalues and the integral of the control function fc over the whole system Fc = fc (r)dr. Among the different possibilites we could have depending on the value of the integral Fc , we will only be interested in the situation in which the integral of the control funcion over the whole system yields a non-zero real value Fc 6= 0 5 . In that case, there will be a uniquely given finite κ = Fc /ω number of regions for any real restriction ω 6= 0. In that case, when choosing infinitesimally small restrictions (infinitesimally small meaning small enough) the density of the regions (number of regions per volume unit) does not vary significantly for all the possible ways of dividing the space. It is possible to use small enough ω restriction values in such a way that choosing any of the possible manners of partitioning the system (slightly shifting the center ai ) will not increase the number of regions κ (density of sample regions). From now on we will refer to the very small regions as micro-cells.
Restricted population approach: Space division into mutually-exclusive space-filling regions -
Compact regions: Locality of the examined effects -
Integral of ω property over µi = constant: ω-restricted partitioning of the space
��
Partition of the space into compact, mutually exclusive and space-filling micro-cells with ω-dependent variable volumes
Due to the choice of extremely small sampling regions the system presents certain properties. Additionally, the micro-cells being so small makes it possible to approximate the integrals of chosen functions over such regions by polynomials based on the first non-vanishing term of the corresponding Taylor expansion (the approximation of the sampling function integrals over the micro-cells by a Taylor 5
For a deeper disscussion see [29].
30 | THEORETICAL METHODS expansion will be discussed later on). Let us consider as control function a one-particle property: the electron density, ρ1 (r) derived from generalized density matrices as explained in chapter 2.2.4. Integration of the electron density ρ1 (r) over the whole space yields the total number of electrons N in the system. On the other hand, the integral of this control function over any of the non-overlapping space filling regions µi into which the system is partitioned will yield the fixed electronic charge q = ω within this region µi : Z q= ρ1 (r)dr = ω . (2.51) µi
The system is hence partitioned into κ = N/q regions. Given that those regions are micro-cells in the sense explained before, the charge within it can be approximated by q ≈ ρ1 (ai )Vi . The volume of the micro-cell Vi is hence inversely proportional to the R electron density, which is valid for any control function normalised to Fc = fc (r)dr: Vi ≈ ω/fc (ai )
Fc = κω .
(2.52)
For n coordinates it is not so easy and the number of micro-cells κ cannot be found in the same way. Let us consider now a partition of the space using a two-particle quantity, the electron pair density ρ2 (r 1 , r 2 ) (Eq. 2.40), as control function. Each region µi encloses now a fixed number of electron pairs Di . The general expression for a control function fc of n coordinates: Z Z fc (r 1 , . . . , r n )dr n , (2.53) dr 1 . . . ω= µi
µi
becomes now: Z D=
Z dr 1
µi
ρ2 (r 1 , r 2 )dr 2 .
(2.54)
µi
Here the number κ of micro-cells µi for a given restriction ω follows κω ≤ N (N − 1)/2, satisfying that the total number of electron pairs in the system must be equal or higher than the number of electron pairs in all the micro-cells.
The sampling function fs : Restricted Populations The first part for the restricted space partitioning is already achieved: the control function determines the decomposition of the space into sample regions over which the property of interest will be evaluated. As already mentioned, the m-th order spinless reduced density matrix is obtained integrating the N -th order density matrix over the coordinates of (N − m)
2.3. CHEMICAL BOND DESCRIPTORS IN REAL SPACE | 31 electrons over the whole space and summing over both α and β spins. For operators fulfilling a few conditions (they must be spin-free and one- or two-electron operators), the reduced 2-matrix γ (2) (r 01 r 02 , r 1 r 2 ) carries enough information to find the expectation value of such operators. Let us consider a sampling property whose expectation value is given by the ˆ satisfying the above conditions, acting on the wave function of the operator A, system ψ integrated over all space: Z
� ˆ ˆ A = Ψ∗ AΨdV . (2.55) Aˆ being a single-particle operator the previous expression can be reduced to a sum over all the κ micro-cells (having the spin integrated out):
� Aˆ =
Z
ˆ (1) (r 0 ; r)dr = Aγ
κ Z X i=1
ˆ (1) (r 0 ; r)dr . Aγ
(2.56)
µi
The operator Aˆ acting on the 1-matrix yields a function that we call here the sampling function fs . For a single-particle operator the sampling function will take the form: ˆ (1) (r 0 ; r)|r0 →r fs (r) = Aγ while for two-particle operator ˆ (2) (r 0 , r 0 ; r 1 , r 2 )|r0 →r fs (r 1 , r 2 ) = Aγ 1 2
� Evaluation of the expectation value A = Aˆ involves the equating of the primed and unprimed coordinates, resulting in a function which has to be further integrated over the whole space. The resulting expectation value is the electron density ρ1 (r), which corresponds to the diagonal part of the 1-matrix γ (1) (r 0 ; r), is a particular case of a sampling property for single-particle operator. The integral of ρ1 (r) over the whole space yields the total number of electrons in the system, i.e., is normalised to the number of electrons N . P Integration over a micro-cell µi yields the charge of that region qi fulfilling that qi = N .
� Electron pair density ρ2 (r 1 , r 2 ) is the expectation value for the operator Aˆ being a two-particle operator and corresponds to the diagonal part of the 2-matrix γ (2) (r 01 , r 02 ; r 1 , r 2 ), can be chosen as sampling property as well. Equivalently, it is normalised to the total number of electron pairs N (N − 1)/2. However now the sum of the electron pair population in every micro-cell µi does not yield the total number of electron pairs in the system, since in order to get that also the electron pairs Dij shared by two regions (region pairs) µi and µj must be considered. In both cases, using first- or second-order electron densities as sample function fs (and the same would apply for n-th order electron densities) we obtain a distribution of the electron populations {qi } and of the electron pair populations {Di },
32 | THEORETICAL METHODS respectively, for each region µi . The applied restriction will give the name to the distribution of values resulting from integrating fs . In that way, integration of fs over regions restricted according to an ωRSP are named ω-restricted populations. Electron Localizability Indicator A N -electron system is described by the wavefunction Ψ(x1 x2 · · · xN ) with xi = (r i , σi ) being the position r i and spin σi coordinates, respectively, of electron i. The information about the chemical bonding within such a system is carried by the N-matrix Γ(n) . Since the energy can be found from 1 and 2-particle operators, we can assume that in the 2-matrix Γ(2) is contained a relevant part of this chemical information. From this wavefunction 1 and 2-spinless density matrices can be found:
ρ1 (r 01 |r 1 )
Z =N
Z dσ1
Z dx2 · · ·
dxN Ψ∗ (x01 x2 · · · xN )Ψ(x1 x2 · · · xN ) , (2.57)
� �Z Z Z Z N = dσ1 dσ2 dx3 · · · dxN Ψ∗ (x01 x02 · · · xN )Ψ(x1 x2 · · · xN ) . 2 (2.58) The elements in the main diagonal of these density matrices are the electron density and electron pair density, respectively, as previously described in section 2.3.2:
ρ2 (r 01 r 02 |r 1 r 2 )
ρ1 (r 1 ) = ρ1 (r 1 |r 1 ) ,
(2.59)
ρ2 (r 1 r 2 ) = ρ2 (r 1 r 2 |r 1 r 2 ) .
(2.60)
Since the 1-matrix was spinless the electron density is written as a sum of the two spin components, that are probability densities of finding one electron with the corresponding spin in real space: ρ(r 1 ) = ρα (r 1 ) + ρβ (r 1 ) ,
(2.61)
which integrated becomes N = Nα + Nβ . α and β refer to up and down spin respectively. Similarly, the electron pair density is expressed as a sum of four components, each one being now the probability density of finding two electrons with the corresponding spin in position space: αβ βα ββ ρ2 (r 1 , r 2 ) = ραα 2 (r 1 , r 2 ) + ρ2 (r 1 , r 2 ) + ρ2 (r 1 , r 2 ) + ρ2 (r 1 , r 2 ) .
(2.62)
2.3. CHEMICAL BOND DESCRIPTORS IN REAL SPACE | 33 According to Eq. 2.51 the integration of the σ-spin electron density ρ(r 1 ) over the region µi yields the σ-spin electron population qσ , i.e., the charge within this region. In a similar way the integration of the same-spin electron pair density σσ ρσσ 2 (r 1 , r 2 ) over the region µi yields the same-spin pair population D2 (µi ) (Eq. 2.54), i.e., the average number of same-spin electron pairs within the region. The volumes of the regions enclose now a fixed number of same-spin electron pairs: Z Z σσ D2 (µi ) = dr 1 ρ2 (r 1 , r 2 )dr 2 = const. (2.63) µi
µi
The sampling function is now the average number of σ-spin electrons (charge) which is evaluated integrating the electron density over the region µi . This func6 tional is named the D2σσ -restricted electron population Qσσ i (µi ) : Z σ ρσ (r)dr . (2.64) Qi (µi ) = µi
The evaluation of these integrals over pair density can be approximated and hence simplified by the Taylor expansion of the σ-spin pair density around an arbitrary point a1 inside the region µi 7 . Due to the Pauli exclusion principle and the cusp condition, the first nonvanishing term of the Taylor expansion is the Fermi hole curvature at the position r 1 . The same-spin pair density is hereby approximated as: Z Z 1 σσ (s · ∇r2 )2 ρσσ (2.65) D2 (µi ) ≈ 2 (r 1 , r 2 ) r→a dr 1 dr 2 , 2 µi where s = r 2 − r 1 but the operator ∇2r2 acts only on the coordinate r 2 : x,y,z 1 1X ∂2 2 (s · ∇r2 ) = si sj . 2 2 i,j ∂i2 ∂j2
(2.66)
si = (r2 − r1 )i = (x2 − x1 , y2 − r1 , z2 − z1 )i and similarly for sj . As this expansion around the point r 1 results in an new r 1 -dependent function which must be integrated, again a Taylor expansion can be applied, now around the point ai . After the second expansion the number of same-spin electron pairs can be approximated by: Diσσ ≈ 6
7
1 8/3 V g(ai ) . 12 i
(2.67)
Note that the capital letter Qσσ designates the charge as a sampling function in a D2σσ restricted population, whereas qσ refers to the charge as the control function in a qσ -restricted analysis. Giving each region a center serves as a way to differentiate the regions, that can be distinguished by the index a.
34 | THEORETICAL METHODS Vi is the volume of the micro-cell µi and g(ai ) the Fermi-hole curvature at the micro-cell center ai [30].
g(ai ) =
σ X σ X
� � Pij,kl φi (ai )∇φj (ai ) − φj (ai )∇φi (ai )
i 4 was prohibitive in nodes with 32Gb of memory.
4. Applications. Bonding descriptors in model systems 4.1. Metallic solids: bcc K QTAIM Table 4.1 contains the Localization (LI) and Delocalization (DI) Indices computed within the QTAIM theory for bcc K. Metals are believed to present high values of electron DI. According to the free electron model for the behaviour of electrons within a crystalline structure of a metallic solid, valence electrons are completely detached from their ion (like an electron gas). From Bloch’s theorem and Pauli’s principle unbound electrons within a periodic potential behave as free electrons in vacuum. Accordingly enhanced delocalization is expected for alcaline metals like K. High fluctuation σ 2 = 0.80 value (Table 4.1) is observed for the K atomic core basin in comparison to that of ionic compunds (σ 2 (F ) = 0.40, σ 2 (N a) = 0.25 in NaF). This fluctuation, defined for a basin as the difference between the population of the basin and the localization of electrons LI within it (see Eq. 2.83), is interpreted as a measure of the delocalization of the electrons over the whole solid. Each K atomic core region shares δ(A, B) = 0.09 electron pairs with a neighbouring basin. Since every K basin is surrounded by 8 K basins, a total of 0.72 electron pairs are shared with the first neighbour basins. The electron pairs shared with the more distant basins, given by ς(K) = 0.88 (see Eq. 2.86) yield a 55 % (κ = 0.55) of the fluctuation shared with the more distant basins. A electron can delocalize to basins beyond the most inmediate basins, unlike for other non-metallic solids. Further evaluation of the delocalization with the second neighbour basins located at 5.25 ˚ Awould more accurately yield how far an electron can move from the K core. This has not been pursued in this work. For the also alkaline metal bcc Na identical fluctuations (σ 2 = 0.80) and similar DI (δ = 0.10) were found for the closest basins, but a lower number of electron pairs (κ = 0.28) are shared with the solid beyond the second neighbour basins [39].
55
56 | APPLICATIONS
Figure 4.1.: bcc K basins. Left: QTAIM atomic basin of atom K (blue). Right: ELI-D core CK (blue) and bonding B4K (yellow and green) basins. ELI-D The atomic shell structure in real space of a free atom can be figured out by means of ELI-D. The atomic structure is seen as sphere-like basins centered at the nucleus (see Fig. 3.3) that are grouped into basins sets and further merged into superbasins in order to simply their interpretation. Such superbasins are separed into two different kinds: atomic cores and bonding regions, whose appearance is as shown Fig. 4.1 (right). Unlike the QTAIM basins which are found from the density (one-particle quantity) ELI-D basins are based on a two-particle quantity as it is the ELI-D indicator 2.73. All LI as well as fluctuations and electron populations for ELI-D values are included in Table 4.2 whereas DI are shown in Table 4.3. As mentioned before high DI are expected for alkali metals as bcc K. Each bonding basin B4K — where the subindex “4K” indicates that every bonding basin is surrounded by 4 K atomic cores— has a very small population 0.15 and very high fluctuation σ 2 = 0.14 (Table 4.2). Each bonding region B4K shares 0.015 electron pairs with the K core CK (Table 4.3, Fig. 4.1) which makes a total of 0.06 electron pairs. It is also surrounded by 4 bonding basins that it shares 0.011 electron pairs with, making a total of 0.044 pairs. In total every bonding basin shares ς = 0.18 (see Eq. 2.86) electron pairs with the rest of the solid beyond the first neighbours, that is a 64 % of the shared pairs (Table 4.3). Each core basin CK has a very low DI δ = 0.004 with each of the 8 surrounding core basins (compared with the DI with a bonding basin Table 4.3). This value (0.004 × 8 = 0.03) plus the DI with the 24 bonding basins B4K (0.015 × 24 = 0.36) gives a total of 0.39 electron pairs shared with the nearest neighbours, i.e., ς = 0.17 electron pairs shares every core region CK with the rest of the solid. As is expected for a metal the delocalization of electrons with distant basins is
4.2. INSULATORS | 57
Figure 4.2.: NaF QTAIM and ELI-D basins. Left: QTAIM atomic basin for F (blue) and Na (yellow). Right: ELI-D core basins for F CF (blue, small) and Na CNa (blue, large). Bonding ELI-D basins BF(2) are shown in yellow. higher (κ(B4K ) = 0.64) than for crystals such as NaF (κ(BNaF ) = 0.14) or LiCl (κ(BLiCl ) = 0.20, Table 4.3) with ionic character.
4.2. Ionic solid: NaF and LiCl 4.2.1. NaF QTAIM The partition of space into atomic basins according to the QTAIM is shown in Fig. 4.2 (left). NaF is a typical ionic solid and consequently high localization of electrons λ(A) with values close to the QTAIM basins population is expected, as long as low variances σ 2 . In Table 4.1 can be seen that LI’s within Na and F basins λ(Na) = 10.12 and λ(F) = 9.48, respectively, are close to the respective populations N (Na) = 10.12 and N (F) = 9.87. Correspondingly low fluctuations (defined in Eq. 2.83) σ 2 are found in both cases, which can be compared with the bcc K case, with larger values as a metallic solid σ 2 (Na) = 0.25 and σ 2 (F) = 0.40 whereas σ 2 (K) = 0.80. Correspondingly, the distant shared electron pairs value is much higher for the metal bonding situation where the electrons are thought to be highly delocalized within the solid ς(K) = 0.88, whereas in a ionic solid the probability to find an electron far from its nucleus is very low ς(Na) = 0.02 and ς(F) = 0.03. In other words, in the ionic picture practically all the electrons (κ(Na) = κ(K) = 0.04 = 96%, Table 4.1) are shared with the closest neighbours which means that the probabil-
58 | APPLICATIONS Table 4.1.: Localization and delocalization indices for QTAIM basins. Compound bcc K NaF
A K F Na
N (A) 19.00 9.87 10.12
σ 2 (A) 0.80 0.40 0.25
λ(A) 18.20 9.48 9.87
ς(A) 0.88 0.03 0.02
κ(A) 0.55 0.04 0.04
LiCl
Cl Li
17.89 2.11
0.63 0.14
17.26 1.97
0.06 0.04
0.05 0.15
SnTe
Sn Te
49.32 52.66
1.62 1.90
47.70 50.76
0.62 0.86
0.19 0.23
A−B K-K F-Na Na-Na F-F Cl-Li Cl-Cl Li-Li Sn-Te Te-Te Sn-Sn
δ(A, B) 0.09 0.08 0.00 0.02 0.04 0.08 0.00 0.40 0.07 0.03
A: atom; N(A): atom A population within QTAIM basin; σ 2 (A): fluctuation; λ: localization index; ς(A): distant shared pair electrons; κ(A): fraction of the shared electrons delocalized whithin distant basins; δ(A, B): delocalization index between atomic basins A and B.
ity of finding an electron far from its nucleus almost vanishes when going beyond nearest basins. It is also important to note the shape of the interatomic surfaces between the F cores. As it can be seen in Fig. 4.2 (left) the F atomic basins instead of having sharp edges and spikes as the Na basins have them cut and forming a flat plane. It is the plane of direct contact between two atomic F basins, and since Na basins do not have direct contact with each other, higher delocalization is expected to occur between F basins in contact δ(F, F0 ) = 0.02, which is of the same order as the delocalization between Na and F basins and much higher than δ(Na, Na0 ) ≈ zero, Table 4.1. In the classical ionic picture, anions are thought to be large, distortable and susceptible to be polarized, unlike cations which are understood to be small, rigid and not susceptible to be polarized. In that sense, when taking part in an ionic bonding situation the cations adopt convex shape occupying the pace while the anions are concave and adopt themselves to the holes the cations leave free [11]. If Fig. 4.4 (left) is observed, it can be inmediately recognized by looking at the shape of each basin which one each atom corresponds to: the yellow basin has a convex-like shape whilst the blue adapts itself to the yellow one. The yellow bsin corresponds to the cation (Li+ ) and the blue one to the anion (Cl− ). In Fig. 4.2 this situation can be seen as well for the system NaF although it is not as clear as in case of the LiCl. The yellow basin (which corresponds to the cation Na+ ) is convex-like whilst the blue one (corresponding to the anion F− ) adapts its shape
4.2. INSULATORS | 59 Table 4.2.: Localization indices in ELI-D basins. Compound bcc K NaF
LiCl
Basin CK B4K CF CNa BF(2) S[6BF(2) ] CCl CLi BCl(3) S[6BCl(3) ]
N 18.10 0.15 2.16 10.06 1.28 7.78 10.07 2.03 1.31 7.90
σ2 0.28 0.14 0.39 0.23 0.81 0.77 0.58 0.10 0.85 1.19
λ 17.82 0.01 1.77 9.83 0.47 7.01 9.49 1.93 0.46 6.71
ς 0.17 0.18 0.01 0.39 0.23 0.03 0.01 0.07 0.34 0.07
κ 0.30 0.64 0.01 0.85 0.14 0.02 0.01 0.35 0.20 0.03
N: population within ELI-D basin; σ 2 : fluctuation; λ: localization index; ς: distant shared electron pairs for Basin; κ: fraction of the Basin’s shared electrons delocalized among distant basins.
to fill the space the surrounding cations leave free. The contact between basins corresponding to the same atom must be identical and consequently the contact surface has to be flat. That is clearly observed in the case that has just been discussed, where the surface at the contact between two blue Cl− basins is flat (Fig. 4.2), and in the LiCl for the Cl− interatomic surfaces (Fig. 4.4). In the case of bcc K, since only one atom is present all the contact surfaces must be planar. However in Fig. 4.1 a somewhat concave relief can be appreciated. That is caused by the algorithm to draw the surfaces, which also provoques the concentric rings that can be seen in all the drawings (cf. for example Fig. 4.2). ELI-D As explained for the bcc K ELI-D, when applied to free atoms, reflects the atomic shell structure in real space by means of basins that can be recursively merged together to form atomic core and bonding superbasins. For ionic compounds such as NaF, the ELI-D basins show both the atomic cores, which normally present low fluctuation values σ 2 (typically between 0.1 and 0.6) and the bonding basins surrounding the anion core, that correspond to the valence electrons. The core shell basins CF and CNa (blue basins in Fig. 4.2) are considered to be chemically inert, not contributing to bonding. They exhibit high localization and therefore low variances σ 2 (CF ) = 0.39 and σ 2 (CNa ) = 0.23, Table 4.2. DI values are consistently very low δ(CNa , CF ) = 0.002, Table 4.3, which is the same value found for the also ionic compound NaCl δ(CNa , CCl ) = 0.002 in [39].
60 | APPLICATIONS
Table 4.3.: Delocalization indices between nearest ELI-D basins. Compound bcc K
NaF
intra inter LiCl
intra inter
b1 CK CK B4K CNa CF CNa BNaF BNaF CCl CCl CLi BLiCl BLiCl
b2 CK B4K B4K CF BNaF BNaF BNaF BNaF CLi BLiCl BLiCl BLiCl BLiCl
δ(b1 , b2 ) 0.004 0.015 0.011 0.002 0.126 0.009 0.310 0.004 0.001 0.191 0.020 0.276 0.012
b1 : first ELI-D basin; b2 : second ELI-D basin; δ(b2 , b2 ): delocalization index between both basins.
Table 4.4.: Delocalization indices between nearest ELI-D core basins and valence superbasins. Compound NaF
LiCl
b1 CF CNa S[6BF(2) ] CCl CLi S[6BCl(3) ]
b2 S[6BF(2) ] S[6BF(2) ] S[6BF(2) ] S[6BCl(3) ] S[6BCl(3) ] S[6BCl(3) ]
δ(b1 , b2 ) 0.756 0.072 0.027 1.135 0.032 0.082
b1 : first ELI-D basin; b2 : second ELI-D basin; δ(b2 , b2 ): delocalization index between both basins; ς(b1 ): distant shared electron pairs; κ(b1 ): fraction of the shared electrons delocalized within distant basins.
4.2. INSULATORS | 61 The bonding volume in NaF is formed by 6 bonding basins BF(2) (yellow volumes in Fig. 4.2) where the subscript “F(2)” indicates that the basin is associated with the 2nd shell of the F. Each separed bonding basin has high fluctuation values σ 2 (F(2)) = 0.81, see Table 4.2. The sharing of electrons between basins belonging to the same valence basin set, as the two yellow basins drawn in Fig. 4.2, (row “intra” in Table 4.3) is higher than that between basins of different atoms (row “inter”), close to zero: δ(intra) = 0.310 and δ(inter) = 0.004, respectively. Thus the 6 basins completing the valence region of F form a basin set that can be merged together into a superbasin (left, light red basin in Fig. 4.4). The shape of the superbasin formed by merging together 6 basins surrounding a F atom resembles very closely the shape of the QTAIM basin for the same atom (compare right, blue basin in Fig. 4.2 and left, light red basin in Fig. 4.4). The LI and DI for the valence basins merged together into the superbasin S[6BF(2) ] are shown in Tables 4.2 and 4.4, respectively. Each superbasin shares δ(CF , S[6BF(2) ]) = 0.756 electron pairs with the F atom it includes and 6×0.072 = 0.432 with the 6 CNa basins is surrounded by (cf. Table 4.3). Additionally every superbasin shares 12 × δ(S[6BF(2) ], S[6BF(2) ]) = 12 × 0.027 = 0.324 electron pairs with the direct neighbouring basins. That makes a total of 1.512 electron pairs shared with the closest neighbourhood and thus, only ς(S[6BF(2) ]) = 2 × 0.72 − 1.512 = 0.03 (Table 4.2) electron pairs are shared with basins beyond the closest neighbourhood, i.e., a 2 % κ(S[6BF(2) ]) = 0.02 of the total number of shared electron pairs. The value of the distant shared pairs for the ELI-D valence basin set S[6BF(2) ] is exactly the same as the one for the F atomic core found in the QTAIM analysis ς(F) = 0.02 (Table 4.1), which further supports the fusion of the 6 valence basins into one single superbasin. Transferability assumes that a chemical property associated with an atom remains similar —though not identical— under a variety of different circumstances [49]. According to the free electron model for metallic crystals, the bcc K is understood to release an electron behaving as a cation K+ . When forming an ionic compound like for example KCl it behaves as a cation in the same sense as in the metal, while the Cl is the anion. Thus transferability makes us to expect the K atom to behave similarly in both situations. This has already been checked taking the fluctuation σ 2 of the Na atomic core within the ELI-D basins as the property that should be conserved, in the metallic situation bcc Na σ 2 = 0.20 almost identical as in the ionic compound NaCl σ 2 = 0.19 [39]. Although we have no ionic compound involving K, the Na atom in NaF is expected to closely mimic the K atom in bcc K. It is confirmed by analyzing the same property in both situations σ 2 (Na) = 0.23 in NaF and σ 2 (K) = 0.28 in bcc K where similar though somewhat different values are encountered.
62 | APPLICATIONS
Figure 4.3.: ELI-D core basins and valence superbasins. NaF (left): Na atomic core basin CNa (blue) and F superbasin S[6BF(2) ] (light red). LiCl (right): Li atomic core basin CLi and Cl superbasin S[6BCl(3) ] (light red).
4.2.2. LiCl QTAIM Being also an ionic solid, the LIs and DIs in LiCl can be compared with the results found for NaF. The localization of the electrons λ is again high with low fluctuations σ 2 (Cl) = 0.63 and σ 2 (Li) = 0.14 (see Table 4.1). The electron pairs shared with the basins beyond the first neighbourhood are very low as for NaF ς(Cl) = 0.06 and ς(Li) = 0.04 and as expected for an ionic bonding situation. The interatomic surface now between the Cl atoms where both atomic core basins touch each other gives DI values δ(Cl − Cl) = 0.08 even higher than that between Li and Cl atoms (see Table 4.3). Note also the flat hexagon-like surfaces formed at the contact plane between two different Cl atomic core basins (Fig. 4.3). ELI-D The ELI-D scheme is also similar as for NaF. The localization within the ELI-D core basins are high and correspondingly the fluctuation is low σ 2 (Cl) = 0.58 and σ 2 (Li) = 0.10 (Table 4.2). The delocalization between atomic cores δ(CCl , CLi ) = 0.001 is negligible as for the NaF case and NaCl in reference [39]. The bonding basin BCl(3) , where the subscript “Cl(3)” means asbefore that it is formed by the 3rd atomic shell of the Cl atom, shares electrons mainly with the Cl atomic core δ(CCl , BCl(3) ) = 0.191 electron pairs (cf. Table 4.3). The sharing of electron between bonding basins is done mainly within the same valence basin
4.2. INSULATORS | 63
Figure 4.4.: LiCl QTAIM and ELI-D basins. Left: QTAIM atomic basin for Cl (blue) and Li (yellow). Right: ELI-D core basins for Cl CCl (blue, small) and Li CLi (blue, large). Bonding ELI-D basins BCl(3) are shown in yellow and green set with DI δ(intra) = 0.276 one order of magnitude larger than that for basins belonging to different valence basin sets δ(inter) = 0.012. The fusion of the 6 bonding basins BCl(3) around a Cl core is now justified. As occurred in the NaF case the Cl core is surrounded by 6 bonding basins BCl(3) (Fig. 4.4) that when merged together into a single superbasin closely resemble the QTAIM basin for the same atom (compare left, blue basin in Fig. 4.4 and right, light red basin in Fig. 4.3). The equivalence between both QTAIM and ELI-D basins should be supported by similar fraction of shared distant pairs ς (see Eq. 2.86). Every superbasin shares electron pairs with the Cl atomic core it surrounds, with the 6 Li atomic cores is surrounded by as well as with the symmetry equivalent superbasins centered at each of the 12 Cl neighbouring atomic cores. In one line ς(S[6BCl(3) ]) = 2 × 1.19 − (1.135 + 6 × 0.032 + 12 × 0.082) = 0.07 (Table 4.2 and 4.4) which is very close to ς(Cl) = 0.06, hence supporting the close equivalence between the QTAIM Cl atomic basin and the ELI-D valence basin set. The shape of the basins carries information abou to what extent this basin is chemically active. ELI-D basins provide a deeper insight into the chemical bonding situation of the crystal than the QTAIM basins do. The more simple picture offered by QTAIM where only atomic basins are shown treats equally the chemically inert electrons and the electrons participating in the bond. The analysis of a two-particle quantity performed by ELI-D allows to differentiate between distinct behaviours of the electrons. The more spherical a basin is the lower its contribution to the formation of a
64 | APPLICATIONS
Figure 4.5.: SnTe QTAIM basins atomic basin for Sn (blue) and Te (yellow).
chemical bond. Consequently, atomic core basins are expected to have to a high extent an sphere-like shape; as can be seen in Fig. 4.1 (right), the blue core basin CK is almost a perfect sphere that includes the 1st and 2nd atomic shells of the K atom. The 3rd one is represented by the 24 bonding basins B4K of which only two (green and yellow) are shown (see Fig. 4.1, right). In the cases of NaF and LiCl, the atoms mostly participating in bonding are F and Cl, respectively and their valence electrons are already forming part of the bonding ELI-D basins. The atomic core basin is only including the inner electrons that are not contributing to the bond and consequently the F and Cl atomic cores are prectially spheres (see the right part of Figs. 4.2 and 4.4, respectively). The atomic basins of the atoms acting as cations: Na and Li, are not so spherical as the aforementioned since although no bonding basin correspond to them, a certain contribution to the bond exists. QTAIM atomic basins are even less spherical shaped than ELI-D ones for the Na and Li atoms. QTAIM analysis is less precise than ELI-D and each basin delimitates what is thought to be an atom, including both core and valence electrons. The higher contribution of the donor atoms (F and Cl) is seen by the very low sphericity of their corresponding basins (blue basins in the left part of Figs. 4.2 and 4.4, respectively). The basin for Na and Li (yellow ones in the same figures) resemble more a sphere and are alike the equivalent ELI-D core basins (blue, large in the right part).
4.3. SEMICONDUCTORS | 65
4.3. Semiconductors: SnTe QTAIM Characteristic of metals is a high delocalization of the valence electrons since they are free to travel far away across the solid. In other words, the probability of finding an electron far from the nucleus it belongs to is very high. On the contrary, insulators are thought to have very localized electrons which are strongly linked to their nucleus and are not free to separate far from it, i.e., it is not expected to find a electron delocalized beyond the closest neighbourhood from its nucleus. Accordingly the distant shared pairs indicator ς(A) (Eq. 2.86) and the fraction of electrons shared with basins located beyond the nearest ones κ(A) (Eq. 2.87) are expected to be high for bcc K as a metal and low for NaF and LiCl as insulators. ς(K) = 0.88 of the total shared pairs which means that a 55 % κ(K) = 0.55 are shared with distant neighbours, that is over half of the shared electrons are dispersed across the solid (see Table 4.1). For the insulators the distant shared pairs values are one order of magnitude lower ς(N a) = 0.02 and ς(Li) = 0.04, with only a 4 % and 15 %, respectively, of the shared electrons delocalized far from their respective nucleus (Table 4.1). As semiconductor SnTe is thought to occupy an intermediate position between bcc K and the ionic NaF and LiCl with a somewhat large distant delocalization but always below the metal value. As expected ς(K) = 0.88 > ς(Sn) = 0.62 > ς(N a) = 0.02 ≈ ς(Li) = 0.04. A 19 % of the shared electrons can move away from their nucleus and be found delocalized among the solid. The shape of the basins for SnTe follows again the rule mentioned above: the cations are rigid and as so occupy the space adquiring a convex shape (blue Sn basin in 4.5). On the contrary, the anions are distortable and behave fully occupying the free space left by the cations being concave (yellow Te basin in 4.5). QTAIM LI and DI are shown in Table 4.1. The occupation number is now much higher than for the other systems considered here, which causes a higher fluctuation to occur σ 2 (Sn) = 1.62 and σ 2 (T e) = 1.90, which are around twice the fluctuation of the metal and four times that of the insulators. Each Sn atomic basin has a high DI value sharing 6 × 0.40 = 2.4 electrons with the nearest Te basins. But it is also important the DI between identical basins somewhat more distant δ(Sn − Sn) = 0.03 and δ(T e − T e) = 0.07. Effect of the number of k-points in the ELI-D field Due to the very demanding computational effort that entails the SnTe calculation with respect to the number of k-points, this parameter was reduced in small steps in order to get a fast enough though not very accurate performance. That allowed us to draw a representation of how the ELI-D field loses features as the
66 | APPLICATIONS Brillouin Zone is progresively more coarse-grained sampled. In Fig. 4.6 can be seen that reducing the number of sampling points makes it impossible to solve the particularities that are contained between the k-points. There are features as the discs between second neighbour atoms in Fig. 4.6a that become smaller (Fig. 4.6b) until they fade away for k-points = 2 in Fig. 4.6c.
4.3. SEMICONDUCTORS | 67
(a) k-points = 6
(b) k-points = 3
(c) k-points = 3
Figure 4.6.: ELI-D isosurfaces for ΥD = 1.23 using 6, 3 and 2 k-points, respectively. Note how the features lose complexity when lowering the accuracy of the calculation.
68 | APPLICATIONS
4.4. Topology of the electron density for bcc K, LiCl and SnTe According to what was explained in section 2.3 the critical points (CP) of the electron density ρ defined within the QTAIM [3] have been analysed for bcc K, LiCl and SnTe. The CPs have been grouped according to the Wyckoff position they occupy and the points not determined by symmetry have been specified. Also the electron density ρ and the laplacian of the electron density ∇2 ρ are given. CPs of bcc K, whose symmetry is Im¯3m can be seen in Table 4.5 whilst those for LiCl and SnTe, symmetry F m¯3m are in Table 4.6. The translational invariant crystals are topologically equivalent to S 3 , the 3torus, and consequently all topological schemes must satisfy Morse invariant relationships [50], [51]: n − b + r − c = 0,
(4.1)
and n ≥ 1,
b ≥ 3,
r ≥ 3,
c ≥ 1,
(4.2)
where n is the total number of nuclei —or maxima or attractors— in the unit cell, b the number of bonds, r the number of rings and c the number of cages or minima. We consider also the number of symmetrically different nuclei in the unit cell τn and similarly τb , τr and τc for bond, ring and cage CPs. This information is given in the vector form τ = (τn , τb , τr , τc ): τ = τn + τb + τr + τc . The traditional classification of the different types of chemical bond in solids into Covalent, Ionic and Metallic can be quantitatively done by means of an topological analysis of the electron density [52]. Ionic crystals are divided into basins containing a substantial net charge close to the nominal oxidation state and exhibiting small electron density ρb and positive laplacian ∇2 ρb at the bond CPs (BCP). Positive laplacian corresponds to regions of charge depletion which occurs in the ionic picture where linkage is due to closed-shell charge-depletion interactions. Negative laplacian indicates regions of local charge accumulation. Accordingly covalent solids have large electron density values at the BCP and negative density laplacian. The trird type of chemical bond, the metallic solids show valence electrons scattered throughout the solid yielding very low values of both ρb and ∇2 ρb .
4.4. TOPOLOGY OF ρ | 69
Table 4.5.: Topological scheme of the CP’s of the electronic density for K bcc. The space group is Im¯3m. The type of CP is listed as n: nuclei, c: cage, b: bond and r: ring. Electron density ρ[=]electron bohr−3 and ∇2 ρ values at each point are written in the last two columns. Wyckoff
Symmetry
Position
K bcc
ρ
∇2 ρ
2a
m¯3m
(0, 0, 0)
n: K
6059.902
-
6b
4/mm.m
(0, 1/2, 1/2)
c
0.0025
0.0002
8c
.¯3m
(1/4, 1/4, 1/4)
b
0.0025
0.0006
12d
¯4m.2
(1/4, 0, 1/2)
r
0.0023
0.0001
(τn , τb , τr , τc ) index
(1,1,1,1)
Number of critical points (τ )
4
M
1
K
0.8
f
0.6
0.4 LiCl
0.2 SnTe
0 0 C
0.2
0.4
0.6 c
0.8
1 I
Figure 4.7.: Flatness Vs. charge-transfer diagram for bcc K, LiCl and SnTe as metallic, ionic and covalent crystals, respectively.
(0,0,0) (1/2,1/2,1/2) (1/4,1/4,1/4)
m¯3m m¯3m ¯43m m.mm 4m.m m.m2
4a
4b
8c
24d
24e
48h (2,2,1,1) 6
Number of critical points (τ )
r: (1.393)
b: (1.660)
b
c
n: Cl
n: Li
LiCl
(τn , τb , τr , τc ) index
(0,y,y)
(x,0,0)
(0,1/4,1/4)
Position
Symmetry
Wyckoff
0.007
0.012
0.009
0.004
4.702E3
13.548
ρ
0.023
0.049
0.022
0.011
-
-
∇2 ρ
5
(2,1,1,1)
b: (2.816)
r
c
n: Te
n: Sn
SnTe
0.031
0.008
0.003
7.079E5
5.416E5
ρ
0.025
0.014
0.006
-
-
∇2 ρ
Table 4.6.: Topological scheme of the CP’s of the electronic density of LiCl and SnTe. The space group is F m¯3m. Float numbers in parenthesis represent the x, y and z coordinates not fixed by symmetry. The type of CP is designated according to n: nuclei (3, −3), c: cage (3, +3), b: bond (3, −1) and r: ring (3, +1). Electron density ρ[=]electron bohr−3 and ∇2 ρ values at each point are written in the last column.
70 | APPLICATIONS
4.4. TOPOLOGY OF ρ | 71 Ionic compounds such as LiCl present low electron density ρb (LiCl) = 0.012 at the BCP and positive density laplacian ∇2 ρb (LiCl) = 0.049 (Table 4.6. In the polar case of SnTe the density is larger ρb (SnTe) = 0.031 as but although the density laplacian is also positive (Table 4.6). On the contrary the metallic solid bcc K has very low density values ρb (K) = 0.0025 and very low values of the density laplacian ∇2 ρb (K) = 0.006 (Table 4.5). The metallic character of bcc K is also confirmed by the value of the density that has a constant value no matter the CP where it has been evaluated. An over 50 year-old chemical bond classification method was proposed by van Arkel and Ketelaar [53], [54]. It is known as the van Arkel-Ketelaar diagram (VK) and has been shown to be recovered from the electron density without explicitly reference to any empirical scales [52]. It is a covalent-ionic-metallic triangular diagram that allows a classification of the chemical bond into the traditional types. The covalence-ionicity of the AB compound is given by the difference in electronegativity |χA − χB |. On the other hand, the metallicity-covalency character is given by the average (χA + χB )/2. The ρ-based way of constructing this triangle is defined in [52] from the flatness f and charge transfer c indices. Characteristic of metallic systems is a flat electron density defined as f=
ρmin c , ρmax b
(4.3)
is the absolute minimum of the electron density at a cage CP and where ρmin c max ρb is the absolute maximum of the electron density at a bond CP. This index allows the separation between metals (f ≈ 1) and nonmetals (f ≈ 0) by exploiting the idea that the relevant part of the valence electron density starts at the highest BCP and finishes at the lowest density cage critical point. The other coordinate is defined according to a charge transfer scale calculated as * + N L(Ω) 1 X L(Ω) = . (4.4) c= N Ω OS(Ω) OS(Ω) That expression is an averaged of the ratios between the topological charge L(Ω) and the nominal oxidation state OS(Ω) for every basin Ω which measures how much this basin deviates from the ideal ionic model. The VK triangle defined plotting the charge-transfer against the flatness is shown for our systems in Fig. 4.7. The labels of the corners indicate where ideal covalent (C) and ionic (I) crystals are situated, while (M) indicates that the upper part of the figure is occupied by metals. The semiconductor SnTe is close to the covalent corner while LiCl approximates the ionic one. The mentioned nature of
72 | APPLICATIONS the chemical bond in crystals is hence confirmed and the usefulness of the VK-like triangle to determine it.
5. Conclusiones El objetivo de este trabajo ha sido tomar contacto con algunas t´ecnicas novedosas para estudiar el enlace qu´ımico en el espacio real. Las conclusiones m´as relevantes son: 1. La conclusi´on fundamental que podemos extraer de este trabajo tiene relaci´on con el Indicador de Localizabilidad Electr´onica ELI-D. Esta funci´on supone una alternativa a la ya cl´asica ELF y como ´esta permite la resoluci´on de la estructura de capas at´omicas de las especies que se encuentran formando un sistema qu´ımico. A partir de esta funci´on, construida a partir de la densidad de parejas electr´onicas, se puede hacer una una partici´on m´as fina del espacio de la hecha de acuerdo a la QTAIM, basada en la densidad electr´onica. Mientras que la divisi´on del espacio seg´ un QTAIM resulta en cuencas que se hacen corresponder con a´tomos —exceptuando el caso de m´aximos no nucleares—, la funci´on ELI-D permite partir el volumen ocupado por el sistema en regiones llamadas “dominios de localizaci´on” (localization domains), que se interpretan como correspondientes con regiones de enlace, n´ ucleos at´omicos y pares solitarios. De esta manera, mientras que QTAIM nos permite visualizar la u ´nidad at´omica, concepto que sirve de sustento a la qu´ımica, creando cuencas que ocupan todo el espacio y se hacen corresponder con los n´ ucleos at´omicos, ELI-D nos permite ir m´as all´a y partir el dominio at´omico en una parte qu´ımicamente inerte —n´ ucleos at´omicos—, una activa que interviene en el enlace —regi´on de valencia— y en caso de existir un volumen de pares solitarios. Es importante destacar que a esta partici´on no se le ha encontrado a´ un significado f´ısico alguno, est´a en cambio motivada por analog´ıa con la realizada de acuerdo con la QTAIM. 2. Los ´ındices de localizaci´on y deslocalizaci´on son herramientas ya establecidas que permiten una caracterizaci´on cuantitativa del enlace qu´ımico. Su evaluaci´on dentro de las cuencas en que, de acuerdo con ELI-D, fue dividido el espacio proporciona informaci´on sobre el tipo de enlace existente entre los a´tomos. As´ı, de acuerdo con la medida que los ´ındices proporcionan de c´omo de localizados est´an los electrones en cada cuenca, podremos clasificar la regi´on de enlace como correspondiente a un enlace covalente, un enlace i´onico o uno met´alico. Los sistemas escogidos: bcc K, NaF, LiCl y SnTe intentan ofrecer un ejemplo de cada uno de los mencionados tipos de enlace
73
74 | CONCLUSIONES y sirven a su vez como otra demostraci´on m´as de lo oportuno de aplicar ya bien QTAIM como ELI-D a sistemas en fase condensada. 3. La disponibilidad de ´ındices de localizaci´on o deslocalizaci´on en s´olidos abre v´ıas interesantes de an´alisis que hasta ahora han permanecido cerrados. Como hemos mostrado en sistemas modelo, los valores obtenidos son consistentes con la intuici´on. Pretendemos proseguir con este estudio en el futuro.
6. Bibliography [1] M. Kohout, “DGrid 4.6,” (Radebeul, 2012). [2] P. Hohenberg and W. Kohn, Physical Review 136, B864 (1964). [3] R. Bader, Atoms in Molecules: A Quantum Theory, International Series of Monographs on Chemistry (Clarendon Press, 1994). [4] R. Daudel, H. Brion, and S. Odiot, The Journal of Chemical Physics 23, 2080 (1955). [5] R. Daudel, The fundamentals of theoretical chemistry: wave mechanics applied to the study of atoms and molecules (Pergamon, 1968). [6] R. Bader and M. Stephens, Journal of the American Chemical Society 97, 7391 (1975). [7] J. Lennard-Jones, Proceedings of the Royal Society of London. Series A. Mathematical and Physical Sciences 198, 14 (1949). [8] M. Kohout, International journal of quantum chemistry 97, 651 (2004). [9] M. Kohout, F. Wagner, and Y. Grin, International journal of quantum chemistry 106, 1499 (2006). [10] M. Kohout, Faraday Discuss. 135, 43 (2006). [11] A. Pend´as, A. Costales, and V. Lua˜ na, Physical Review B 55, 4275 (1997). [12] V. Lua˜ na, A. Costales, and A. Pend´as, Physical Review B 55, 4285 (1997). [13] A. Pend´as, A. Costales, and V. Lua˜ na, The Journal of Physical Chemistry B 102, 6937 (1998). [14] A. Baranov and M. Kohout, Journal of Physics and Chemistry of Solids 71, 1350 (2010). [15] A. Baranov and M. Kohout, Journal of Computational Chemistry 29, 2161 (2008). [16] “Elk 1.4.18,” (2012).
75
76 | BIBLIOGRAPHY [17] A. Szabo and N. Ostlund, Modern quantum chemistry: introduction to advanced electronic structure theory (Dover Pubns, 1996). [18] W. Koch and M. Holthausen, A chemist’s guide to density functional theory, Vol. 2 (Wiley Online Library, 2001). [19] L. Piela, Ideas of quantum chemistry (Elsevier Science, 2006). [20] D. Griffiths and E. Harris, Introduction to quantum mechanics, Vol. 2 (Prentice Hall, 1995). [21] C. Cohen-Tannoudji, B. Diu, and F. Lalo¨e, Quantum mechanics. (M´ecanique quantique). Vol. 1-2., Quantum Mechanics (Wiley, 1977). [22] W. Kohn and L. Sham, Phys. Rev 140, A1133 (1965). [23] S. Cottenier, Density Functional Theory and the family of (L) APW-methods: a step-by-step introduction (to be found at http://www.wien2k.at/reg user/textbooks, (Instituut Voor Kern-en Stralingsfysica, KU Leuven, Belgium), 2004). [24] K. Burke, the ABC of DFT (Rutgers University, 2007). [25] H. Eschrig, The Fundamentals of Density Functional Theory (revised and extended version), Vol. 9 (Edition am Gutenbergplatz, Leipzig, Germany, 2003). [26] R. McWeeny and B. Sutcliffe, Methods of molecular quantum mechanics, Vol. 2 (Academic Press London, 1969). [27] R. Bader, Chemical Reviews 91, 893 (1991). [28] A. Pend´as, M. Blanco, A. Costales, P. S´anchez, and V. Lua˜ na, Physical review letters 83, 1930 (1999). [29] A. Pend´as, M. Kohout, M. Blanco, and E. Francisco, in Modern ChargeDensity Analysis, edited by C. Gatti and P. Macchi (Springer Verlag, 2012) pp. 303–782. [30] J. Dobson, Journal of Chemical Physics 94, 4328 (1991). [31] R. Gillespie, Molecular geometry (Van Nostrand Reinhold London, 1972). [32] B. Silvi and A. Savin, Nature 371, 683 (1994). [33] A. Becke and K. Edgecombe, Journal of Chemical Physics 92, 5397 (1990). [34] R. Bader and M. Stephens, Chemical Physics Letters 26, 445 (1974).
| 77 [35] R. Bader, A. Streitwieser, A. Neuhaus, K. Laidig, and P. Speers, Journal of the American Chemical Society 118, 4959 (1996). [36] X. Fradera, J. Poater, M. Duran, and M. Sol`a, Chemistry-a European Journal 9, 400 (2003). [37] X. Fradera, J. Poater, S. Simon, M. Duran, and M. Sola, Theoretical Chemistry Accounts: Theory, Computation, and Modeling (Theoretica Chimica Acta) 108, 214 (2002). [38] X. Fradera, M. Austen, and R. Bader, The Journal of Physical Chemistry A 103, 304 (1999). [39] A. Baranov and M. Kohout, J. of Comput. Chem. 32, 2064 (2011). [40] J. Angyan, M. Loos, and I. Mayer, The Journal of Physical Chemistry 98, 5244 (1994). [41] R. Ponec, Theoretical Chemistry Accounts: Theory, Computation, and Modeling (Theoretica Chimica Acta) 114, 208 (2005). [42] C. Ambrosch-Draxl, Physica Scripta T109, 48 (2004). [43] J. Slater, Physical Review 51, 846 (1937). [44] O. Andersen, Physical Review B 12, 3060 (1975). [45] D. Koelling and G. Arbman, Journal of Physics F: Metal Physics 5, 2041 (1975). [46] D. Singh, Physical Review B 43, 6388 (1991). [47] E. Sj¨ostedt, L. Nordstr¨om, and D. Singh, Solid State Communications 114, 15 (2000). [48] “Paraview: a parallel visualization application,” Sandia National Labs and Kitware Inc. and Los Alamos National Labs. (2000-2008), version 1.14.1. [49] A. McNaught, A. Wilkinson, I. U. of Pure, and A. Chemistry, IUPAC Compendium of Chemical Terminology (Blackwell Scientific Publications, Oxford, 1997). [50] M. Morse and S. Cairns, Critical point theory in global analysis and differential topology: An introduction, Vol. 33 (Academic Press, 1969). [51] W. Jones and N. March, Theoretical solid state physics: Perfect lattices in equilibrium, Vol. 1 (Dover Pubns, 1985).
78 | BIBLIOGRAPHY [52] P. Mori-S´anchez, A. Pend´as, and V. Lua˜ na, Journal of the American Chemical Society 124, 14721 (2002). [53] A. Arkel, Interscience, New York (1956). [54] J. Ketelaar, Chemical constitution: an introduction to the theory of the chemical bond (Elsevier, 1953).
A. DGrid input files We will shortly describe here how to use the software DGrid 4.6 to obtain a field of a chosen property —as the electron density— from a single point solid state calculation with the Elk code. Using the property file further analysis can be done: - space partitioning according to the chosen property - evaluation of overlap integrals which Localization (LI) and Delocalization Indices (DI) can be obtained from - topological analysis of the property, i.e., search for critical points Starting from the solid state calculation results, the process can be regarded as be formed by a few steps that must be consecutevely executed. Each of the following Sections stands for a calculation that is dependent of the preceeding ones and will be needed for further evaluations. They must hence be executed in the order given here. Within a Section some subsections can be found that are at the same level and consequently can be independently calculated. LiCl F m¯3m will be used as an example. Note that only explanations in relation to the transcribed inputs are given. For a further detailed description the reader is referred to the user’s guide, which can be downloaded from [1].
A.1. PREVIOUS STEP: Elk output transformation DGrid 4.6 [1] is a software that computes properties for solid state systems on a 3-dimensional grid from the data from the full potentail solid state code Elk [16]. Before we start any DGrid solid state calculation we must generate the file containing the information needed from the Elk calculation for a property evaluation. DGrid has to be run in the same folder where the Elk output files are located and the Elk input file will be given as DGrid input: dgrid elk.in licl.mte A resulting .mte file is constructed.
i
ii | DGRID INPUT FILES
A.2. STEP 1: Property file The first step will consist in the construction a 3-dimensional grid with a value of the chosen property at every grid point. Not only one but many properties can be evaluated at the same time. The DGrid input file is as follows: :TITLE :------------------------------------------------| ::LiCl elk default :------------------------------------------------| :KEYWORDS :------------------------------------------------basis=licl.mte output=. :CHOOSE THE DESIRED PROPERTIES :------------------------------------------------compute=rho compute=ELI-D alpha-alpha :------------------------------------------------GRID_DEFINITION: vectors : X Y Z :-----------------------------origin: 0.0 0.0 0.0 : INTERVALS :---------------------------------------------i-vector: 4.8467 0.0 0.0 97 j-vector: 0.0 4.8467 0.0 97 k-vector: 0.0 0.0 4.8467 97 END The input consists of various parts: TITLE consists of a comment of the calculation that will be done. With elk default we make clear that we have used the basis set given in Elk by default. KEYWORDS is the part where we give DGrid instructions of how do work. basis will always be a name.mte file for solid state calculations. output defines where do we want to save the output. A dot indicates it will use the embedded pattern to create the name of the file (see below).
A.3. STEP 2: SPACE PARTITIONING | iii PROPERTIES is where we give DGrid the properties we want. In our case only the electron density and the ELI-D for same up-spin. Consult the manual for more details. GRID DEFINITION since we are facing a solid state calculation, the volume where we want to perform the calculation has to be specified. First we define a origin which is the reference point from where the i, j and k vectors are defined. On the interest of time, only 1/8 of the LiCl unit cell is evaluated (cell = 9.6934 a. u.), which afterwards will be mirrored to get the whole cell. In the INTERVALS column we define how fine do we want the grid to be. Here each grid point will be at 0.05 bohr from the following one. input file: “1 licl dg.inp” output file: “licl.mte.dg” containing information about the calculation: timing, atom positions. . . property file: “licl.mte.rho r” and “licl.mte.elid r a aa” containing the result —electron density and ELI-D grid, respectively—. Whole unit cell formation In order to recover the whole unit cell from the 1/8th calculated, DGrid has a utility that mirrors the data along each of the axis. Since the mirroring operation is a really fast process a lot of computational time is saved. The operation is invoked by: dgrid licl.mte.rho r op1 Once the interactive dialog is opened the mirror in will do the mirroring along the i direction. The n just specifies that the mirroring is done from the end of the small cell, unlike mirror i that makes the operation to be done from the begining.
A.3. STEP 2: Space partitioning From the files containing a grid with the electron density and ELI-D for LiCl a partition of the space in basins can be performed. DGrid input is as follows: :TITLE :-----------------------------------------------------------| :: LiCl ELI-D alpha-alpha basins :-----------------------------------------------------------| :KEYWORDS :-----------------------------------------------------------property =licl.mte.elid_r_a_aa
iv | DGRID INPUT FILES integrate=licl.mte.rho_r output=. top=1.5 eli_core symmetry=translation i j k END This input file tells DGrid to search for basins according to the property keyword and integrates integrate within them. For the input to calculate the QTAIM basins the same density .rho r file is given in both keywords. top is a variable which permits the control of how many basins are created. A good description of how this keyword works is given in the user’s guide which can be downloaded from the program web site free of charge [1]. To decide at which value basins corresponding to irreducible domains are drawn it is recomended to have a look at isosurfaces of the property. With the visualization software ParaView [48] it can be seen for what ELI-D value the localization domains can not further bifurcate. eli core is a keyword that avoids the formation of numerous basins close to the nucleus. Up to a internally defined radius all basins are assigned to the atomic core basin. symmetry is another variable indicating that the system is symmetrical in the three dimensions. It tells DGrid to automatically assign symmetrically equivalent basins to the same one. input file: “2 bas licl elidaa.inp” output file: “licl.mte.elid r a aa.bas” property file: “licl.mte.elid r a aa.bsn” The respective files are created for the remaining calculated properties.
A.4. STEP 3 A.4.1. Overlap integrals evaluation Once the basins have been created, the overlap integrals within each of them can be evaluated and the LI and DI calculated.
A.4. STEP 3 | v :TITLE :-----------------------------------------------------------| :: LiCl overlap over ELI-D basins :-----------------------------------------------------------| :KEYWORDS :------------------------------------------------------------property=licl.mte.elid_r_a_aa.bsn integrate=licl.mte.rho_r output=. overlap symmetry=translation i :basin_mte = 8 80.0
j
k
END Similarly as in the previous step, the integrate keyword tells DGrid what whould be integrated within each basin of the while the determined by the keyword property: ELI-D basins in this example. The corresponding .rho r.bsn file would be introduced for LI and DI over Bader basins. overlap is the keyword indicating the code it must calculate overlap integrals using the above files. basin mte default values are 30 and 50.0. First value controls the expansion size of the multipole whilst the second regulates the Fourier expansions of the basin shape. Note it is commented out here by the colon. input file: “3 ovl licl elidaa.inp” output file: “licl.mte.elid r a aa.ovl” where the “pair density analysis” section includes LI and DI. property file: “licl.mte.elid r a aa.sij” containing the overlap integrals.
A.4.2. Critical points search Once the basins were found a topological analysis of the property can be performed. It consists of a search for critical points of the field according to the rank and signature of the hessian for the considered property. According to that attractors, repellors and saddle points can be found. :TITLE :-----------------------------------------------------------|
vi | DGRID INPUT FILES :: LiCl ELI-D topology :-----------------------------------------------------------| :KEYWORDS :-----------------------------------------------------------property =licl.mte.elid_r_a_aa.bsn output=. eli_core topology :icl_graph=full END topology is the keyword that we need to specify the program in order to perform a topological analysis of the ELI-D basins. icl graph tells the program to find the interconnection paths between all the critical points searched. However only a particular type of CP can be interconnected, as for example the saddle points or the bond points. The resulting paths can be visualized with ParaView.