Concept Article pubs.acs.org/OPRD
The Eight Criteria Defining a Good Chemical Manufacturing Process Rolf Dach,*,† Jinhua J. Song,‡ Frank Roschangar,*,‡ Wendelin Samstag,† and Chris H. Senanayake‡ †
Department of Process Development Chemicals, Boehringer Ingelheim Pharma GmbH & Co. KG, Binger Straße 173, 55216 Ingelheim am Rhein, Germany ‡ Department of Chemical Development US, Boehringer Ingelheim Pharmaceuticals, Inc., 900 Ridgebury Road/P.O. Box 368, Ridgefield, Connecticut 06877, United States ABSTRACT: As pharmaceutical API projects advance from Development to Chemical Production, the primary objective of the Process Research and Development (R&D) chemists is a smooth transfer of a well-developed, safe, scalable, robust, and economical chemical process to their customers in Chemical Production. Since the definition of a Good Chemical Manufacturing Process differs widely amongst different departments and companies, we herein summarize eight useful process evaluation criteria, and then demonstrate our deployment according to the guiding principle “if it can be measured, then it can also be managed”, with the aim to offer chemists a helpful toolbox to effectively compare competing API synthesis routes.
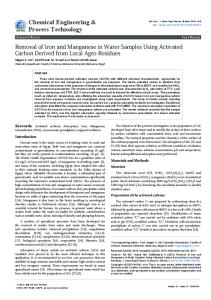
1. INTRODUCTION Despite commonly considered recession-proof, large pharmaceutical companies have been adversely affected by the recent global slowdown. A launch of a new drug of an innovative active pharmaceutical ingredient (API) requires considerable investments. Global Research and Development (R&D) expenditures of research-based pharmaceutical companies have dramatically risen 10-fold over 25 years, from $4.1 billion in 1985 to $45.8 billion in 2009, and now constitute ∼16% of total sales.1a At Boehringer Ingelheim, pharma R&D spend accounted for $2.9 billion in 2009 and is projected to reach $3.2 billion by 2016, which represents ∼22% of prescription medicine sales. The historical average pharmaceutical R&D spend per FDA submission of new molecular entities (NMEs),2 which was discussed in detail by DiMasi and Paul,3 has gradually increased from $0.3 billion in 1995 to $1.3 billion in 2009, while the number of annual pharmaceutical new molecular entity (NME) submissions have decreased,1b as is illustrated in Figure 1. On top of the unfavorable divergence of pharma R&D spend and NME submissions, manufacturing costs have risen by ∼20% over the past 10 years.4 Consequently, in order to remain competitive and thrive, pharma companies are aiming to reduce manufacturing costs through innovative approaches related to cost structures and workflows in Process R&D and Chemical Production. In this context, strategic and tactical outsourcing has been utilized to leverage internal and external capacities, while improving overall efficiencies and economics by externally procuring key raw materials, intermediates, and even the final APIs. Furthermore, deliberate incorporation of niche suppliers utilizing specialized technologies such as biocatalysis, flow chemistry, and pressure reactions can lead to environmental and economic advantages.5 For Chemical Manufacturing, the pharmaceutical industry has been moving away from its traditional model, which is to retain spare capacity and inventory in order to ensure that timelines of new orders are never missed. Organizations must now be able to produce products and documentation that are “right the first time” and delivered on time with leaner © 2012 American Chemical Society
Figure 1. Divergence of Pharma R&D spend and NME submissions.
workforces.6 This requires that manufacturing facilities have the solutions they need to enable continuous process understanding and improvement. Additional activities include improving the efficiency of knowledge transfer between a company’s R&D and manufacturing units, with an increasing focus on process analytical technologies (PAT), quality by design (QbD) initiatives,7 and driving a culture of design for manufacturability (DFM)8 into API development workflows. Greater flexibility for process design and development typically resides within Process R&D, and companies are aiming to accelerate API development by designing more robust, viable, and cost-effective manufacturing processes in early development with the goal to transfer these to manufacturing operations effectively and efficiently with minimal changes. Due to the high project attrition rate in early development, however, these optimization efforts are typically balanced in Received: June 1, 2012 Published: October 15, 2012 1697
dx.doi.org/10.1021/op300144g | Org. Process Res. Dev. 2012, 16, 1697−1706
Organic Process Research & Development
Concept Article
Figure 2. Typical drug substance development activity interfaces of the chemistry divisions. SoPD = start of preclinical development; SoD = start of development; LO = lead optimization; PAI = pre-approval inspection.
Figure 3. The two pillars of API product cost.
order to avoid unnecessary ‘frontloading’. In order to achieve this goal, it is important that Process R&D chemists have a culture and awareness of the underlying principles of a “Good Chemical Manufacturing Process”, eight of which are explained in detail below.
(Process R&D) for kilogram-scale synthesis, where speed, safety, quality control, and economics become important parameters. At this point, several disciplines, including Process Chemistry, Analytical Chemistry, Technical Outsourcing, Process Engineering, and Safety, Regulatory Compliance, and scale-up groups such as Kilolab and Pilot Plant are essential for the design and development of an economical and scalable route. The API development and supply chain at Boehringer Ingelheim consists of three major chemistry units: Chemical Development, Process Development, and Chemical Production (Figure 2). The aim of Process R&D chemists in Chemical Development is to secure the first supplies of API for toxicological studies, pharmaceutical purposes, and the initial clinical supplies, while defining a route of synthesis that is scalable, safe, robust, and economical and that guarantees the freedom to operate (FTO). During late phase I or early phase II, the project transfers from Chemical Development to Process Development, which evaluates the scalability and further optimizes the transferred process, or even develops a new process if required, and then validates and transfers the process to Chemical Production during phase III. Chemical Production
2. CHEMICAL SYNTHESIS EVOLUTION DURING API DEVELOPMENT A New Chemical Entity (NCE) is first synthesized by Medicinal Chemists in the Discovery division. The initial scale-up synthetic route is designed to provide the NCE rapidly in small quantities to support initial toxicological evaluations and typically does not represent the most efficient route to the NCE. Consequently, a Medicinal Chemistry route cannot be scaled up to kilogram quantities without modifications. However, comparing a Medicinal Chemistry route of synthesis with a commercial process is not meaningful because different goals are driving the route selection decisions. After an NCE meets predefined biological and physicochemical criteria, the compound is selected for continued development, and the project is transferred to Chemical Development 1698
dx.doi.org/10.1021/op300144g | Org. Process Res. Dev. 2012, 16, 1697−1706
Organic Process Research & Development
Concept Article
reflected in the material cost itself. The selection of an economical raw material strategy is critical for synthetic route design, and Process R&D programs at Boehringer Ingelheim are guided by the economical material cost analysis of potential routes. When a new synthetic route is proposed by the process R&D chemists, a cost analysis is carried out in consideration of a long-term outsourcing strategy, to estimate the potential cost savings compared to the existing route. The cost analysis will also identify the cost drivers, or top cost materials, for a particular route and aid the chemists to focus their efforts on optimizing the synthetic cost drivers. The material costs depend on the availability of raw materials, the level of outsourcing for intermediates, and the required quantities. API structure-forming materials can be divided into three categories: (1) Intermediate: the chemical compound is proprietary to Boehringer Ingelheim and is produced according to an internal technology package consisting of a chemical procedure and analytical specifications by selected custom manufacturing companies. In the early development phases the unit cost for such custom-made intermediates is normally high. (2) Raw material: the chemical is readily available from several commercial suppliers on 10− 1000 kg scale and the specifications and method of synthesis may be adapted to those of the suppliers. In general, these raw materials are more economical than the custom-synthesized intermediates. In cases where the raw materials are utilized in the regulated (or current good manufacturing practice, cGMP) segment of the API synthesis, close attention must be given to the QA-EHS qualification process of the raw material suppliers.10 (3) Commodity chemical: this is the best case in terms of economics. One example is dimethyl carbonate which has an annual manufacturing volume of more than 100,000 tons produced by a variety of established industrial suppliers. As in the case of raw materials, issues could arise for regulated steps in terms of cGMP requirements since it is unlikely that commodity suppliers, due to cost pressures associated with low margin commodities, will incorporate the cGMP expectations of pharmaceutical companies.
supports large-scale manufacturing activities, conducts transfer batches in order to demonstrate the optimized chemical procedure from Process Development, runs primary stability batches for drug substance, performs validation batches, and provides market supplies after product launch. Due to the handovers between the involved chemistry units, a complex picture in terms of route design and selection arises. Comparing different routes of synthesis is challenging due to the diverse viewpoints and different business drivers of the three chemistry units. In addition, elegance and efficiency in terms of molecular design are difficult to reduce to objective and measurable figures. However, it is understood that the quality of a manufacturing process will ultimately be measured by its financial impact on the business, i.e. the total production cost of the API. Manufacturing of an API typically involves a multistep chemical synthesis (10−15 steps or chemical transformations) utilizing external and internal multipurpose plants. The total API product cost comprises two major portions, the material cost and the conversion cost (including waste disposal; see eq 1 (the two components of API product cost) and Figure 3). API product cost = material cost + conversion cost
(1)
While the material cost constitutes a single category representing the expenses of all procured chemicals including raw materials and outsourced intermediates, the conversion cost is subcategorized into several readily quantifiable process efficiency and reproducibility criteria. The subsequent sections describe a scorecard matrix consisting of the eight key criteria that have been utilized at Boehringer Ingelheim to evaluate the relative quality of chemical manufacturing processes. The criteria presented herein are not suggested for application to processes in all stages of the Development cycle, but as a helpful optional tool to stimulate discussions about quality of the current process as well as to identify areas for further process improvements. These criteria have been designed to assess the economics and operability of a chemical process.9 To evaluate a chemical process, one must take a holistic approach as no single parameter is suf f icient to describe the quality of a process. For example, the evaluation of process economics must include considerations for annual API requirements, as the economics for a low-volume API is substantially different from that for an API required in multiton amounts. While other key aspects of process development such as quality control of product, timelines, comprehensive reaction safety studies [including environmental, health, and safety (EHS) aspects], intellectual property (IP) protection, and regulatory compliance must also be thoroughly evaluated for each project, they are outside the scope of this article. The eight criteria discussed herein fall into three categories, namely the material cost factors (criterion 1), conversion cost factors, separated into process efficiency factors (criteria 2−5) and process reproducibility factors (criteria 6−7), and the modified ecoscale (criterion 8)
4. CONVERSION COST FACTORS (CRITERIA 2−7) The conversion cost in a production facility is derived from time- and equipment-related costs for utilities, depreciation, maintenance, labor, and overhead and waste disposal.11 Due to the fact that several different API projects typically compete for available capacity, any time lost for one project will also delay other projects, therefore causing a negative financial impact on the business. VTO, QSL, and PEI (as defined in subsequent sections) are three parameters that Boehringer Ingelheim routinely uses to measure the effectiveness of equipment and manpower utilization in production. 4.1. Process Efficiency Factors (Criteria 2−5). Criterion 2: Atom Economy (AE). Atom economy12 (AE) is defined as a measure of how many atoms of the starting/raw materials are utilized in the final product, and is calculated as the quotient of the molecular weight (MW) of the product and the sum of the MWs of the raw materials. This figure reflects the theoretical efficiency of the synthetic design. When too many or highmolecular weight protective groups or auxiliaries are used, the AE will be lower. Diels−Alder reactions and catalytic hydrogenations are examples of ideal atom-economical reactions. The higher the AE, the more productive the chemical transformation is. The AE is typically defined before the technology transfer from chemical development to process
3. MATERIAL COST FACTORS (CRITERION 1) Criterion 1: Material Cost. The material cost is calculated from the cost of all externally procured raw materials, intermediates, reagents, solvents, and catalysts and is highly scale dependent. While conversion cost factors such as atom economy and yield constitute an integral part of the material costs and are continuously optimized by the external suppliers, they do not require consideration in this section as they are 1699
dx.doi.org/10.1021/op300144g | Org. Process Res. Dev. 2012, 16, 1697−1706
Organic Process Research & Development
Concept Article
Scheme 1. Two synthetic pathways to 2-phenyl-6-azaindole (8)
calculated on the basis of the amount of the limiting reactant, corrected for purity. The ideal or theoretical yield of a chemical reaction would be 100%. According to Vogel,16 yields around 100% are called quantitative; yields about 90% are excellent; 80%, very good; 70%, good; 50%, fair; and yields below about 40% are considered poor. Purification steps such as distillation or recrystallization always lower the yield, and the reported yield usually refers to the yield of the final purified product. More significant than the yield of an individual step is the overall yield of the synthetic sequence. Theoretically, if every step has a high yield, the overall chemical yield will also be good. A strategy that aims to achieve high overall efficiency (yield) for a multistep chemical synthesis therefore often attempts to design a convergent synthesis route, which involves the preparation of several key intermediates for their combination in late stages of the synthesis. Assuming a constant yield for each step, the linear sequence A → B → C → product gives a lower overall yield than the convergent sequence (A → B)+(D → E) → product, with the same number of overall steps (Scheme 2).
development and is calculated as shown in eq 2, determination of AE.
AE =
MW(product) × 100% ∑ MW(raw materials)
(2)
The following example illustrates how AE can be used to evaluate different synthetic strategies towards the same target molecule. 2-Phenyl-6-azaindole (8, Scheme 1)13 is a synthetic building block for a past developmental API project at Boehringer Ingelheim. This compound was not commercially available in bulk quantities, and the existing synthesis (Route 1) required four chemical steps.14 The low AE of the sequence, which equals 194/(94 + 218 + 254 + 102) = 24%, is due to the use of the Boc protecting group and the high-MW halogen atom, iodine. Subsequently, an alternative synthesis of the target azaindole 8 (route 2) was developed through in-house Process R&D, in which the readily available 3-amino-4-picoline (6) was dilithiated with s-BuLi and the resulting dianion 7 condensed with ethyl benzoate to give the target molecule in a single step.15 The new sequence significantly improved the AE to 75% [= 194/(108 + 150)] since the protecting group was avoided and only one mole of ethanol and one mole of water were expelled from the condensation reaction. This example illustrates that AE is a helpful criterion to assess the efficiency of the synthetic route design. While it is difficult to assign a common aspiration value for AE across different synthetic targets due to significant variations in their structural complexities, this value is helpful to compare two competing routes of the same target. At Boehringer Ingelheim, we typically aspire to values in the range of 70−90%. Criterion 3: Yield. The yield, also referred to as chemical yield and reaction yield, is the amount of product obtained in a chemical reaction. While AE shows the efficiency of a synthetic strategy, yields represent the actual productivity of the steps. The actual percentage yield, which measures the effectiveness of a synthetic step, is calculated by dividing the amount of the obtained product [g or mol], corrected for purity, by the theoretical yield [g or mol], multiplied by 100 (% yield = 100 × actual yield/theoretical yield). One or more reactants in a chemical reaction are typically used in excess. The % yield is
Scheme 2. Efficiency of convergent vs linear synthesis
When expensive reactants, starting materials, reagents, or solvents are used, the yield has more impact on the overall cost. Consequently, one synthetic design consideration is to use these components as late as possible in the synthesis, in order to minimize their impact on the overall cost. Once the route of synthesis has been selected, all steps will be subjected to systematic and exhaustive optimization with respect to yield by utilizing tools such as design of experiment (DOE).17 The objective of the development chemist is to reach 1700
dx.doi.org/10.1021/op300144g | Org. Process Res. Dev. 2012, 16, 1697−1706
Organic Process Research & Development
Concept Article
Scheme 3. Ruthenium-catalyzed ring-closing metathesis reaction (RCM) towards BILN 2061
The Conversion Cost for a reaction can be derived from the VTO. Assuming that a typical multipurpose plant with 100 m3 total reactor volume has an annual operating cost of $20M, 330 24-h days of operation, and a capacity utilization of 60%, the usable capacity in this facility equals 100 × 330 × 24 × 0.6 = 475,200 m3 h. When dividing the annual operating cost by the usable capacity, one obtains $42/m3 h, representing a cost of $42 for use of a 1 m3 reactor for one hour. This cost is called standard operating cost.11 For the above example, the conversion cost equals 0.58 m3 h/kg × $42/m3 h = $24/kg, or $24/kg × 250 kg/batch = $6000/batch.19 If the API is a large-volume product, it may be more costeffective to have a dedicated production plant. Production costs in the pilot plant are naturally higher due to smaller batch sizes and unoptimized workflows, reflecting the fact that the process is on a learning curve in development. VTO is also utilized to project the capacity demand for the company’s planned manufacturing portfolio to support campaign scheduling and capital investment decisions. For example, one of the key steps in the synthesis of the former Boehringer Ingelheim developmental API BILN2061 was the ruthenium-catalyzed ring-closing metathesis reaction (RCM) to construct a 15-membered macrocyclic structure (Scheme 3).20 This macrocyclization reaction originally required high dilution conditions. With a catalytic amount of Grela catalyst 11 at 0.01 mol/L initial diene (9) concentration, the product (12) was obtained in 82% yield after 48 h reaction and workup time. In this case, a 6 m3 reactor filled at 80% (i.e., a 5 m3 charge) furnished only 35 kg product. These reaction conditions led to a high VTO of 8.2 m3 h/kg for this step alone [VTO = (6 × 48)/35 m3 h/kg], which is significantly above the internally acceptable level of 1 m3 h/kg. Considering the large projected annual demand for this API and the large VTO, a dedicated plant would have had to be constructed even before phase III clinical trials, with estimated associated expenses of tens of millions of dollars. After extensive and successful process research and development, a Boc protected substrate (10) was discovered to be a more suitable substrate for the RCM reaction. The cyclization could then be accomplished at a more than 20-fold higher substrate concentration with 0.05 mol % catalyst loading to furnish 93% yield of 13 (799 kg from a 6 m3 reactor at 80% fill) within 1 h.21 The workup and reactor cleaning time could also be reduced to 12 h. The VTO was therefore reduced from 8.2 to [(6 × (12 + 1))/799] = 0.1 m3 h/kg. In addition, and more importantly, the new RCM process could be readily accommodated in existing standard multipurpose reactors, thus eliminating large corporate infrastructure investments.
yields of 80% or above. Yields in the range of 70% and below are often considered unfavorable in the pharmaceutical business. The lower the yield, the larger are the number and relative amounts of side products, which can carry over to subsequent steps and potentially remain undetected. Since questions can be raised about the destiny of the unaccounted materials during regulatory inspections, particular considerations are given to the monitoring and fate of genotoxic impurities,18 and avoidance of gentoxic impurities has become an increasingly important synthetic design consideration. Finally, for low-yielding steps, the cleaning operations can become complex and more involved. Criterion 4: Volume−Time−Output (VTO). VTO is defined as nominal volume of all reactors (m3) multiplied by the hours per batch, divided by the output per batch in kg (eq 3, determination of VTO). If the resulting number is 98%), and were assigned quality level Q1 with 0 failure points. Two batches did not reach the desired conversion and had to be reworked to meet the >98% purity specification resulting in two Q3 events with 0.5 failure points each. Yet another two batches had to be discarded due to unexpected side reactions, leading to two Q4 events with 1 failure point each. In this case, the QSL is calculated as [15 − (2 × 0.5 + 2 × 1)]/15 = 80%. A more robust or reproducible process step will deliver a higher QSL. Typically, Boehringer Ingelheim targets a QSL of 98−100% for a given step. To allow for comparison of an entire process with an alternative process, the QSL values for the individual steps are rolled up into a single QSL value for the entire process by multiplying all individual QSL values. Criterion 7: Process Excellence Index (PEI). This reproducibility or robustness criterion is a particularly useful tool for Chemical Production processes. The PEI is an indicator for the performance of the process and is utilized to evaluate the performance in terms of yield and cycle time of diverse operations, such as cycle time for the reaction, centrifugation, drying, or any other operations relevant to the process, and total cycle time. In this section, the PEI yield and PEI cycle time
(6)
It is important to keep in mind that E-factor and PMI typically do not consider recyclable factors such as recycled solvents and reused catalysts, and that the starting point or first step of synthesis for analysis has not been consistently defined across the industry or even within the same companies. For example, one has to decide whether to incorporate the E-factor of the outsourced intermediates, which therefore can lead to inconsistencies. In addition, the E-factor does not include steps for making commonly available reagents (e.g., n-butyllithium) and does not take into account the production volume and the nature and environmental impact of the generated waste. Since the E-factor considers only the mass of the waste but not its nature and environmental impact, an environmental quotient (EQ) was introduced, which is obtained by multiplying the Efactor with an arbitrarily assigned unfriendliness quotient Q.26,27 Despite its aforementioned limitations, the E-factor is a useful 1702
dx.doi.org/10.1021/op300144g | Org. Process Res. Dev. 2012, 16, 1697−1706
Organic Process Research & Development
Concept Article
Table 2. Modified EcoScale template for step evaluation at Boehringer Ingelheim
are discussed. The PEI yield of a given step is defined as the quotient of the average yield and the aspiration level yield (eq 8, determination of PEI yield). PEI yield =
average yield × 100% aspiration level yield
PEI cycle time =
median yield + best yield 2
(10)
As mentioned in the VTO section, the cycle time of the centrifugation operation during product isolation can become the rate-limiting operation, or bottleneck, if the suspension containing the product in a reactor turns out to be difficult to centrifuge. This results in a delay for subsequent batches using the same reactor, thereby increasing the cycle time and the cost. It is therefore helpful if isolation studies can be conducted during scale-up activities to identify and address potential isolation issues. Smaller filtration units or lab centrifuges, equipped with an appropriate filter cloth, will provide a first readout. In addition, modern tools such as Mettler Toledo’s Lasentec29 allow for good understanding of particle size, shape, and count distribution via inline real-time measurements. Therefore, the Process R&D chemist, in collaboration with a specialized Technology or Crystal Engineering lab, can optimize and control the crystallization process, providing a more robust and reproducible process that minimizes downstream cycle times during centrifugation, and consequently reducing product isolation delays during pilot plant and manufacturing campaigns. Returning to our example, the total cycle times of the five batches are 36, 32, 40, 37, and 30 h, respectively. The average cycle time is (36 + 32 + 40 + 37 + 30)/5 = 35 h, the median cycle time 36 h and the best cycle time 30 h. This results in an aspiration level cycle time of (36 + 30)/2 = 33 h, and consequently a PEI cycle time of 33/35 = 94%. The PEI cycle
(8)
The average yield of the step is obtained by dividing the sum of the yields of all batches by the number of batches. The aspiration level yield is calculated as follows (eq 9, determination of aspiration level yield). aspiration level yield =
aspiration level cycle time × 100% average cycle time
(9)
The median yield of the step is the middle value of all yields, from lowest to highest. For an even number of yields, when there is no single middle yield, the median is then defined to be the mean of the two middle yields. The best yield equals the highest yield ever observed. To illustrate the calculation, the yields of the five batches for a given step are 80, 87, 81, 82, and 90%, respectively. The average yield is (80 + 87 + 81 + 82 + 90)/5 = 84%, the median yield 82%, and the best yield 90%. This results in an aspiration level yield of (82 + 90)/2 = 86%, and consequently a PEI yield of 84/86 = 98%. The PEI yield target is 98−100% for commercial processes. For the PEI cycle time, lower values are more desirable as is reflected in an inverted formula as compared to PEI yield (eq 10, determination of PEI cycle time). 1703
dx.doi.org/10.1021/op300144g | Org. Process Res. Dev. 2012, 16, 1697−1706
Organic Process Research & Development
Concept Article
Table 3. Eight criteria defining a good chemical manufacturing process
Figure 4. Weighting of process assessment criteria.
weighting of the eight criteria discussed in section 7 was adjusted accordingly. Since the parameters are flexible and can be fine-tuned on the basis of the specific business need, other users may decide to eliminate potential duplication from their modified EcoScale analysis. However, to ensure consistency within a global company with multiple production and development centers, the relative values or points ought to be clearly defined and communicated. The score for the modified EcoScale is calculated as a percentage of the scored points relative to the total points. This tool has proven helpful in expediently evaluating chemical reaction conditions at laboratory scale. As an example, the two RCM processes discussed in the VTO section (Scheme 2) were analyzed against the modified EcoScale parameters listed in Table 2. The original RCM process using high dilution conditions (Route 1) scored (73/ 110) = 66%, and the optimized Route 2 scored (103/110) = 94%.
time target is 98−100% for a single step for commercial processes. It goes without saying that a larger number of available batch data will provide a better overview of the PEIs and concomitantly of the overall process performance. If the PEI of a commercial process is below the target of 98%, the process ought to be reanalyzed in details to determine the root cause of the issues. Just as with overall chemical yield and VTO, the overall PEI cycle time for the entire process is obtained by multiplying the individual PEI cycle times.
5. ECOSCALE (CRITERION 8) The EcoScale was introduced as a penalty point-based analysis tool for assessing the quality of a chemical process step on the basis of yield, cost, safety, conditions, and ease of workup and purification.30 It is consequently not a single criterion but rather represents a simplified multipoint analysis system combining the seven criteria discussed above plus EHS considerations. Criterion 8: Modified EcoScale. Boehringer Ingelheim adopted a modified version of the EcoScale tool by expanding the scope of the parameters for the chemical process and using a reward rather than a penalty system, ranging from 0 for the least efficient to 10 points for the most efficient process or operation. Table 2 illustrates the modified EcoScale parameters. The modified EcoScale criterion contains some parameters such as yield and cycle time which are also part of criteria 3 and 4 discussed earlier. In order to avoid duplicate influence of these parameters in the overall assessment, the relative
6. OTHER APPROACHES Several alternative approaches have been described in the literature to assess the efficiency of a chemical synthesis. In 1975, Hendrickson defined % Ideality of a synthesis as: [(number of construction reactions) + (number of strategic reactions)] divided by the total number of steps multiplied by 100.31 Construction reactions are those transformations in which skeletal bonds like C−C or C−heteroatom are formed. In 2010, Baran published “Aiming for the Ideal Synthesis”32 1704
dx.doi.org/10.1021/op300144g | Org. Process Res. Dev. 2012, 16, 1697−1706
Organic Process Research & Development
Concept Article
Persinger, C. C.; Munos, B. H.; Lindborg, S. R.; Schacht, A. L. Nat. Rev. Drug Discovery 2010, 9, 203. (4) Chemiewirtschaft in Zahlen [Chemical Industry in Figures], Chapter 2; www.vci.de. (5) Zhang, W.; Berkeley, C. Green Techniques for Organic Synthesis and Medicinal Chemistry, 1st ed.; Wiley: New York, 2012. (6) Katsaros, J.; Christy, P. Getting It Right the First Time: How Innovative Companies Anticipate Demand; Praeger: Westport, CT, 2008. (7) (a) Yu, L. X. Pharm. Res. 2008, 25, 781. (b) Cimarosti, Z.; Bravo, F.; Stonestreet, P.; Tinazzi, F.; Vecchi, O.; Camurri, G. Org. Process Res. Dev. 2010, 14, 993. (c) Looker, A. R.; Ryan, M. P.; Neubert-Langille, B. J.; Naji, R. Org. Process Res. Dev. 2010, 14, 1032. (d) See ref 9b. (8) Bralla, J. G. Design for Manufacturability Handbook, 2nd ed.; McGraw-Hill Professional: Boston, MA, 1998. (9) A number of process selection criteria have been discussed in the following key references. (a) Parker, J. S.; Moseley, J. D. Org. Process Res. Dev. 2008, 12, 1041. (b) Anderson, N. G. Practical Process Research & Development: A Guide for Organic Chemists, 2nd ed.; Academic Press: New York, 2012. (c) Repic, O. Principles of Process Research and Chemical Development in the Pharmaceutical Industry, 1st ed.; WileyInterscience: New York, 1997. (d) Leng, R. B.; Emonds, M. V. M; Hamilton, C. T.; Ringer, J. W. Org. Process Res. Dev. 2012, 415. (e) Butters, M.; Catterick, D.; Craig, A.; Curzons, A.; Dale, D.; Gillmore, A.; Green, S. P.; Marziano, I.; Sherlock, J.-P.; White, W. Chem. Rev. 2006, 106, 3002. (10) ICH Q7A GMP for Active Pharmaceutical Ingredients; Maas & Peither GMP Verlag, D-79650 Schopfheim. (11) Pollak, P.; Badrot, A.; Dach, R. API Manufacturing: Facts and Fiction. In Contract Pharma 2012, Jan. 23. (12) (a) Trost, B. M. Science 1991, 254, 1471. (b) Vaxelaire, C.; Winter, P.; Christmann, M. Angew. Chem., Int. Ed. 2011, 50, 3605. (13) Song, J. J.; Reeves, J. T.; Gallou, F.; Tan, Z.; Yee, N. K.; Senanayake, C. H. Chem. Soc. Rev. 2007, 36, 1120. (14) Harcken, C.; Ward, Y.; Thomson, D.; Riether, D. Synlett 2005, 20, 3121. (15) Song, J. J.; Tan, Z.; Gallou, F.; Xu, J.; Yee, N. K.; Senanayake, C. H. J. Org. Chem. 2005, 70, 6512. (16) Vogel, A. I.; Tatchell, A. R.; Furnis, B. S.; Hannaford, A. J.; Smith, P. W. G. Vogel’s Textbook of Practical Organic Chemistry, 5th ed.; Prentice Hall: New York, 1996. (17) Carlson, R.; Carlson, J. E. Design and Optimization in Organic Synthesis, 2nd ed.; Elsevier Science: Dordrecht, the Netherlands, 2005. (18) For management of genotoxic impurities in the synthesis of pharmaceuticals, see: Bercu, J. P.; Dobo, K. L.; Gocke, E.; McGovern, T. J. Int. J. Toxicol. 2009, 28, 468. (19) Pollak, P. Fine Chemicals: The Industry and the Business, 2nd ed.; Wiley: New York, 2011. (20) (a) Lamarre, D.; Anderson, P. C.; Bailey, M.; Beaulieu, P.; Bolger, G.; Bonneau, P.; Boes, M.; Cameron, D. R.; Cartier, M.; Cordingley, M. G.; Faucher, A.-M.; Goudreau, N.; Kawai, S. H.; Kukolj, G.; Lagacé, L.; LaPlante, S. R.; Narjes, H.; Poupart, M.-A.; Rancourt, J.; Sentjens, R. E.; St. George, R.; Simoneau, B.; Steinmann, G.; Thibeault, D.; Tsantrizos, Y. S.; Weldon, S. M.; Yong, C.-L.; LlinasBrunet, M. Nature 2003, 426, 186. (b) Llinas-Brunet, M.; Bailey, M. D.; Bolger, G.; Brochu, C.; Faucher, A.-M.; Ferland, J. M.; Garneau, M.; Ghiro, E.; Gorys, V.; Grand-Maıtre, C.; Halmos, T.; LapeyrePaquette, N.; Liard, F.; Poirier, M.; Rheaume, M.; Tsantrizos, Y. S.; Lamarre, D. J. Med. Chem. 2004, 47, 1605. (c) Tsantrizos, Y.; Bolger, G.; Bonneau, P.; Cameron, D. R.; Goudreau, N.; Kukolj, G.; LaPlante, S. R.; Llinas-Brunet, M.; Nar, H.; Lamarre, D. Angew. Chem., Int. Ed. 2003, 42, 1356. (d) Goudreau, N.; Cameron, D. R.; Bonneau, P.; Gorys, V.; Plouffe, C.; Poirier, M.; Lamarre, D.; Llinas-Brunet, M. J. Med. Chem. 2004, 47, 123. (e) Rancourt, J.; Cameron, D. R.; Gorys, V.; Lamarre, D.; Poirier, M.; Thibeault, D.; Llinas-Brunet, M. J. Med. Chem. 2004, 47, 2511. (21) (a) Medicinal Chemistry synthesis: Faucher, A.-M.; Bailey, M. D.; Beaulieu, P. L.; Brochu, C.; Duceppe, J.-S.; Ferland, J.-M.; Ghiro, E.; Gorys, V.; Halmos, T.; Kawai, S. H.; Poirier, M.; Simoneau, B.;
and stated that one may never achieve a total synthesis characterized by 100% ideality, but such a pursuit serves as a constant source of inspiration to discover and develop new chemistry. Finally, the PASE concept from Clarke (PASE: pot-, atom-, and step-economy) can be useful to evaluate different synthetic routes, similar to the modified EcoScale.33
7. CONCLUSION AND OUTLOOK The eight criteria defining a chemical manufacturing process, as summarized in Table 3, will have different weighting or relative importance, depending on whether deployed in Chemical Development, Process Development, or Chemical Production. The authors suggest a relative weighting of the eight criteria shown in Table 3, which is graphically outlined in Figure 4. The relative criteria weighting will vary for different process optimization objectives and by company priorities. Boehringer Ingelheim considers the volume-time-output (VTO) criterion most impactful and uses it predominantly when evaluating commercial synthesis processes. Once relative criteria weighting has been adjusted on the basis of the project status, development phase, and/or the corporate strategy, different routes of synthesis towards the same API can be semiquantitatively compared through selective application of the criteria, which then allows for a data-driven selection of the most appropriate route of synthesis.34 In summary, we have provided a comprehensive overview of the constituents of a Good Chemical Process by discussing eight criteria helpful for transferring a development process from Process R&D to commercial Chemical Production. These criteria for a Good Chemical Process are ultimately driven by economic factors. Volume and time efficiency of the utilized reactors plays a predominant role and is quantifiable by determining the VTO. Chemical yields and material costs will remain important, but environmental aspects are also receiving increasing attention. We are hopeful that this article will stimulate productive discussions about quality of chemical processes and help identify areas for process improvements.
■
AUTHOR INFORMATION
Corresponding Author
*Tel: +1 (203) 791-5905. Fax: +1 (203) 837-5905. E-mail:
[email protected] (F.R.); E-mail:
[email protected] (R.D.). Notes
The authors declare no competing financial interest.
■
ACKNOWLEDGMENTS We are grateful to our colleagues Drs. J. Brandenburg, F. D. Klingler, and R. Schiffers at Boehringer Ingelheim Pharma GmbH & Co. KG for stimulating and fruitful discussions.
■
REFERENCES
(1) (a) Mathieu, M. P. Section 1: R&D Spending. In Parexel Biopharmaceutical R&D Statistical Sourcebook 2010−2011 , 1st ed.; PAREXEL International Corporation: Waltham, MA, 2010; p 2. (b) Mathieu, M. P. Section 2: Products in Development. In Parexel Biopharmaceutical R&D Statistical Sourcebook 2010−2011 , 1st ed.; PAREXEL International Corporation: Waltham, MA, 2010; p 80. (2) A New Molecular Entity (NME) is an active ingredient that has never before been marketed in the United States in any form. (3) (a) DiMasi, J. A.; Hansen, R. W.; Grabowski, H. G. J. Health Econ. 2003, 22, 151. (b) Paul, S. M.; Mytelka, D. S.; Dunwiddie, C. T.; 1705
dx.doi.org/10.1021/op300144g | Org. Process Res. Dev. 2012, 16, 1697−1706
Organic Process Research & Development
Concept Article
Tsantrizos, Y. S.; Llinas-Brunet, M. Org. Lett. 2004, 4, 2901. (b) First large-scale synthesis: Yee, N. K.; Farina, V.; Houpis, I. N.; Haddad, N.; Frutos, R. P.; Gallou, F.; Wang, X.-J.; Wei, X.; Simpson, R. D.; Feng, X.; Fuchs, V.; Xu, Y.; Tan, J.; Zhang, L.; Xu, J.; Smith-Keenan, L. L.; Vitous, J.; Ridges, M. D.; Spinelli, E. M.; Johnson, M.; Donsbach, K.; Nicola, T.; Brenner, M.; Winter, E.; Kreye, P.; Samstag, W. J. Org. Chem. 2006, 71, 7133. (c) Nicola, T.; Brenner, M.; Donsbach, K.; Kreye, P. Org. Process Res. Dev. 2005, 9, 513. (d) Practical large-scale synthesis: Shu, C.; Zeng, X.; Hao, M.-H.; Wei, X.; Yee, N. K.; Busacca, C. A.; Han, Z.; Farina, V.; Senanayake, C. H. Org. Lett. 2008, 10, 1303. Farina, V.; Shu, C.; Zeng, X.; Wei, X.; Han, Z.; Yee, N. K.; Senanyake, C. H. Org. Process Res. Dev. 2009, 13, 250. (22) http://cen.acs.org/articles/89/i9/Green-ChemistryPharmaceutical-Roundtable-Shares.html. (23) Li, C. J.; Anastas, P. Chem. Soc. Rev. 2012, 41, 1413. (24) (a) Sheldon, R. A. Green Chem. 2007, 9, 1273. (b) Sheldon, R. A. Chem. Ind. 1992, 903. (c) Anantas, P. T.; Warner, J. C. Green Chemistry: Theory and Practice; Oxford University Press: New York, 2000. (d) See ref 29. (e) See ref 28. (25) Sheldon, R. A. Chem. Ind. 1997, 12. (26) http://www.sheldon.nl/roger/efactor.html. (27) Mohan, M. A.; 13th Annual Green Chemistry and Engineering Conference, College Park, MD, June 23−25, 2009. (28) Lapkin, A.; Constable, D. Green Chemistry Metrics: Measuring and Monitoring Sustainable Processes, 1st ed.; Wiley-Blackwell: New York, 2008. (29) Barrett, P.; Smith, B.; Worlitschek, J.; Bracken, V.; O’Sullivan, B.; O’Grady, D. Org. Process Res. Dev. 2005, 9, 348. (30) Van Aken, K.; Strekowski, L.; Patiny, L. Beilstein J. Org. Chem 2006, 2, No. 3. (31) Hendrickson, J. B. J. Am. Chem. Soc. 1975, 97, 5784. (32) Gaich, T.; Baran, P. S. J. Org. Chem. 2010, 75, 4657. (33) (a) Clarke, P. A.; Santos, S.; Martin, W. H. C. Green Chem. 2007, 9, 438. (b) Grondal, C.; Jeanty, M.; Enders, D. Nature Chem. 2010, 2, 167. (34) Graening, T. Nachr. Chem. 2009, 57, 654.
1706
dx.doi.org/10.1021/op300144g | Org. Process Res. Dev. 2012, 16, 1697−1706