RSEP International Conferences on Social Issues and Economic Studies
ISBN: 978-605-307-447-2
2nd Multidisciplinary Conference, Madrid, SPAIN 2-4 November, 2016
The Effects of Agricultural Support Policies on Agricultural Production: The Case of Turkey Hacı Bayram Işık1 Onur Bilgin2
Abstract Almost all countries in the world consider agriculture as a strategic and vital sector for their nations and therefore supports/subsidies it somehow. Proponents of agricultural supports claim that the country's food supply is too critical to the nation's well-being to be governed by uncontrolled market forces. They also contend that in order to keep a steady food supply, farmers' incomes must be somewhat stable. Based on the support types, agricultural supports can be divided into two categories. The first one is the support given over the output, mostly carried out as a market price support (MPS). And the second one is the supports implemented without intervention in the price of the product such as direct and indirect income supports. The aim of this study is to examine the effects of different agricultural support programs implemented in Turkey. For this reason, the relationship between the variables was examined by using annual data over the period of 1986-2015. It was found that the agricultural production was positively influenced by the given supports. And supports given in the form of market price in Turkey seem to be more effective than the others. If these results are compared with the leading countries in the agriculture sector, the support programs applied in Turkey and the effectiveness of these programs are significantly decoupled from the other countries. Keywords: Agricultural Support, Agricultural Production, Market Price Support JEL Classification Codes: Q180, Q130, C22 Introduction The basic function of the agricultural sector is to meet human’s nutritional needs. Needs such as education, health, recreation and even safety can only be addressed once the nutritional needs have been addressed. The agricultural sector has a strategic importance in terms of supplying the most basic needs of the human being. It distinguishes itself from other sectors with this feature. Despite the importance of the agricultural sector, agricultural production is highly influenced by nature. When the natural conditions are favorable for the plant, the production increases, otherwise significant decrease in production can occur. Since the price and income elasticities of agricultural products are low, the producer income fluctuates. Various problems in 1 2
Prof., Kirikkale University, Turkey Res. Asst., Kirikkale University, Turkey
111 Hacı Bayram Işık Onur Bilgin
The Effects of Agricultural Support Policies on Agricultural Production: The Case of Turkey
DOI: 10.19275/RSEPCONFERENCES017
RSEP International Conferences on Social Issues and Economic Studies
ISBN: 978-605-307-447-2
2nd Multidisciplinary Conference, Madrid, SPAIN 2-4 November, 2016
agricultural production and the strategic importance of the sector have led the states to support the producers. In this context, the main reasons for the agricultural support programs are to have steady and safe food supply, to be self-sufficient and to eliminate the imbalance in sectorial income distribution (Acar, 2003). 1. Agricultural Support Policies It is possible to distinguish two different groups in terms of support channels for agricultural support policies. The first is the support given on the output. A large part of the support given over the output is the direct intervention in the market price (Soyak, 1996). Intervention to the price of the product, also called market price support (MPS), takes place in the form of determining the unit price for the agricultural product and taking it at this price. The main purpose of the market price support program is to provide price stability in agricultural products and to support both producers and consumers (Aktaş, Altıok, & Songur, 2015). Despite this aim, the market price support program, which was implemented during the 1980s, was unfortunately not achieved. On the contrary, the prices of agricultural products have shown a great decline in these years. The price of agricultural products in the world, which was $100 at fixed prices in 1979, decreased to $61 in 1985, $55 in 1986, and $50 in 1987 (Acar, 2003:102). This decline in prices has become the main target in the world to change these policies so that they do not create excess supply, since the prices that cause excess supply are a result of direct intervention policies (Aktaş, Altıok, & Songur, 2015). At the beginning of the 1990s, liberalization policies in the trade of agricultural commodities came to light under the leadership of the World Trade Organization (WTO). According to the Uruguay Round Agreements Act (URAA), which began to be implemented in 1994, a new structure was targeted in agricultural commerce, based on comparative advantages and liberalizing trade conditions (Kazgan, 2003, 397). The second group of agricultural support policies is the support made without intervention in the price of the product. These are direct income support and indirect income support. By its simplest definition, direct income support refers to income payments, independent or to some extent dependent on production. The direct income policy, which has begun to find more application areas by abandoning the market price support at certain rates, aims to support the producers without interfering with the price of agricultural products. In this system, product prices will be formed on the market, so production will be determined according to market signals and price distortions caused by incompatibility of supply and demand will be prevented. The main objective of this system is to aid poor producers and is implemented in countries with supply surplus (Yapar, 2005). Another type of agricultural support without price intervention is indirect income support. It is support for the inputs that have an effect on the quantity and quality of production. These include subsidies such as tax reduction, capital grants, credit support, reduction in interest rates on loans, and input subsidies for fertilizers, medicines, irrigation, seed, transport, energy and insurance and storage for plant production (Aktaş et al., 2015). If the leading developed countries in the agricultural sector such as European Union, the USA and Australia are examined, the dimensions of the changes in agricultural support policies can 112 Hacı Bayram Işık Onur Bilgin
The Effects of Agricultural Support Policies on Agricultural Production: The Case of Turkey
DOI: 10.19275/RSEPCONFERENCES017
RSEP International Conferences on Social Issues and Economic Studies
ISBN: 978-605-307-447-2
2nd Multidisciplinary Conference, Madrid, SPAIN 2-4 November, 2016
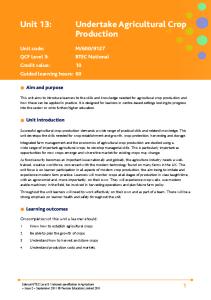
be seen more clearly. Figure 1 shows the changes in agricultural support policies in the European Union. In 1986, 92% of the support given to the producers by the Union was given as market price support. Only 8% are given as other supports. However, there has been a major change in the support program over the past 30 years. Only 26% of the support given in 2015 is in the form of price intervention, the rest of the support have no direct impact on the market price. Figure 1. The changes in agricultural support policies in the European Union 1.00 0.90 0.80 0.70 0.60 0.50 0.40 0.30 0.20 0.10 0.00 1985
MPS Other
1990
1995
2000
2005
2010
2015
Source: OECD Producer Support Estimate, (2016)
Apart from the European Union, the other major countries in the agricultural sector are the USA and Australia. For many years, the United States is in the upper ranks of agricultural production (Simpson, 2016). According to World Bank data (2013), Australia is the country with the highest per capita agricultural output. The charts below show the changes in both the US and Australia agricultural support policies. During the 1990s, the MPS and other support programs in the USA remained close to each other. However, as of 2001, the share of the support given as MPS has fallen below the other support levels and this difference has continued to keep at a certain level until today. Figure 2. The changes in agricultural support policies in the USA 1.00 0.90 0.80 0.70 0.60 0.50 0.40 0.30 0.20 0.10 0.00 1985
MPS Other
1990
1995
2000
2005
2010
2015
Source: OECD Producer Support Estimate (2016)
113 Hacı Bayram Işık Onur Bilgin
The Effects of Agricultural Support Policies on Agricultural Production: The Case of Turkey
DOI: 10.19275/RSEPCONFERENCES017
RSEP International Conferences on Social Issues and Economic Studies
ISBN: 978-605-307-447-2
2nd Multidisciplinary Conference, Madrid, SPAIN 2-4 November, 2016
In Australia, support for producers without any price intervention since 2003 is a striking example of the great change in agricultural support policies. Figure 3. The changes in agricultural support policies in the Australia 1.00 0.90 0.80 0.70 0.60 0.50
MPS
0.40
Other
0.30 0.20 0.10 0.00 1985
1990
1995
2000
2005
2010
2015
Source: OECD Producer Support Estimate (2016)
In addition to these countries, according to the OECD agricultural support data set; Chile, Switzerland, Japan, Kazakhstan, Mexico and South Africa are reducing MPS. Despite these countries, price interventions are still being implemented intensively in various countries. The change in agricultural support given to producers in Turkey is shown in Figure 4. Turkey's agricultural support policies have not changed much in the last 30 years. During this period, it seems that the support policies provided by the intervention in the market price have not been removed much. Figure 4. The changes in agricultural support policies in the Turkey 1.00 0.90 0.80 0.70 0.60 0.50
MPS
0.40
Other
0.30 0.20 0.10 0.00 1985
1990
1995
2000
2005
2010
2015
Source: OECD Producer Support Estimate (2016)
114 Hacı Bayram Işık Onur Bilgin
The Effects of Agricultural Support Policies on Agricultural Production: The Case of Turkey
DOI: 10.19275/RSEPCONFERENCES017
RSEP International Conferences on Social Issues and Economic Studies
ISBN: 978-605-307-447-2
2nd Multidisciplinary Conference, Madrid, SPAIN 2-4 November, 2016
According to the report "Producer Support Estimate Indicator" published by the OECD in 2012, Turkey is among the countries that provide the most support to the agricultural sector. Unfortunately, Turkey has not reached the desired levels in agricultural production. This has led to the questioning of agricultural support policies that have been implemented for many years. In spite of these supports, in recent years, Turkey's internal terms of trade have increased even more against the agricultural sector and the increase in foreign dependency in agricultural production has shown the importance of this paper. History reveals that agricultural support policies are not always sufficient to achieve the desired outcomes. From this point of view, in this study, the effect of different agricultural support policies applied in Turkey on agricultural production has been investigated. 2. Literature The following table summarizes both theoretical and empirical studies of agricultural support policies. It can be said that the studies concentrate mainly on the analysis of the paradigm shift in agricultural support policies. Table 1. Some of the Studies on Agricultural Support Policies
Author Kirsten, Tregurtha, Gouse, & Tswai, (2000) Frewley and Keeney (2001) Acar (2003) Yapar (2005) Yılmaz, Demircan, & Dernek (2008) (Civan, 2010) Aktaş, Altıok, Songur (2015) Demirdöğen, Olhan, & Chavas (2016)
Results They pointed out that agricultural support in South Africa declined between 1995 and 1998, and that there was a negative effect of market price support on 9 different crops. They examined the impact of change in agricultural politics on farm incomes in Ireland. They stated that direct income support created a fairer distribution of income among producers. He has studied new directions in agricultural support policies around the world. It has been stated that the direct income support policy is not suitable for Turkey. It is stated that there is a statistically significant relationship between the use of direct income support and value of gross agricultural output. It was emphasized that as domestic consumption increased, domestic support regulations decreased. They stated that agricultural input support negatively affects the ratio of the total value of agricultural production to the total value of agricultural consumption in the EU, Turkey, Australia, Israel and Mexico. They have reached the conclusion that the support given over the input is more effective than the output support.
115 Hacı Bayram Işık Onur Bilgin
The Effects of Agricultural Support Policies on Agricultural Production: The Case of Turkey
DOI: 10.19275/RSEPCONFERENCES017
RSEP International Conferences on Social Issues and Economic Studies
ISBN: 978-605-307-447-2
2nd Multidisciplinary Conference, Madrid, SPAIN 2-4 November, 2016
3. Data In this study, Johansen's cointegration analysis was used to examine whether agricultural subsidies given in 1986-2015 in Turkey affected agricultural production. The variables used in the analysis are shown in Table 2. The total value of agricultural production was used as a dependent variable. The supports given over the outputs and other supports were used as independent variables. Logarithmic forms of variables are used in the analysis. Table 2. Data
Variables
Symbol
Total value of agricultural production
LNTVP
Market Price Supports
LNMPS
Other Supports
LNOTHER
Source: OECD
4. Econometric Methods and Results Time series analysis begins by examining the stability of the series. When econometric analyses are made between the non-stationary series, a misleading result is encountered, which is called a spurious regression. In other words, conventional t, F tests and R2 values can give wrong results. For this reason, stability is first tested (Tatoğlu, 2012). Augmented Dickey-Fuller (ADF) and Phillips-Perron, (1988) tests are the most commonly used tests to determine whether variables are stationary. In this study, following the literature, related tests were used and the Schwarz Information Criterion (SIC) was taken into consideration in determining ADF delay length. Unit root test results are shown in Table 3. Table 3. The Results of ADF and PP Unit Root Tests
ADF Constant No Trend -5.589768** LNTVP -4.282355*** LNMPS LNOTHER -2.858074* -0.879819 LNTVP -3.123464** LNMPS LNOTHER -4.593096***
Phillips-Perron Constant No Constant Trend Constant Trend Trend 1.052343 -3.838101*** 0.654790 -0.047885 -4.356757*** 1.582419 -0.729105 -3.369020** -0.343687 First-Difference -4.010489** -1.666735 -4.007822** -4.906153*** -3.123464** -7.936329*** -5.676255*** -4.580811*** -7.977286***
***%1, **%5, *%10 According to the results of the unit root test, the LNTVP and LNOUT variables are stationary. However, given the trends in the series, fixed-trend test results are believed to provide more 116 Hacı Bayram Işık Onur Bilgin
The Effects of Agricultural Support Policies on Agricultural Production: The Case of Turkey
DOI: 10.19275/RSEPCONFERENCES017
RSEP International Conferences on Social Issues and Economic Studies
ISBN: 978-605-307-447-2
2nd Multidisciplinary Conference, Madrid, SPAIN 2-4 November, 2016
reliable results. In this context, all three variables were found to be non-stationary in terms of level values in the fixed-trending case and the series were made stable by taking the first differences. Cointegration tests allow the estimation and modeling of the long-term relationship between non-stationary variables at the econometrically level. The first thing to do in order to implement the Johansen cointegration test is to determine the optimal lag length (k) in the Vector Autoregressive Model framework (Küçüksoy, 2015, 14). Table 4. Model selection criteria values for various lag lengths.
Lag 0 1 2
LogL -4.089864 16.94047 21.72988
LR NA 35.82947* 7.095416
FPE 0.000339 0.000140* 0.000197
AIC 0.525175 -0.365961* -0.054065
SC 0.669157 0.209966* 0.953808
HQ 0.567988 -0.194708* 0.245628
Note: The asterisk (*) indicates the optimal delay length for each model selection criterion.
It seems that there is an optimal delay length for all the Logarithmic Probability Rate (LR), Final Estimation Error (FPE), Akaike Information Criteria (AIC), Schwartz Criteria (SC) and Hannan-Quinn Criteria (HQ). Johansen and Juselius (1990) have developed a cointegration test that can be used even when there is more than one cointegration relationship between variables, using the vector autoregressive (VAR) model in which all variables are treated internally (Aslan, 2009:7). Table 5 shows the cointegration test results. Table 5. Johansen Cointegration Test Results
Hypotheses No cointegrated vector
Hypotheses No cointegrated vector
Eigenvalue
Trace Statistics
0.05 Critical Value
Prob.**
0.541909 0.437013 0.022739
37.21111 16.13253 0.621055
29.79707 15.49471 3.841466
0.0058 0.0401 0.4307
Eigenvalue
Maximum Generalized Eigenvalue
0.05 Critical Value
Prob.**
0.541909 0.437013 0.022739
21.07857 15.51148 0.621055
21.13162 14.26460 3.841466
0.0509 0.0316 0.4307
The calculated trace statistic is greater than the critical value at the 5% significance level. The p-value of the null hypothesis seems to be 5% smaller. Therefore, the null hypothesis can be rejected. There is a long-lasting cointegration relationship between the series. The same result 117 Hacı Bayram Işık Onur Bilgin
The Effects of Agricultural Support Policies on Agricultural Production: The Case of Turkey
DOI: 10.19275/RSEPCONFERENCES017
RSEP International Conferences on Social Issues and Economic Studies
ISBN: 978-605-307-447-2
2nd Multidisciplinary Conference, Madrid, SPAIN 2-4 November, 2016
is obtained by looking at the Maximum Likelihood Rank test. These results indicate that there is at least one cointegration vector between the variables. This information indicates that the coefficients of the econometric estimates will accurately reflect the relationship. Once a cointegration vector has been identified between variables, the intensity and direction of this relationship is determined by: FMOLS, DOLS and CCR estimators. Table 6. Long Term Coefficients (Dependent Variable LNTVP)
Variables/ Estimators LNMPS LNOTHER C @TREND
FMOLS
DOLS
CCR
0.686736*** 0.226011*** 1.940201** 0.034757***
0.729798*** 0.208061 2.004905*** 0.021931
0.685384*** 0.230727** 1.960035*** 0.032215**
Note: *** p