International Association of Scientific Innovation and Research (IASIR) (An Association Unifying the Sciences, Engineering, and Applied Research)
ISSN (Print): 2279-0020 ISSN (Online): 2279-0039
International Journal of Engineering, Business and Enterprise Applications (IJEBEA) www.iasir.net The Effect of Filling Weights to Liquefied Petroleum Gas Residue in Storage Zainal Zakaria1 & Azeman Mustafa2 Department of Renewable Energy Engineering Faculty of Petroleum and Renewable Energy Engineering Universiti Teknologi Malaysia, 81310 UTM Skudai, Johor. _________________________________________________________________________________________ 1,2
Abstract: An experimental rig is set up to investigate the residue amount of LPG with composition of 40:60 in cylinder during exhaustion process or the continuous off take for different filling weights. The ideal operation design for LPG needs to be identified following the unsolved problem of unused gas. The experiment results show that the minimum filling weight of 62.5% and a maximum of 84% should be considered. Based on dimensionless analysis, the sensible heat used for evaporation process is taken mainly at the internal wall. Thus the dominant heat derived for the evaporation process is through the axial direction compared to the radial direction at the regions adjacent to the surface of internal wall. Keywords: LPG Cylinder, off take rate, residue, sensible heat, storage __________________________________________________________________________________________ I. Introduction LPG may be considered as a primary fuel as it is mainly produced from crude oil or natural gas by physical processing only [1]. LPG which consists of propane and butane has low vapor pressures and are easily liquefied [2]. LPG is sold under various trade names as a liquid under pressure either in bulk or in steel bottles [3]. The conversion of liquid to vapor is referred to by the general term “vaporization”, when it takes place at an escape between a liquid and its vapor it is referred to as “evaporation”. Vaporization is a process where the molecules at the interface runaway from the liquid phase to the gas phase at temperature below the boiling point of the liquid. This phenomenon can occur at any temperature. Evaporation of liquid stored in a closed cylinder can be considered as similar to boiling [4].During the process, molecules at the liquid interface have enough energy to overcome attraction forces from molecules around it and consequently it moves to the gas phase [5,6]. Vaporization of LPG can be defined as an evaporation that occurs due to the pressure drop caused by the gas exhaustion from a closed container. During this process, heat required for vaporization is supplied partially from the liquid phase and the surrounding. On evaporation, one volume of propane produces 270 volumes of gas and hence a large amount of heat energy may be stored in a small volume. An important point to note is the boiling point of butane, which is 273 K. It is therefore imperative to use the gas above freezing conditions if incomplete vaporization of the liquid on leaving the cylinder is to be avoided [7, 8]. LPG can be transported and stored in liquid form under moderate pressures and at normal temperatures. When released at atmospheric pressure at relatively low temperature it vaporizes and can be handled as a gas [9]. But this operation cycle includes a problem related to the loss due to the residual amount of gas left at exhaustion. This problem has been considered as one of the main drawbacks in LPG cylinders that creates unsatisfactory conditions. This problem occurs when the vapor is consumed through the natural evaporation process at high exhaustion rate [10]. In this process, the temperature of the liquid and the pressure inside the cylinder drop rapidly and may reach a point when the cylinder pressure is insufficient to supply the gas at the required exhaustion rate [11]. The required exhaustion pressure is the minimum inlet pressure for a regulator and normally considers as being at 5 psi for the commercial sector [12, 13]. At this point the exhaustion rate may approach zero and create residue in the cylinder. It is reported that more than 10 percent of residue or 12.6 kg is found in the 50 kg water capacity cylinder [12] which consist of propane 2.17 percent and butane 97.82 percent by weight respectively. Recently, even though there are a number of researchers investigating the residue problem, a complete solution is yet to be found. The possible methods in reducing the residue problem and thus increasing the evaporation process in liquefied petroleum gas storage are increasing thermal conductivity and heat capacity, installing coil system inside the storage, adding absorbent material inside the storage, applying coating agents on outer vessel wall and changing initial liquefied petroleum gas composition. However, based on the results obtained by previous researchers
IJEBEA 13- 115; © 2013, IJEBEA All Rights Reserved
Page 35
Zakaria et al., International Journal of Engineering, Business and Enterprise Applications, 4 (1), March-May, 2013, pp. 35-43
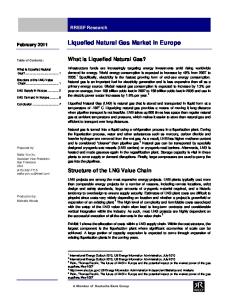
there is no single method capable to completely withdraw liquefied petroleum gas from storage or in other words to empty the storage but only to minimize the residue [14]. Since there is no single method or technique capable to empty the cylinder and the residue will vary with the mode of application and yet the dimensions of the cylinder are also not the same with different suppliers, then another approach needs to be explored. But all methods mentioned above show some potential in improvement of the evaporation process. Nevertheless, the methods lack applicability and practicability to be adopted, and hence are not possible to be commercialized [15]. Therefore, the researcher suggests that it should be better if the overall concept of mass and heat transfer to the liquefied petroleum gas cylinder under dynamic state condition is carried out in detail. This is because the major factor affecting the residue is the amount of sensible heat required during the evaporation process. By understanding the concept of heat and mass transfer under dynamic state conditions, it will lead to the development of an experimental rig. This article deals with the amount of LPG filling weight in cylinder. The data gathered from the experimental rig will be able to determine the correct filling weight to achieve minimum residue amount. Hence, it will lead to the development of an amount limitation of LPG. II. Materials and Methods Materials used in this study are propane and butane with the composition of 40:60. This study involves the fabrication and installation of simple apparatus as shown in Figure 1. The rig basically was referred to the study method done for a small size cylinder [14]. However, few modifications were made, such as the number and positions of the thermocouples, control of surrounding temperature and flow meter arrangements as well as the additional on line gas chromatography. However, in order to conduct this study, the equipment or apparatus involved only the testing cylinder, the number and position of the thermocouples, data logger, computer and flow meter. The experiment was conducted by fixing parameters of composition, filling weight and initial flow rate and variation of surrounding temperature range from 10 oC to 35oC. Such data of temperature, pressure and weight were taken for every 5 minutes interval for 1 hour and every 30 minutes after the period of 1 hour until the cylinder pressure reached zero. III. Results and Discussions A. Temperature Distribution Profile The difference in temperature fall for all tested filling weights at the surrounding temperature of 30oC and flow rate of 48 liter per minute was very small as illustrated in Figure 2. The characteristics that can be observed from the figure are as follows. Firstly, increasing the weight will increase the period of phase change at the level of sensor. The result shows that the time of phase change (based on temperature turning point) were 55 minutes, 75 minutes, 120 minutes, 180 minutes, 240 minutes and 300 minutes for the weights of 2 kg to 7 kg. This is due to the level of the liquid, which is proportional to the weight of LPG. Therefore, the higher the weight the higher the volume, and the further the distance of temperature sensor to the surface of the liquid. Flow meter
On-line GC
Ball valve
Solenoid valve Gas Charging
Ball valve
Gas Discharging Thermocouple
Pressure Transducer
Data logger
Testing Cylinder Computer Glass window Balance
Thermal start/Oven
Figure 1: Schematic diagram of the study rig
IJEBEA 13- 115; © 2013, IJEBEA All Rights Reserved
Page 36
Zakaria et al., International Journal of Engineering, Business and Enterprise Applications, 4 (1), March-May, 2013, pp. 35-43
Secondly, the higher weight of LPG will provide a higher liquid temperature. For example, for the period of 50 minutes, the liquid temperatures at the center of the cylinder were –7.98oC, -3.49oC, -1.24oC, -0.75oC, 0.36oC and 1.5oC for the weights of 2 kg to 7 kg. This phenomenon can be elaborated into two ways. Firstly, a total initial energy of liquid is proportional to the amount of liquid; therefore, with a larger amount of liquid, the temperature gain or loss would be slower. Secondly, heat energy supplied to the liquid is more at higher weight of LPG since the amount of heat distributed into liquid LPG is influenced by the wetted area. Therefore, higher wetted area will provide more heat to be absorbed by propane or butane molecules. Both cases will delay the sweating or ice layer forming. This means that when the weight of LPG is low, the total initial liquid energy is low and the resistance to heat transfer at the cylinder becomes greater since vapor occupies more dominant space in the cylinder and it has a very low heat transfer coefficient. However, the dominant source of heat would be identified by dimensionless analysis of heat flow. But, as a pre-finding, the dominant of heat source was from initial energy of liquid molecules since there was no significant effect between filling weight of 6kg and 7kg for the first 60 minutes whereas it is different in terms of wetted area. Thirdly, the weight of a 7 kg gave a slightly higher reading of temperature compared to that of a 6 kg. Therefore, the suggested minimum weight of LPG for the system under study was a 5 kg since the reduction of the temperature was not too high and also slightly below the temperature of weight of a 6 kg. Further support of the suggested minimum weight is highlighted in Figure 3 which is based on temperature gradient consistency. With reference to the scale used for the portable cylinder size of 50 kg water capacity, the minimum filling weight of 62.5 percent should be considered. Therefore, the weight of LPG must be properly determined in order to minimize the residue problem due to the fall in liquid temperature. However, the maximum percentage of the LPG was limited due to safety reasons.
35.00 30.00
Temperature (Celsius)
25.00 20.00 15.00 10.00 5.00 0.00 -5.00 -10.00 -15.00 0.00
50.00
100.00
150.00
200.00
250.00
300.00
350.00
400.00
450.00
Time (Minute)
W = 7 kg
W = 6 kg
W = 5 kg
W = 4 kg
W = 3 kg
W = 2 kg
Figure 2: Liquid Temperature at Center Sensor for Various Weights at Composition of 4060, Surrounding Temperature of 30oC and Flow rate of 48 liter/minute The dimensionless analysis on the basis of axial and radial temperature data would be discussed in further detail in order to get detailed understanding of the tank thermal behavior. Figure 4 shows the temperature profile at the centre sensor of axial direction with effects of variation in filling weight after 10 minutes of discharging period. Based on the figure, there are a few characteristics that can be observed. Firstly, the pattern of thermal behavior in the cylinder was different compared with other tested parameter as previously discussed. The difference in filling weight showed a different pattern of thermal behavior. There are two different patterns of behaviors related to the filling weight, which show curve shape lines and straight lines. At the filling weight of more than 4 kg, it gave the same pattern like other test parameters, which is the curve shape lines and vice versa at below it. It means that, with the small amount of LPG in the cylinder then the total energy that was required was not enough so it will be further taken from the most bottom part so that the axial direction is the dominant process of deriving heat. Therefore, the minimum-filling amount of LPG into the cylinder should be given consideration in
IJEBEA 13- 115; © 2013, IJEBEA All Rights Reserved
Page 37
Zakaria et al., International Journal of Engineering, Business and Enterprise Applications, 4 (1), March-May, 2013, pp. 35-43
order to achieve the cylinder efficiency at the suggested level, which is more than 50 percent or a minimum of 62.5 percent as above mentioned.
6.00
Temperature (Celsius)
4.00
Inconstant Gradient
2.00 0.00 -2.00 -4.00 -6.00 Constant Gradient
-8.00 -10.00 0
2
4
6
8
Filling Weight (kg) 40 Minute
45 Minute
50 Minute
55 Minute
Temperature (Celsius)
Figure 3: Relationship between Temperature and Initial Filling Weight at Composition of 4060, Surrounding Temperature of 30oC and Flow rate of 48 liter/minute 35 30 25 20 15 10 5 0
Turning point
0
0.2
0.4
0.6
0.8
1
1.2
Axial Position, z/L
W = 7 kg
W = 6 kg
W = 5 kg
W = 4 kg
W = 3 kg
W = 2 kg
Figure 4: Dimensionless Axial Profile of Temperature at 10 Minutes at Centre of Various Weights at Flow rate of 48 liter/minute, Composition of 4060 and Surrounding Temperature of 30oC Secondly, at the beginning of the discharging process, the higher filling weight gave the lower temperature reading at the upper part of the cylinder and vice versa at the bottom part. It means that, at the higher filling weight the liquid molecules at the upper level are sufficient to supply the energy; therefore, the contribution of heat from the molecules at the bottom is minimal or probably not required. In other words, the higher the filling weight is better in minimizing the reduction of liquid temperature, consequently minimizing in residue problem. However, in actual practice, the maximum filling weight should follow the appropriate percentage that is required by the code of practice due to safety reasons. Similar to other test weight parameters, the influence of temperature of liquid level was further increased up to the bottom part of the cylinder whenever the discharging process continued as illustrated in Figure 5. The higher the filling weight the lower the temperature in vapor phase and vice versa in liquid phase. The difference of
IJEBEA 13- 115; © 2013, IJEBEA All Rights Reserved
Page 38
Zakaria et al., International Journal of Engineering, Business and Enterprise Applications, 4 (1), March-May, 2013, pp. 35-43
temperature level in vapor phase is bigger compared to liquid phase among all of filling weights. This is due to the fact that, in liquid phase energy is continuously absorbed for the purposes of changing phase but not in the vapor phase as it has a low heat transfer coefficient. Therefore, the temperature in vapor phase increases continuously until the end of the discharging process. 25
20
Liquid level
Temperature (Celsius)
15
10
5
0
-5
-10 0
0.2
0.4
0.6
0.8
1
1.2
Axial Position, z/L
W = 7 kg
W = 6 kg
W = 5 kg
W = 4 kg
W = 3 kg
W = 2 kg
Figure 5: Dimensionless Axial Profile of Temperature at 120 Minute at Centre of Various Weights at Flow rate of 48 liter/minute, Composition of 4060 and Surrounding Temperature of 30 oC However, the different temperatures of both phases will be getting closer towards the end of the discharging process as illustrated in Figure 6. This is because; in the vapor phase the temperature of all filling weights will achieve the surrounding temperature level. It means that, at the final stage of the discharging process all of filling weights will be having the same temperature as the surrounding temperature. In the liquid phase, all filling weights tend to reach the boiling point of residue compound. It means that, at 180 minutes discharge period, the residue compound will be having propane and captured butane components respectively since the lowest temperature detected was less than –0.5oC as shown in Figure 2. Theoretically, at this temperature level there is none of butane component vaporized unless supported by energy provided by the propane component. Figure 6 also illustrates the inconsistencies of temperature levels in liquid phase among all filling weights. The filling weight of a 4 kg gave the lowest temperature level compared to the filling weight of 3 kg. This shows that, at 180 minutes the liquid of filling weight of a 3 kg was almost completely transferred into the vapor phase. This type of pattern will be followed by the next minimum filling weight towards the end of the discharging process. As explained, the more the filling weight the slower the reduction of liquid temperature since there is higher contribution of energy. However, once again, like effect on variation of composition, flow rate and surrounding temperature the heat for the evaporation process for variation of filling weights may not be dominantly supplied from the outside of cylinder since temperature at the bottom part of the cylinder kept decreasing even though the cylinder was not covered by an ice layer. 30 25
Tend to reach surrounding temperature
Temperature (Celsius)
20
Vapor phase
15 10
Tend to reach boiling point
5 0
Liquid phase
-5 -10 0
0.2
0.4
0.6
0.8
1
1.2
Axial Position, z/L
W = 7 kg
W = 6 kg
W = 5 kg
W = 4 kg
W = 3 kg
Figure 6: Dimensionless Axial Profile of Temperature at 180 Minutes at Center of Various Weights at Flow rate of 48 liter/minute, Composition of 4060 and Surrounding Temperature of 30oC
IJEBEA 13- 115; © 2013, IJEBEA All Rights Reserved
Page 39
Zakaria et al., International Journal of Engineering, Business and Enterprise Applications, 4 (1), March-May, 2013, pp. 35-43
35
Temperature (Celsius)
30 25 20 15 10 Heat from outside
5 Heat from liquid molecule at center
0 0
0.2
0.4
0.6
0.8
1
1.2
Radial Position, r/R W = 7 kg
W = 6 kg
W = 5 kg
W = 4 kg
W = 3 kg
W = 2 kg
Figure 7: Dimensionless Radial Profile of Temperature at Level 6 at 10 Minutes of Various Weights at Flow rate of 48 liter/minute, Composition of 4060 and Surrounding Temperature of 30oC Figure 7 shows the temperature profiles of the sensor at level 6 of radial direction with effects to variation in filling weight after 10 minutes of discharging period. Based on the figure, the reduction of temperature from external wall to the centre of the cylinder varies from low to high filling weight. However, the reduction of temperature was tremendous from the external wall to the centre of the cylinder except for the filling weight of above 4 kg but the filling weight of above 4 kg, the reduction of temperature inside the cylinder was very small or the temperature inside the cylinder was almost stagnant. This indicates sensible heat used for the evaporation process for the filling weight below 4kg was not enough supplied from the surroundings even at an early stage; therefore, it is taken mainly from liquid molecules and will continuously drop in liquid temperature. The drop of the liquid temperature once again was shown that the heat was dominantly supplied through axial direction as above mentioned. The higher the filling weight the bigger the heat supplied by the liquid molecules for the evaporation process since it has a higher initial total energy as well as providing more wetted area and high heat transfer rates between cylinder and liquid. Based on the figure, at the early stage energy was supplied by two sources since there is no reduction of liquid temperature and from liquid molecules at the later stage. Furthermore, the filling weight of below 62.5 percent of total capacity should be avoided in order to minimize the problem related to the cylinder system due to high reduction of liquid temperature. 20
Temperature (Celsius)
15
10
Almost similar gradient
T =15oC
5
0
T =15oC
-5
-10 0
0.2
0.4
0.6
0.8
1
1.2
Radial Position, r/R
W = 7 kg
W = 6 kg
W = 5 kg
W = 4 kg
W = 3 kg
W = 2 kg
Figure 8: Dimensionless Radial Profile of Temperature at Level 6 at 90 Minute of Various Weights at Flow rate of 48 liter/minute, Composition of 4060 and Surrounding Temperature of 30 oC The pattern of temperature drop became similar, this is lower in the liquid phase but became higher from the external wall to the internal wall towards the end of discharging process as shown in Figure 8. At this period of time the liquid molecules at the centre has less energy compared to the liquid molecules at internal wall so that
IJEBEA 13- 115; © 2013, IJEBEA All Rights Reserved
Page 40
Zakaria et al., International Journal of Engineering, Business and Enterprise Applications, 4 (1), March-May, 2013, pp. 35-43
the evaporation process only occurs at that place and with the lower rate. The profile indicates that the surrounding temperature was not sufficient to supply heat into the cylinder system even at higher filling weight. However, the higher the filling weights the higher the temperature level to be sustained even though the temperature drop between the external wall and the internal wall was almost similar. The similarity of drop and the consistency of gradient in temperature were likely to be related to the ice layer formation that surrounded onto the cylinder wall and heat dominantly was supplied from the liquid molecules itself. With reference to the tested filling weight, therefore, the suggested filling weight should be at least 62.5 percent of cylinder capacity since it tends to behave like a maximum allowable filling capacity especially towards the centre of the cylinder. Even though the filling weight of 7 kg or 87.5 percent gave the most superior result but implementation wise is quite doubtful due to the restriction of the maximum filling ratio. As such, confirmation by the code of practice should be referred prior to use. If the liquid is transferred into vapor phase, which is towards the end of the discharging process, the temperature starts to increase. This is because, the heat contained in vapor phase is not used for the evaporation process so that the vapor temperature will continuously increase to equalize with the surrounding temperature. B. Pressure Profile Figure 9 illustrates the difference in pressure fall for the variation of the initial weights of 2 kg to 7 kg at the composition of 4060, flow rate of 48 liters per minute and the surrounding temperature of 30 oC.
160.00 140.00
Pressure (Psi)
120.00 100.00 80.00 60.00 40.00 20.00 0.00 0
50
100
150
200
250
300
350
400
Time (Minute)
W = 7 kg
W = 6 kg
W = 5 kg
W = 4 kg
W = 3 kg
W = 2 kg
Figure 9: The Difference in Cylinder Pressure of Various Weights at Composition 4060, Surrounding Temperature of 30oC and Flow rate of 48 liter/minute Based on Figure 9, the initial pressure is influenced by the initial weight. For example, at equilibrium condition the pressure levels were 121.98 psi, 126.24 psi, 130.92 psi, 134.64 psi, 141.18 psi and 148.15 psi. This is due to the factor of liquid expansion since the vapor space or ullage volume above the liquid level decreases with the increases in weight or volume. The pressure difference became smaller in whenever further evaporation continues except for the second quarter. For example, at the period of 30 minutes the pressure were 18.16 psi, 23.30 psi, 29.75 psi, 30.69 psi, 36.17 psi and 38.88 psi while at the period of 90 minutes the pressure were 9.57 psi, 10.74 psi, 13.77 psi, 15.24 psi, 18.49 psi and 21.17 psi for the weights of 2 kg to 7 kg. The time required to empty the cylinder was also varied according to the weight, which is 115 minutes, 165 minutes, 230 minutes, 280 minutes, 360 minutes and 380 minutes respectively from weights of 2 kg to 7 kg. This is due to the reasons highlighted before which is at the high filling weight more initial energy is contained by liquid molecules and more wetted area is provided to the system. Hence, since more heat is available in the cylinder then the pressure will decrease slowly. However, the wetted area is not a main factor that contributed into the energy required for evaporation process. Further proof of the previous statement is there was not much difference of pressure level between the weights of 7 kg and 6 kg as illustrated in Figure 2 of liquid temperature. The pressure fall of filling weights are shown in three categories which are higher, medium and lower. The
IJEBEA 13- 115; © 2013, IJEBEA All Rights Reserved
Page 41
Zakaria et al., International Journal of Engineering, Business and Enterprise Applications, 4 (1), March-May, 2013, pp. 35-43
pairings of the filling weights are 7 kg and 6 kg, 5 kg and 4 kg and 3 kg and 2 kg. As the factors that contribute to the presence of the residue amount are reduction of liquid temperature, ice formation, pressure fall, liquid composition and vapor composition then the suggested minimum weight of LPG for the system under study was 5 kg. However, for Malaysian climate the allowed maximum filling weight for the system is approximately 83% as suggested by MS 830 is reasonable and practically accepted. It means that, the optimum weight for the commercial portable cylinder of 50 kg water capacity is 41.5 kg. a.
Residue of Liquefied Petroleum Gas
4.0 3.5 Residue (%)
3.0 2.5 Maximum Filling
2.0 1.5
Minimum Filling
1.0 0.5 0.0 0
1
2
3
4
5
6
7
8
Filling Weight (kg) Figure 10 Residue of LPG of Various Filling Weights at Surrounding Temperature of 30oC, Initial Flow rate of 48 liter/minute and Composition of 4060 The quantity of filling weight into the cylinder also affected the residue amount as shown in Figure 10. Based on the figure, it seems that the residue amount will achieve the minimum percentage of decrease when there is no further decrease in the percentage of residue amount even though the filling weight is further increased into the system under study. It means that the reduction of residue percentage in cylinder become smaller whenever the filling weight is increased. The residue percentage of filling weight of approximately more than 84% (6.72 kg) did not give much difference. Therefore, it may have some inter relationship that could be observed between the residue amount and safety precaution set by the code of practices. This is because the regular maximum filling weight based on Malaysian code relation to surrounding temperature is approximately 83.3% of total cylinder capacity even though the determination is based on LPG density, cylinder capacity, LPG liquid temperature and method of installation. However, the lesser the filling weight contributed to higher percentage of residue. As explained in Section 3.2, when the minimum recommended filling weight which is 5 kg or 62.5%, then the residue amount would be 3.20%. IV. Conclusion The initial weight of liquefied petroleum gas affects the percentage of residue, which decreases when the initial weight increases. This is due to a total initial energy of liquid is proportional to the amount of liquid and the amount of heat supplied to the liquid is influenced by the wetted area, therefore, LPG has a higher liquid temperature and pressure will decrease slowly. Additionally, the larger the wetted area will provide higher pressure in the cylinder. The percentage of residue will achieve a minimum level and very small decrease if filling weight is more than 84%. However, the minimum suggested filling weight is 62.5 percent due to less energy therefore it will contribute into excessive temperature drop. The temperature drop holds the key role as it has a strong impact on cylinder performance. One of the useful methods to analyze heat distribution in a cylinder is based on the dimensionless analysis, which is on the basis of axial and radial flow directions since it will provide a clear picture on the cylinder thermal behavior. The dominant heat derived for the evaporation process is through axial direction compared to radial direction at the regions adjacent to the surface of internal wall. V. Acknowledgements
IJEBEA 13- 115; © 2013, IJEBEA All Rights Reserved
Page 42
Zakaria et al., International Journal of Engineering, Business and Enterprise Applications, 4 (1), March-May, 2013, pp. 35-43
The authors would like to acknowledge Universiti Teknologi Malaysia and Ministry of Higher Education of Malaysia for providing research fund through Vote Number 4F043 to make this study successfully possible. VI. References [1]
K. Mani, and V. Selladurai, “Experimental analysis of a rerigerant mixture as drop-in replacement for CFC 12 and HFC 134a,” Int. Jour. Of Ther. Sc, vol 34, pp. 246-252. 2007.
[2]
M. Fatouh, and M. E. Kafafy, “Experimental evaluation of a domestic rerigerator working with LPG,” Applied Thermal Engineering, vol. 26, pp. 1593-1603. 2005.
[3]
M.A. Ceviz, and F. Yuksel, “Cyclic variations on LPG and gasoline fuelled lean burn SI engine,” Renewable Energy, vol. 31, pp. 1950-1960. 2006.
[4]
R.D. Edwards, “Implications of changes in household stoves and fuel use in China,” Energy Policy, vol. 32, pp.395 – 411. 2003.
[5]
K. Park, M.S. Mannan, Y.D. Jo, J.Y. Kim, N. Keren, and Y. Wang, “Incident analysis of Bucheon LPG filling station pool fire and BLEVE,” Journal of Hazardous Materials, vol. A137, pp. 62-67. 2006.
[6]
A. A. Bilal, and A.A. Salem, “Assessment of LPG as a possible alternative to R12 in domestic rerigeators,” Ener. Conv. and Man, vol. 44, pp. 381-388. 2002.
[7]
S. Isao, F. Kazuyoshi, and Y. Hashimato, “Freezing of a water droplet due to evaporation – heat transfer dominating the evaporation – freezing phenomena and the effect of boiling on freezing characteristics,” International Journal of Refregeration, vol. 25, pp. 226 – 234, 2002.
[8]
A.L. Hanlin, “A review of large scale LNG spills: experiments and modeling,” Journal of Hazardous Materials, vol. A132, pp.119-140, 2006.
[9]
B. Purkayastha, and P.K. Bansal, “An experimental study on HC290 and a commercial liquefied petroleum gas mix as suitable replacements for HFC22,” International Journal of Refrigeration, vol. 21, pp. 3 – 17, 1998.
[10]
Y. Nor Maizura, “Kesan silinder terhadap pengaruh peruwapan GPC dalam silinder domestik,” Tesis Sarjana Muda, Universiti Teknologi Malaysia, 1994.
[11]
S. Ditali, M. Colombi, G. Moreschini, and S. Senni, “Consequence analysis in LPG installation using an intergrated computer package,” Journal of Hazardous Materials, vol. 71, pp. 159 – 177, 2000.
[12]
H. Che Badrul, “Pengukuran secara kualitatif baki gas petroleum cecair,” Tesis Sarjana Muda, Universiti Teknologi Malaysia, 1994.
[13]
Zainal Zakaria, Azeman Mustafa and Lim Teck Peng, “Gas reticulation optimization for domestic sector in Malaysia,” International Journal of Oil, Gas and Coal Technology, vol.2 (4), pp. 365 – 378. 2009.
[14]
Zainal Zakaria and Azeman Mustafa, “The effect of surrounding temperature onto LPG in storage during exhaustion process,” International Journal of Oil, Gas and Coal Technology, vol. 3 (2), pp.170 – 181. 2010.
[15]
Muhammad Noorul Anam. “A study on the effect of insertion system on the evaporation of LPG from commercial storage cylinder,” Universiti Teknologi Malaysia: Masters Thesis, 2002.
IJEBEA 13- 115; © 2013, IJEBEA All Rights Reserved
Page 43