THE EFFECT OF AMYLASE SUPPLEMENTATION WITH LOW-STARCH RATIONS: EFFECTS ON MILK PRODUCTION AND FEED CONSUMPTION
A Senior Project Presented to the Faculty of the Dairy Science Department California Polytechnic State University, San Luis Obispo
By Alfred Eaton December, 2011
© Alfred Eaton
ACKNOWLEDGMENTS Gratitude is extended to Dr. Mark Aseltine, Dr. Bruce Golden- California Polytechnic State University (San Luis Obispo, CA) for their participation in conducting the trial and analyzing the data, Rich Silacci- Cal Poly Dairy Herd Manager (SLO, CA) for animal care and management, Cal Poly Dairy employees (SLO, CA) for animal care and treatment/ control application, DSM Nutritional Products (Basel, Switzerland) for funding and analysis of treatment/ control enzyme activity, Cumberland Valley Analytical Services (Maugansville, MD) for the TMR and Manure analysis, Kings County Dairy Herd Improvement Association (Hanford, CA) for milk weight comparisons to digital machines.
-1-
TABLE OF CONTENTS
Acknowledgments................................................................................................................. - 1 Table of Contents .................................................................................................................. - 2 List of Figures ........................................................................................................................ - 4 List of Tables ......................................................................................................................... - 5 Abstract ................................................................................................................................. - 6 Introduction .......................................................................................................................... - 8 Literature Review ................................................................................................................ - 10 Amylase: The Key to Starch Digestion ............................................................................ - 10 Affects of Amylase on Production and Feed Consumption ............................................ - 10 Materials and Methods....................................................................................................... - 12 Data Collection ................................................................................................................ - 12 Location........................................................................................................................... - 13 Milk Weight. .................................................................................................................... - 14 Total Mixed Ration. ......................................................................................................... - 15 Feed Consumption. ......................................................................................................... - 16 Starch Residual................................................................................................................ - 17 Statistical Analysis. .......................................................................................................... - 17 Results and Discussion ........................................................................................................ - 20 Milk Weight. ................................................................................................................... - 20 Feed Consumption. ......................................................................................................... - 24 Conclusion........................................................................................................................... - 26 -2-
References .......................................................................................................................... - 27 Appendix ............................................................................................................................. - 29 -
-3-
LIST OF FIGURES Figure 1. Cow Age……………………………………………………………………………………………………………….. - 13 Figure 2. Observations for lbs of Milk Production vs. Days In Milk…………………………………….... - 21 Figure 3. The third degree polynomial for lbs of Milk Production vs. Days in Milk……….…….. - 22 Figure 4. Predicted Milk Production by Age for Treatment and Control Effects..................... - 23 Figure 5. Observations of Milk Production by age at observation……………………………………….. - 24 -
-4-
LIST OF TABLES Table 1. Number of Milk Weight Observations by stage and treatment status…………… - 14 Table 2. Ration Analysis.................................................................................................. - 16 Table 4. Least squares means and their standard errors for milking stall position………. - 21 Table 5. Regression coefficients for Lbs of milk production on age of cows at the start of the trial……………………………………………………………………………………………………………….. - 23 Table 6. Least squares mean for rations………………………………………………………………………. - 25 Table 3. Feed Consumption Data................................................................................... - 28 -
-5-
ABSTRACT The objective of this trial was to determine if there was an increase in milk production or a decrease in feed consumption by dairy cattle when fed an exogenous rumen-resistant amylase, named RumiStar. High feed prices have caused dairymen to look for new ways to be more efficient. Commercial feed additives have been proposed as opportunities to improve efficiency. In our study a minimum of eighty multiparous Holstein cows were assigned to each of two pens, with a minimum of forty cows in each. Cows that completed their lactation during the study period were replaced with fresh cows to keep the number of cows in each string at or above 40. The experimental design used was a double-crossover. Ronozyme RumiStar with an amylase activity level of 600 kilo novo units (KNU)/g) was used as the treatment. The targeted dosage of 300KNU/kg of TMR %DM was fed. One pen was designated as the control string, where the cows received the additive carrier, wheat mill run, but no RumiStar at a rate of once per day during a four week period. The second pen was designated and marked as the treatment string and received the carrier, wheat mill run, and the additive RumiStar at a rate of once per day. After a seven day transition, the cows received the treatment and control diets for a minimum of four weeks. After four weeks strings’ diets were switched. Then, about thirty days later the treatment and control strings were switched a second time, and again a third time. Feed allowed and feed refusal was periodically weighed, calculated and recorded throughout the trial. Milk yield was weighed and recorded randomly throughout the trial. In doing so, this allowed for differences to be statically analyzed for milk production, feed consumption, TMR contents, amylase activity level, starch degradation, and manure starch and sugar levels. Statistical analysis was performed using the SAS mixed procedure for lbs of milk production and the SAS GLM procedure for feed consumption in SAS. The results showed that there was no statistically significant difference in the milk production or feed consumption of -6-
dairy cattle that received the treatment rations containing RumiStar. However, further research should be conducted because there was a trend for milk production to have numerical differences in older age cows that were favorable, and there was a corresponding numerical difference of feed consumption of those same cows that was favorable. Key Words: amylase, improve milk production, improve feed consumption
-7-
INTRODUCTION High feed prices, such as corn, coupled with low milk prices, have caused commercial dairies to look for many different ways to reduce costs as an attempt to stay in business. One way many dairymen have tried to be more efficient was to attempt to reduce the input costs of feeding their cows. Because of this feed companies and dairy nutritionists have explored different ways to make dairy cows more efficient by either converting feed more efficiently and in turn producing more milk or enabling cows to convert lower cost feedstuffs into milk. Also, improving performance of dairy cattle can be both beneficial to the economic profitability of the dairymen, and better for the environment, because a greater portion of nutrients may be diverted towards milk or meat production instead of being excreted to the environment (Aseltine, 2011). In the current study we conducted a feed trial that looked at the possible benefits of the addition of an exogenous rumen-resistant amylase feed additive. Amylase has been proposed as an important enzyme that may allow for the improved use of energy stored in starches consumed by dairy cattle. By looking at ways to allow for better utilization of available starches in the diet of dairy cattle it may be possible to increase milk yield while possible improving feed consumption. Previous studies have shown that it is important that the enzyme be rumen-resistant otherwise, the majority will be degraded before it can be used (Hristov et al., 1998). The benefits of exogenous amylase have been explored previously by Ferraretto et al. (2011), Gencoglu et al. (2010), and Klingerman et al. (2009). Their results were such that, more research was needed on the possible benefits of exogenous amylase. Also, the previous research was not conducted with the specific amylase used in this trial. The commercial name of the feed additive product used was Ronozyme RumiStar, which has an enzyme activity level -8-
of 18,370 Kilo Novo Units (KNU)/kg (EC # 3.2.1.1, lot #AUN01024 and lot#AUN01028; DSM Nutritional Products, Basel, Switzerland; Novozymes, Bagsvaerd, Denmark). The objective of this trial was to determine if there was an increase in milk production and efficiency of dairy cattle when fed an exogenous rumen-resistant amylase, named RumiStar.
-9-
LITERATURE REVIEW Amylase: The Key to Starch Digestion In ruminants, amylase is naturally produced in the pancreas, however, exogenous amylase may be added to the diet. Amylase that is produced in the pancreas is sent to the small intestine where it acts on the chyle in the intestines. The purpose of amylase is to break down carbohydrates, namely polysaccharide starch molecules that contain α 1-4 bonds, into glucose molecules. Glucose is the most important source of energy for ruminants. These glucose molecules are acted upon in a process called glycolysis. In glycolysis, a series of ten successive reactions occur where glucose molecules are broken down to provide energy for cells in small amounts and pyruvate. Pyruvate can then be broken down further by two different methods depending on if the environment is aerobic or anaerobic. One being, the process of oxidative phosphorylation is the aerobic method, producing large amounts of energy. The second, takes place in anaerobic conditions, the pyruvate is converted to lactate and produces small amounts of energy. In ruminants both aerobic and anaerobic methods of breaking glucose molecules down is used. The aerobic method is performed in cells throughout different cells in the body. The anaerobic method is performed by rumen microbes because they live in an anaerobic environment and they have no other choice for an energy source. Some cells in the body perform both methods of glucose metabolism, such as when muscle cells are used extensively they are required to anaerobically break down glucose stores. Consequently, none of these processes would be possible without the initial action of the enzyme, amylase. (Jaster, 2007).
Affects of Amylase on Production and Feed Consumption It has been shown that the addition of exogenous amylase to the diet of Holstein dairy cattle has the potential to improve lactation performance (Klingerman et al., 2008) On the other hand, it has been found that feeding an exogenous amylase with a reduced-starch diet produced - 10 -
little improvement (Ferraretto et al., 2010). Although, there is the possibility of achieving improved feed consumption through the use of an exogenous amylase (Gencoglu et al., 2010). However, when exogenous amylase is fed as a feed additive, it has been shown that if the amylase is not “rumen-resistant” the proteases that are present in the rumen will cause the degradation of most of the diet-added amylase (Hristov et al., 1998). To my knowledge there is not any ways to treat or change amylase to make it more rumen-resistant. However, the most practical way to test if a certain enzyme is rumen-resistant, is to feed it to animals, in this case, lactating dairy cows and test the rumen fluids and the fluids in the duodenum to examine the degredation of starches (Hristov et al., 1998).
- 11 -
MATERIALS AND METHODS Data Collection We used an average of eighty-seven multiparous Holstein cows that ranged from 1.95 to 8.90 years old. The cows being used for the experiment were assigned a herd identification number either at birth or when purchased by the dairy. The identification numbers were on both ear tags and an RFID tags on each animal. Animals that had missing ear tags were identified visually and with the RFID tags, and ear tags were replaced at the beginning of the experiment. The cows were assigned to one of two strings, string three or string four, based on age according to the Dairy Comp herd records (Valley Ag Software, 2011). The average age of string three was less than three years of age and the average age of string four more than four and a half years of age. However, there was some overlapping of cow ages between the two strings. The different strings were kept in separate, but adjoining pens over the course of the experiment. The strings were identified, and dairy employees were notified of the experiment and the importance of keeping cows in their respective strings. At random times during the experiment, along with all days on which data were collected, cow numbers were checked in order to ensure cows stayed in their respective strings. One pen was initially assigned to be the control pen, while the other was assigned to be the initial treatment pen for an approximate period of one month starting with a transition period of seven days during which no data were collected. Then the control and treatment string’s rations were switched such that the pen which was receiving the control diet in the previous month then received the treatment diet in the current month and visa versa. This switch was repeated two more times so each pen received both the control and treatment rations twice, resulting in four stages. As cows dried off (stopped lactating) they were removed from the trial. A small number of cows were removed from the experiment because of health issues such as - 12 -
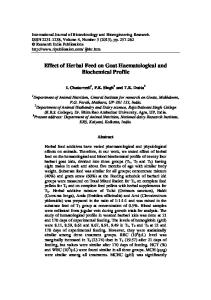
mastitis. Other cows entered the experiment as they freshened. The objective was to maintain approximately the same number of cows in each string. 3500
Cow Age (d old)
3000
2500 String 3 2000
String 4 Sring 3: Average Cow Age
1500
String 4: Average Cow Age
1000
500 7/6/2011
6/16/2011
5/27/2011
5/7/2011
4/17/2011
3/28/2011
3/8/2011
Date Age was Recorded
Figure 1. Cow Ages. Figure 1 shows individual cow ages in d for date on which data were collected for each string, along with trend lines showing average age of each string as the trial progresses.
Location. The experiment was performed at the California Polytechnic University Dairy Unit in San Luis Obispo, California. Data were collected between the eighth of March and the ninth of July in 2011. Cows were housed in a free-stall barn with a concrete floor and an uncovered dirt corral space. The free-stalls were bedded with compost. Cows were fed on a concrete floor and accessed the feed through locking stations. The Cal Poly Dairy milking parlor consists of a double-eight haring-bone configuration. Average Fahrenheit temperature during the experiment was fifty eight degrees with a high of ninety one degrees and a low of thirty four degrees (Weather Underground Inc., 2011).
- 13 -
Milk Weight. Milk weight data were collected by manually recording cow ear tag number, stall number in the milking parlor, and milk weight from a digital milk weight meter (Beco Dairy Automation, Inc., 2007). Meters were calibrated by Beco personnel using average herd milk production data collected from Kings County Dairy Herd Improvement Association (2011). A total of 1,253 milk weight observations were generated for this study. There were more possible data collected, however, due to the use of electronic milking equipment and collecting data by hand, there were some observations that were missing or inaccurate and therefore were discarded. Milk weights were collected randomly, during either/both the morning milking and/or the evening milking shifts, a minimum of six times and a maximum of nine times during each stage of the experiment (Table 1). Table 1. Number of Milk Weight Observations by stage and treatment status
Treatment/ Number of Control Observations
String
Stage
Start Date
3
1
3/8/2011
C
245
2
4/11/2011
T
302
3
5/16/2011
C
277
4
6/13/2011
T
417
1
3/8/2011
T
262
2
4/11/2011
C
311
3
5/16/2011
T
242
4
6/13/2011
C
374
4
- 14 -
Total Mixed Ration. All cows used for the experiment were fed a low-starch total mixed ration (TMR) mainly consisting of a proprietary blend of Milk Cow Grain, Brewer’s Grain, quality Alfalfa, Almond Hulls, and water. There were three different rations used during the experiment, all of which were classified as low-starch rations consisting of no more than 20.1% starch on a dry matter basis, with an average of 17.8 % starch on a dry matter basis. These three different rations were implemented by the dairy manager in order to minimize the cost of feeding the cows. The first ration (R1) contained the aforementioned feedstuffs along with some Sudan hay and was fed to the cows from before the start of the trial through March 25th. Ration two (R2) was fed from March 26th through April 28th and contained the aforementioned feedstuffs without Sudan hay and the addition of a greater amount of brewers’ grain. Brewers’ grain in San Luis Obispo is relatively cheap when compared to other feedstuffs and along with the rise in the cost of hay were the main reasons for the ration changes. The third ration (R3) consisted of the aforementioned feedstuffs along with the addition of Oat Silage and was fed from April 29th through July 7th. The reason for the implementation of this ration was because the dairy had invested in planting Wheat Silage and it was ready to be fed to the cows at the time the ration change was made. Also, there was the fact that a feedstuff that was commissioned to be grown locally for the dairy was cheaper than shipping in other feedstuffs. See Table 2 for ration analysis. One string was fed a low-starch TMR ration with the addition of a “control” top-dressing that consisted of forty pounds of wheat mill run (Cal Poly Feed Mill Unit, SLO, Ca.) while the other string received a low-starch TMR ration with the addition of a “treatment” top-dressing consisting of wheat mill run (Cal Poly Feed Mill Unit), along with Ronozyme RumiStar (EC # 3.2.1.1, lot #AUN01024 and lot#AUN01028) with an activity level of 18,370 Kilo Novo Units - 15 -
(KNU)/kg ( DSM Nutritional Products, Basel, Switzerland; Novozymes, Bagsvaerd, Denmark). Kilo Novo Units are a unit of measurement that DSM Nutritional Products formulated, in order to measure the concentration of amylase enzyme in a ration. In doing so, this allows analysis to ensure prescribed amounts of amylase are being fed to each the control and treatment groups as per the trial. Table 2. Ration Analysis Date
4/5
4/19
5/24
6/8
6/28
7/7
Pen
3
4
4
3
3
4
3
4
4
3
4
3
C
T
C
T
C
T
C
T
C
T
C
T
Dry Matter (%)
56.1
55.5
59.4
63.3
55.4
58.2
56.4
53.6
57.2
55.1
53
54.6
Crude Protein (% DM)
19.2
18.9
19.6
18.4
19.4
19.1
18
17.8
19.2
19.8
20.2
19.5
Starch(% DM)
17.4
15.7
19.3
20.1
18
18.2
17.5
16.2
*
*
*
*
73.7
80.3
74.4
78.9
70
77.1
74.5
76.6
*
*
*
*
Calcium (% DM)
1.01
1.02
1.1
1
1.05
1.02
1.09
1.09
0.97
1.05
1.13
1.1
Phosphorus (% DM)
0.44
0.44
0.56
0.55
0.54
0.51
0.49
0.48
0.57
0.56
0.55
0.53
0.73
0.71
0.77
0.75
0.77
0.76
0.76
0.8
0.75
0.77
0.73
0.77
Control/ Treatment (C/T)
Enzyme Digestibility (7hr.%Starch)
Net Energy Lactation (Mcal/lb) * Data not available.
Feed Consumption. Feed consumption data were collected, for each individual string, by manually recording string number, pounds of TMR fed and pounds of refusal, along with the current number of cows in each string. Pounds of TMR fed was determined through the use of an automated feed system, E-Z Feed (DHI Computing Services Inc., 2011) installed on the dairy’s feed truck. Amount of refusal was determined by manually collecting left-over feedstuffs and using a - 16 -
certified scale to determine its weight. Feed data were collected a minimum of four and a maximum of six times randomly through-out each stage. See Table 3, in Appendix A, for feed consumption data.
Starch Residual. Samples of TMR were taken at random times throughout the experiment and a basic analysis was performed by Cumberland Valley Analytical Services, Inc. (2011), along with starch content percentage on a dry matter basis, and seven-hour in-vetro starch digestibility percentage (see Table 2). Starch digestibility was performed in order to see what percentage of the starch that was fed to the cows was actually able to be broken-down during digestion. Manure samples were collected to determine percent residual starch concentrations as sampled and on a dry matter basis. In turn, this was used to determine if cows receiving exogenous amylase digested starch more efficiently. However, those results will not be presented in this report.
Statistical Analysis. Statistical analysis on the milk weight data was performed using PROC MIXED in SAS (SAS Institute, 2004). The statistical model for pounds of milk was: MILKLBS = α + STRING + POSITION + DIM + DIM*DIM + DAYSSTART + STARTAGE(TandC) + STARTAGE*STARTAGE(TandC) + COW + Error where, MILKLBS was pounds of milk measured on a specific day of the trial at a specific milking; α was the intercept; STRING was the fixed class effect of condition of the pen in which the cows were housed and the feed they received;
- 17 -
POSITION was the fixed class effect of stall position an individual cow had in the milking parlor at a given milking. This was fit to account for inaccurate calibration of the milk weighing equipment; DIM was the fixed linear regression of d since the start of the individual cow’s lactation on MILKLBS; DIM*DIM was the fixed third degree polynomial regression term (i.e., quadratic term) for d since the start of the individual cows lactation on MILKLBS; DAYSSTART was the fixed linear regression of the number of d since the start of the experiment on MILKLBS; STARTAGE(TandC) was the fixed linear subclass regression for age in d at the start of the experiment within the treatment or control ration subclass effect (TandC) on MILKLBS; STARTAGE*STARTAGE(TandC) was the fixed third degree polynomial subclass regression term (i.e., quadratic term) for age in d at the start of the experiment within the TandC subclass effect on MILKLBS; COW was the random effect of the individual animal on MILKLBS; and Error was the random error. Co-Variance of COW and Error was: Var(COW) ~ N(0,σ2) and Var(Error) ~ N(0,σ2) For feed consumption, the GLM procedure in SAS was used (SAS Institute, 2004). The dependent variable of pounds of feed consumed was fit in a model that included date and number of cows in the string as linear regressions. Stage, string, ration and treatment versus control were fit as fixed class effects. Error was the random effect. The statistical analysis on the feed consumption data was performed using the PROC GLM procedure in SAS. The statistical model for pounds of feed consumed was:
- 18 -
LBSEATON = α + DATE + STRING + TandC +TandC(STRING) + NUMCOWS + RATION + TandC*RATION + Error where, LBSEATON was the dependent variable for the pounds of feed consumed by a pen of cows on a specific date; α was the intercept; DATE was the fixed regression effect of date of the experiment on LBSEATON; STRING was the fixed class effect of condition of the pen in which the cows were housed and the feed they received; TandC was the fixed class effect of the treatment or control ration on LBSEATON; TandC(STRING) was the nested fixed effect of TandC within STRING; NUMCOWS was the fixed regression effect of the number of cows observed at each measurement of LBSEATON; RATION was the fixed class effect of the specific ration formulation on LBSEATON; TandC*RATION was the fixed class interaction effect of the treatment or control feed ration with the ration formulation effect on LBSEATON; and Error was the random error term with ~N(0, σ2).
- 19 -
RESULTS AND DISCUSSION Milk Weight. The inverse residual log likely-hood for the model used to analyze milk weight showed there was a statistically accurate estimate of milk production and was 9219.8. The variance of the random effect of cow was estimated to be 65.3033 lbs2, and the variance of residual was estimated to be 75.8568 lbs2. The effect of string that cows were assigned to was not significant (P=0.5972). Therefore, there was not any significant difference in management practices or inputs between the two strings. Milk stall (position) in the parlor was highly significant (P