Research and analysis The economics of global output gap measures
299
The economics of global output gap measures By Misa Tanaka and Chris Young of the Bank’s International Economic Analysis Division.
The United Kingdom is a relatively small, open economy. The Monetary Policy Committee monitors global influences on UK costs and prices as part of its assessment of the outlook for CPI inflation. One suggested measure of these global influences is the global output gap, defined as the deviation of world demand from world potential supply. This article considers the relevance of such a measure in assessing global influences on UK costs and prices. It argues that there are a number of conceptual problems and measurement issues relating to the global output gap. Introduction The overall inflation rate in an economy is ultimately determined by domestic monetary policy. However, measures of the domestic output gap — defined as the gap between aggregate demand and estimated potential supply — can help central banks to assess short-run inflationary pressure. When aggregate demand exceeds estimated potential supply, capacity pressures within firms and within the labour market are likely to build and firms’ costs, such as wages, and final prices would normally increase. A recent Quarterly Bulletin article by Ellis and Turnbull (2007) discusses different ways of measuring the balance between supply and demand in the domestic economy. The United Kingdom is a relatively small, open economy. Consequently, the Monetary Policy Committee (MPC) also monitors global influences on UK costs and prices as part of its assessment of the outlook for CPI inflation. For instance, the MPC examines the prospects for activity and inflation in other countries, which affect the UK economy via a number of channels: demand for UK exports; the prices of UK imports; and the prices of globally traded commodities such as energy and food. The MPC makes this assessment by having discussions with other central banks and official institutions, and monitoring a wide range of overseas data, including official data on output, expenditure, money and credit, retail sales and consumer and producer prices; surveys of households, firms and the financial sector; and projections of global commodity demand and supply. The degree of economic integration between different economies has increased over the past decade.(1) This suggests that global influences on UK costs and prices may have become more important, even though the overall UK inflation rate is still ultimately determined by the MPC. Borio and
Filardo (2007) suggest that in an integrated global economy where many goods can be produced and consumed anywhere in the world, it is the global output gap — defined as the deviation of world demand from world potential supply, and measured by aggregating output gaps across different economies — that should be considered when assessing global influences on domestic inflation. Increasing interest in the global output gap as a concept is reflected in the fact that a number of international institutions, such as the International Monetary Fund (IMF), the Organisation for Economic Co-operation and Development (OECD), and the Bank for International Settlements (BIS), now calculate or refer to a measure of the global output gap. This article critically assesses whether such measures of the global output gap are a sufficient summary statistic of global influences on UK costs and prices.(2) Such a summary statistic could be a useful indicator for policymakers. However, there are a number of conceptual problems and measurement issues relating to the global output gap. Moreover, the appropriate measure of the global output gap may depend on the channels through which the world affects domestic costs and prices. The article is organised as follows. The first section presents measures of the global output gap published by international institutions and briefly reports results from the literature. The second section examines conceptual issues relating to the global output gap. The third section discusses measurement issues. The fourth section concludes.
(1) See for instance Spange and Young (2007). (2) A companion article in this edition of the Quarterly Bulletin (Greenslade, Millard and Peacock (2008)) examines the broader issue of how global integration might influence the dynamic behaviour of UK inflation.
300
Quarterly Bulletin 2008 Q3
Spare capacity in the global economy
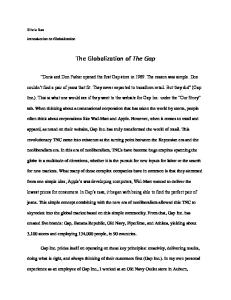
Chart 2 IMF estimate of the global output gap Per cent
The world economy grew strongly over the past four years with global GDP growth, weighted by purchasing power parity (PPP),(1) averaging 4.8% between 2004 and 2007. Industrialising economies, such as China and India, and exporters of commodities, such as the Middle East, Brazil and Russia, contributed significantly to global growth over this period (Chart 1).
Emerging markets
5 4
IMF forecast
3 2 1
+ 0
– 1 2 Global output gap
Chart 1 Contributions to world GDP growth
3
Advanced economies
4
Rest of the world
Middle East
India
Euro area
Brazil
China
United States
Russia
World GDP growth (per cent) Percentage points
1980
83
86
89
92
95
98
2001
04
07
09
5
8
Note: Deviation of actual GDP from estimated potential GDP as a per cent of estimated potential GDP.
7
Source: IMF World Economic Outlook (April 2008).
IMF forecast
6 5
Chart 3 OECD estimate of the OECD output gap Per cent
4 OECD forecast
3
2.0
2
1.5
1
1.0
+ 0 1992
95
98
2001
04
07
10
13
2.5
0.5
–
+
1
0.0
–
Note: World GDP growth is PPP-weighted.
0.5
Source: IMF World Economic Outlook (April 2008).
1.0
The global output gap is an indicator of spare capacity in the world economy, and is measured by the difference between actual output and estimated potential output of the world. Estimates of the global output gap calculated by international institutions suggest that, at a global level, the amount of spare capacity has fallen in recent years. For instance, the estimate of the global output gap published by the IMF (2008) suggests that the global output gap had closed and was very slightly positive by 2007 (Chart 2). The measure of the output gap of the OECD countries published by the OECD (2008) indicates that it had become positive during 2006–07 (Chart 3), broadly consistent with the IMF estimate of the output gap for the advanced economies shown in Chart 2. The BIS (2008) also noted in its latest Annual Report that ‘the ‘gap’ between global supply and demand had been very much reduced by the end of 2007’.
1.5
1990
94
98
2002
06
09
2.0
Notes: GDP-weighted output gaps of OECD member countries, excluding Korea, Mexico, Slovak Republic and Turkey. Deviation of actual GDP from estimated potential GDP as a per cent of estimated potential GDP. Source: OECD Economic Outlook, No. 83.
Chart 4 Consumer price inflation in major industrialised countries up to July 2008 Percentage changes on a year earlier
6
5 United States 4
3 Euro area 2
The fall in these estimates of global spare capacity preceded an increase in consumer price inflation in several major economies over the past twelve months, including in the United Kingdom (Chart 4). That might suggest the global output gap is useful as an indicator of global influences on domestic costs and prices. However, in the empirical literature, there is conflicting evidence over whether global output gap measures help
1
United Kingdom
2004
05
06
07
08
0
Source: Thomson Datastream.
(1) A country’s GDP evaluated at its PPP exchange rate captures the total goods and services produced in the country valued at prices prevailing in the United States, and thus takes into account the differences in the cost of living across countries.
Research and analysis The economics of global output gap measures
explain domestic inflation. Borio and Filardo (2007) find that a global output gap measure helps explain the behaviour of inflation for a range of advanced countries, including the United Kingdom. Ihrig et al (2007), however, find that Borio and Filardo’s results are not robust to plausible alternative inflation equation specifications. Calza (2008) finds little evidence that global output gap measures have predictive power for consumer price inflation in the euro area. This mixed evidence on the link between global output gap measures and domestic inflation is likely to reflect conceptual and measurement issues relating to the global output gap. The remainder of this article explores these two issues in turn.
The link between the global output gap and domestic inflation — conceptual issues Although inflation is ultimately determined by domestic monetary policy, measures of capacity pressure may contain some information about inflation in the short run. Measures of the UK output gap should, in principle, already contain some information about global influences on UK costs and prices. For example, net exports (exports minus imports) are part of measured UK output and therefore strong global demand for goods and services produced in the United Kingdom is included in a measure of the UK output gap. But a global output gap measure might contain additional information regarding the following two global influences on UK costs and prices: • Import prices. A positive global output gap could contain information about future import price inflation. For instance, a positive output gap in the United Kingdom’s major trading partners could signal rising cost pressure in these economies, which could be transmitted to the United Kingdom via higher import prices.(1) • Labour market dynamics. The global output gap may affect the labour market, and potential supply in the domestic economy. For instance, spare capacity overseas could imply a low cost of replacing domestic workers with foreign workers — either via foreign workers relocating to the United Kingdom or UK companies relocating abroad — and thus be associated with weak bargaining power of domestic workers. These effects would make UK labour supply and wages respond to the cyclical position of the world economy. They also imply that, with migrant labour flowing into and out of the domestic labour force, domestic potential output and the domestic output gap are less well defined. These two channels suggest that measures of the global output gap could contain some information about the global influences on UK costs and prices over and above that contained in the domestic output gap. However, there are at
301
least three reasons why the relationship between a measure of the global output gap and UK costs and prices is not straightforward. i. The exchange rate may offset some foreign shocks A positive global output gap need not imply higher inflationary pressure in the United Kingdom, because some foreign shocks that cause a change in the measured global output gap will be offset by movements in the exchange rate. To illustrate this point, suppose that the central bank of a foreign economy, where the output gap is initially zero, eases monetary policy. The monetary expansion initially pushes up on foreign demand relative to supply, creating a positive foreign output gap. But the foreign monetary expansion should also lead to a depreciation of the foreign currency relative to sterling, as the fall in the foreign interest rate reduces the return from holding the foreign currency. That would reduce the sterling price of foreign goods in the short run. In the long run, the increase in the foreign price level should fully offset the initial exchange rate movement, bringing the sterling price of foreign goods back to the original level. This example illustrates that a positive global output gap need not always imply upward pressure on UK costs and prices. It also highlights the importance of forming an understanding of what caused the change in the foreign or global output gap, rather than assuming a mechanical link to domestic costs and prices. ii. Conditions in the UK economy also matter The timing and the extent to which the foreign capacity pressures are passed on to UK firms and consumers in the form of higher costs and prices is likely to depend on conditions in the UK economy. Suppose, for instance, that UK demand is weak when the foreign output gap becomes positive. While foreign producers might wish to raise prices to pass on their rising costs to UK firms and consumers, if UK demand is subdued they might instead choose to reduce their mark-ups temporarily and keep the sterling prices of their products constant. This too suggests that there is no mechanical link between the global output gap and domestic costs and prices. iii. The role of commodity prices is not fully captured The prices of globally traded commodities, such as oil, food and metals, have risen in recent years (Chart 5). For example, the rise in oil and other energy prices is reflected in consumer price inflation in the United Kingdom, United States and the euro area, where energy prices have risen sharply in comparison with non-energy prices (Chart 6). As noted above, the MPC monitors projections of global commodity demand and supply. Since global output growth is a key driver of commodity demand, global growth projections (1) Pain et al (2006) find that in OECD countries global output gap measures do not have any significant impact on domestic consumer price inflation independently from import prices. However, their study does not examine whether global output gap measures help forecast import prices.
302
Quarterly Bulletin 2008 Q3
Chart 5 Commodity prices
350
Brent crude oil price (right-hand scale)
Economist price index — food (left-hand scale)
Economist price index — metals (left-hand scale)
Economist price index — all items (left-hand scale) US$ per barrel
Indices: 2000 = 100
160 140
300
120
250
higher oil prices has been limited with real investment in oil production little changed between 2002 and 2006.(1) Looking ahead, the International Energy Agency (IEA) (2008) projects that Asia, the Middle East and South America will account for almost 90% of global oil demand growth over the next five years, with China and India accounting for almost half of this. This demand growth reflects rising wealth and accelerating energy use in a number of emerging market economies.
100
Chart 7 Chinese annual oil demand and output growth
200 80 150
300
Percentage change on a year earlier
Index: 1995 = 100
12
60 100
40
50
20
0
0 2000
01
02
03
04
05
06
07
250
10
GDP (right-hand scale)
8
200
08 150
6
IEA/IMF forecasts
Source: Thomson Datastream.
100
Chart 6 Cumulative change in CPI subcomponents from January 2004 to July 2008 Energy Non-energy
4
2
50
0 Cumulative percentage changes
Annual oil demand (left-hand scale)
1995 96
97
98
99 2000 01 02
03
04
05
06
07
08
0
120 Sources: IEA, IMF and Bank calculations.
100
Measuring the global output gap
80
60
40
20
In addition to the conceptual issues discussed in the previous section, there are difficulties related to the measurement of the global output gap. First, any estimate of the output gap is subject to considerable uncertainty, but particularly so in the case of emerging market economies. Second, there are questions over how output gaps of different countries should be aggregated to create a global output gap measure.
0 United Kingdom
United States
Euro area
Source: Thomson Datastream.
should contain some information about the prospects for commodity prices — and UK costs and prices. However, measures of the global output gap look at deviations of actual output from an estimate of potential output, and thus only capture the cyclical fluctuation of output around a trend. So while measures of the global output gap may capture the cyclical fluctuation in global commodity demand to some extent, they fail to capture the structural increase in commodity demand associated with the high potential growth of the emerging market economies. Indeed, at least some of the recent increase in commodity demand is likely to reflect structural factors. Chart 7 shows that China’s annual consumption of oil has increased steadily and nearly doubled over the past decade, despite cyclical fluctuations in Chinese output growth. While rapid output growth in China and other industrialising economies has boosted oil demand in recent years, the supply response to
Uncertainty over potential output Measures of the global output gap are typically calculated by weighting together measures of the individual countries’ output gaps, given by the difference between actual and estimated potential output. Conceptually, potential output is the level of output achieved when prices and wages are fully flexible. Since this cannot be directly observed, any estimate of potential output is subject to considerable uncertainty. Potential output may be estimated using a production function approach or a statistical approach, but there are measurement issues associated with both. For the advanced economies, potential output is usually calculated using a production function approach, based on estimates of labour supply, capital stock and total factor productivity.(2) Thus, any output gap measure constructed using this methodology would reflect measurement error for each of these variables. (1) See August 2008 Inflation Report, page 32. (2) See Billmeier (2004) for different approaches to measuring the output gap.
Research and analysis The economics of global output gap measures
Estimating the output gap of an emerging market economy poses additional challenges. There are significant data-quality issues for most emerging market economies. Moreover, due to the lack of reliable data, potential output of an emerging market economy is mostly measured using a statistical technique, such as a Hodrick-Prescott filter, which smoothes its past GDP to construct an estimate of potential GDP. However, such statistical techniques, by extrapolating from past trends, may not capture structural changes in potential output in emerging market economies. Many emerging market economies are undergoing structural changes, making it difficult to gauge how these will affect their potential output. This is illustrated in Chart 8, which shows different vintages of IMF forecasts for Chinese GDP growth over the following five years. Since the IMF has been forecasting that China’s growth stabilises in five years’ time, its forecast for five year ahead growth can be thought to be similar to its estimate of potential output growth. Over time, the IMF has successively revised up its forecasts of Chinese growth in five years’ time: in 2003, 2004 and 2005, GDP growth was expected to stabilise at around 71/@% in five years’ time; in subsequent years, the forecast of GDP growth five years ahead has been revised up, and in the latest forecast it was 10%.(1) Chart 8 Chinese GDP growth and successive IMF forecasts April 2003 April 2004 April 2005
April 2006 April 2007 April 2008 Percentage changes on a year earlier
12
11
10
9
8
303
capacity pressure and what monetary policy regime it has in place. For instance, in countries with an inflation-targeting regime, such as the euro area, monetary policy may provide some offset to incipient demand pressures, with central banks tightening policy before inflation picks up. By contrast, in countries with a nominal exchange rate target, such as China, the direct response of monetary policy to higher inflation may be constrained. Weighting output gaps by GDP or trade shares ignores these potentially significant differences in foreign monetary policy, which can affect the way foreign demand shocks are transmitted to UK costs and prices. ii. The sensitivity of UK demand to price changes of foreign products The sensitivity of UK demand to changes in prices of goods produced in a particular country affects the pricing behaviour of that country’s firms. If a country’s output is not easily substitutable for other imports or domestically produced products, its firms can more easily raise prices in the UK market in response to higher production costs at home. In that case, a positive output gap in that country is likely to have a relatively strong positive impact on UK prices. Global output gap measures using GDP or trade weights do not take this into consideration. To illustrate this, consider the following two cases: I) country A and B, both of which trade with the United Kingdom to the same degree, have zero output gaps; and II) country A has a positive output gap, which is offset by a negative output gap in country B. In both cases, the global output gap — given by the sum of country A and B’s output gaps — would be zero, but they do not necessarily have the same implications for UK costs and prices. In case II), the rising export price of country A may not necessarily be offset exactly by the falling export price of country B if the sensitivity of UK demand to changes in the prices of country A and B’s exports differs.
7
1995
98
2001
04
07
10
13
6 0
Note: The dashed lines are forecasts at that time. Sources: IMF and Thomson Datastream.
Aggregation issues Even if individual countries’ output gaps were accurately estimated it may be problematic to aggregate them using GDP or trade weights to create a single measure of global influences on UK costs and prices. There are at least three issues to consider when aggregating national output gaps to produce a global output gap measure. i. The foreign monetary policy regime The speed with which UK costs and prices adjust in response to a given global output gap may depend on which country has
iii. The global output gap measure should be theoretically founded The global output gap is typically presented without a well-articulated framework of its transmission mechanism to domestic costs and prices. But that is important when thinking about how to aggregate each country’s output gap to construct a global output gap measure. If the hypothesis is that global capacity pressure affects UK costs and prices mainly via its impact on import prices, then using a measure of the trade-weighted global output gap as an indicator of UK inflationary pressure may be informative, subject to the caveats above. An alternative hypothesis is that the main influence of global capacity pressure on UK costs and prices is via the wage-bargaining power of domestic workers. A measure of the global output gap which captures this effect (1) These refer to the April World Economic Outlook forecasts for each year.
304
Quarterly Bulletin 2008 Q3
would need to be constructed in a rather different way. It might, for example, weight the output gaps of neighbouring countries by the size of their labour force, some index of substitutability with domestic labour (eg based on relative education levels), or relative wages.
Second, there are a number of channels through which global economic conditions affect UK costs and prices. For instance, the global output gap may fail to capture a large part of the influences on UK costs and prices coming from increasing commodity demand by emerging market economies such as China and India. This effect derives from the fact that income levels and energy consumption are rising in these countries because actual — and potential — growth is high, and not simply because growth might temporarily be above potential.
This highlights that there is no single ‘right’ measure of the global output gap: whether the measure is ‘right’ or not depends on one’s hypothesis about why the world matters for domestic costs and prices and in practice there will be a number of channels.
Conclusions Strong conclusions about global influences on UK costs and prices cannot be drawn based on a measure of the global output gap alone. In particular, three major health warnings apply to the global output gap. First, foreign capacity pressures cannot be considered separately from the exchange rate, which should offset increases in foreign prices associated with monetary expansion overseas. To assess the degree to which the exchange rate may provide an offset, it is therefore important to try to understand the origin of capacity pressures overseas.
Third, there is a high degree of uncertainty around any estimate of the global output gap, especially because the extent of spare capacity in any country, particularly in emerging market economies, is difficult to gauge. There are also a number of reasons why an aggregate measure of foreign output gaps may not adequately capture global influences on UK costs and prices. Because of these considerations, the global output gap is not a sufficient summary statistic of global influences on UK costs and prices. As such, it is not a substitute for the MPC’s approach of monitoring a wide range of data to assess the prospects for activity and inflation in other countries and recognising that developments overseas can affect the UK economy via a number of channels.
Research and analysis The economics of global output gap measures
305
References Bank for International Settlements (2008), 78th Annual Report 2007/08. Bank of England (2008), Inflation Report, August.
Ihrig, J, Kamin, S B, Lindner, D and Marquez, J (2007), ‘Some simple tests of the globalization and inflation hypothesis’, Board of Governors of the Federal Reserve System International Finance Discussion Paper no. 891.
Billmeier, A (2004), ‘Ghostbusting: which output gap measure really matters?’, IMF Working Paper, WP/04/146.
International Energy Agency (2008), Medium-Term Oil Market Report, July.
Borio, C and Filardo, A (2007), ‘Globalisation and inflation: new cross-country evidence on the global determinants of domestic inflation’, BIS Working Paper no. 227.
International Monetary Fund (2008), World Economic Outlook, April.
Calza, A (2008), ‘Globalisation, domestic inflation and global output gaps’, ECB Working Paper no. 890. Ellis, C and Turnbull, K (2007), ‘Gauging capacity pressures within businesses’, Bank of England Quarterly Bulletin, Vol. 47, No. 1, pages 79–85. Greenslade, J, Millard, S and Peacock, C (2008), ‘How has globalisation affected inflation dynamics in the United Kingdom?’, Bank of England Quarterly Bulletin, Vol. 48, No. 3, pages 292–98.
Organisation for Economic Co-operation and Development (2008), OECD Economic Outlook, No. 83. Pain, N, Koske, I and Sollie, M (2006), ‘Globalisation and inflation in the OECD economies’, OECD Economics Department Working Paper no. 524. Spange, M and Young, C (2007), ‘The macroeconomic impact of globalisation: theory and evidence’, Bank of England Quarterly Bulletin, Vol. 47, No. 1, pages 40–47.