The Cost of Scaling Up TB Services in Central Java, Indonesia September 2013
Management Sciences for Health 784 Memorial Drive Cambridge, MA 02139, USA
This report was made possible through the support for the TB CARE I provided by the U.S. Agency for International Development (USAID), under the terms of cooperative agreement number AID-OAA-A-1000020. Abstract Indonesia has made great strides in expanding Tuberculosis (TB) control over the last few years, with significant assistance from donors, such as the Global Fund against Acquired Immune Deficiency Syndrome (AIDS), TB and Malaria (GFATM) and the United States Agency for International Development (USAID). While there are presently substantial external funds for the TB program, these are likely to diminish greatly over the coming years, due to improvements in the Indonesian economy. The government is developing an exit strategy which aims to eliminate dependency on these grants and which focuses on increasing government budget allocations, generating revenue from insurance and corporate social responsibility financing, and improving cost-effectiveness and efficiency. Projections of service delivery costs at both national and sub-national levels are essential for this strategy to be successful. To develop such cost projections for TB services a tool was developed and was used in Central Java, a province with around 32 million people. A total of 39,854 TB cases were treated in Central Java in 2011 and this is targeted to increase to 42,269 in 2014 and to 44,043 in 2016. The number of MDR-TB cases treated is targeted to increase more significantly, from 39 in 2011 to 405 in 2014 and to 523 in 2016. Based on these treatment assumptions the approximate direct and indirect service delivery costs of the recurrent resources needed in 2014 would be United States Dollars (USD) 12.8 million excluding inflation (USD 9.6 million for TB cases and USD 3.2 for MDR-TB cases). This would increase to a total of USD 14.0 million in 2016 excluding inflation. The average unit cost for a TB patient who started treated in 2014 would be USD 227, the average cost per case successfully treated would be USD 252 and the average cost per case cured would be USD 274. The average unit cost for an MDR-TB patient who started treated in 2014 would be USD 7,967 and the average cost per case successfully treated and cured would be USD 10,622. The average cost per capita would be 38 US cents per capita. This can be compared with the economic burden of TB in Indonesia, which is over USD 8 per capita, indicating that investment in TB treatment is worthwhile. The results indicate that only about 1% of the resources are currently allocated to case detection and, it would be worth assessing if this is sufficient. The costs are based largely on the use of standard prices, as well as some budget figures that were obtained from a small sample of districts and facilities. They represent the estimated operating resources required to provide good quality services. They only cover service delivery and district management costs including indirect costs, and do not include any additional costs related to TB/ Human Immunodeficiency Virus (HIV). The costs are probably underestimates of the total resources required to achieve the NTP’s treatment targets, but those targets are quite ambitious, especially for MDR-TB, and from that respect the costs could be overestimates. Due to these factors and the small sample of districts and facilities that was used for a few of the costs the results should, be regarded as indicative and more suited for policy and planning purposes rather than for detailed budgeting.
The Cost of Scaling Up TB Services in Central Java
2
September 2013
Recommended Citation This report may be reproduced if credit is given to TB CARE I. Please use the following citation: Jarrah, Z., Collins, D. and Hafidz, F. September, 2012. The Cost of Scaling Up TB Services in Central Java, Indonesia. TB CARE I Project – Management Sciences for Health. Submitted to USAID by the Tuberculosis CARE I (TB CARE I) Program: Management Sciences for Health. Information shown in the body of the report and annexes may not be quoted or reproduced separate from the rest of the document without the written permission of Management Sciences for Health. Key Words TB, MDR-TB, costing, scale-up, Global Fund, exit strategy, sustainability, sub-national. Disclaimer The authors’ views expressed in this publication do not necessarily reflect the views of the United States Agency for International Development or the United States Government. Cover page photo Authors interviewing staff in the Multi-Drug Resistant Tuberculosis (MDR-TB) ward at Moewardi Hospital, Surakarta, Indonesia. Photo by David Collins. Management Sciences for Health 784 Memorial Drive Cambridge, MA 02139 Tel: +1(617) 250.9500 Fax: +1(617) 250.9090
The Cost of Scaling Up TB Services in Central Java
www.msh.org
3
September 2013
Contents ACRONYMS.............................................................................................. Error! Bookmark not defined. ACKNOWLEDGEMENTS.......................................................................................................................6 RINGKASAN EKSEKUTIF (Bahasa Indonesia) ........................................................................................7 EXECUTIVE SUMMARY (English Language)........................................................................................10 1.
INTRODUCTION........................................................................................................................12
2.
METHODOLOGY .......................................................................................................................13 Costing model ..............................................................................................................................13 Standard treatment, price and cost inputs ....................................................................................15
3.
TREATMENT ASSUMPTIONS .....................................................................................................16
4.
RESULTS ..................................................................................................................................20
5.
FINDINGS .................................................................................................................................26
6.
LIMITATIONS ...........................................................................................................................27
7.
FUTURE ACTIONS .....................................................................................................................28
ANNEXES .........................................................................................................................................29 Annex 1: Cost calculation methods ..............................................................................................30 Annex 2: Facilities and District Offices included in the sample (Central Java)..................................31 Annex 3: Numbers of Public Facilities that Provide TB Services (Central Java) ................................32 Annex 4: References ....................................................................................................................33
The Cost of Scaling Up TB Services in Central Java
4
September 2013
ACRONYMS AIDS CBO CSO DOTS FDC GF HBC HIV HR ISTC KNCV MDR-TB MOH MSH NTP TB TB CARE I TBCTA USAID WHO XDR-TB
Acquired Immune Deficiency Syndrome Community-Based Organization Civil Society Organization Directly Observed Therapy, Short-course (the Internationally Recommended Standard for Tuberculosis Control) Fixed Dose Combination Global Fund High TB Burden Country Human Immunodeficiency Virus Human Resources International Standards for Tuberculosis Care Koninklijke Nederlandse Centrale Vereniging tot bestrijding der Tuberculosis Multi-Drug Resistant Tuberculosis Ministry of Health Management Sciences for Health National Tuberculosis Control Program Tuberculosis Tuberculosis CARE I Program Tuberculosis Coalition for Technical Assistance United States Agency for International Development World Health Organization Extremely Drug-Resistant Tuberculosis
The Cost of Scaling Up TB Services in Central Java
5
September 2013
ACKNOWLEDGEMENTS This study is the result of a collaborative effort by the Indonesian Ministry of Health National Tuberculosis Program (NTP) and the United States Agency for International Development (USAID), through the TB CARE I Project. Many thanks are due to Dr. Dyah Mustikawati, Director of the NTP, for facilitating the study and providing her support, guidance and invaluable comments. The authors of this report are Zina Jarrah, David Collins, and Firdaus Hafidz. Zina Jarrah is a Senior Technical Officer and David Collins is a Senior Principal Technical Advisor in Health Financing, both at Management Sciences for Health (MSH). Firdaus Hafidz is lecturer at University of Gadjah Mada, Indonesia. Support was provided by Andy Marsden and Julie Rostina of MSH, Dr. Salim Hamid, Linda North, Attin Utoro, Roni Chandra, and Tiar Salman of Koninklijke Nederlandse Centrale Vereniging tot bestrijding der Tuberculosis (KNCV), and Dr. Laxmi Zahara an independent consultant. Information for this study was gathered from a sample of hospitals, health centers, and district health offices in Central Java. Many thanks are due to Dr. Anung Sugihantono, Provincial Health Office Director of Central Java for inviting us to conduct the work and facilitating its implementation. Also thanks are due to Endang Nuraini, Provincial TB Coordinator for facilitating the work at the provincial level. A special thanks is due to Ratna Ekasar, Surakarta District TB Coordinator for KNCV, for arranging all data collection visits, and participating in a number of the visits herself. Also thanks to Morita Sari for assisting with the data collection and interpretation. Additional thanks are due to the many other people who provided data on Indonesia’s TB program and expenditures and whom are too numerous to list here.
The Cost of Scaling Up TB Services in Central Java
6
September 2013
RINGKASAN EKSEKUTIF (Bahasa Indonesia)
Indonesia merupakan salah satu negara dengan beban TB terbesar di dunia. Besarnya jumlah penduduk Indonesia yang mencapai lebih dari 240 juta jiwa. Beban ekonomi yang ditanggung oleh negara sangat signifikan – USD 2 milyar terkait dengan jumlah orang yang terinfeksi TB pada tahun 2011-. Meskipun menghadapi banyak tantangan, Indonesia telah melakukan kemajuan besar dalam menanggulangi TB. Telah dilakukan berbagai upaya oleh Program Pengendalian Tuberculosis Nasional, Kementerian Kesehatan (NTP) dan dengan dukungan dari para donor, terutama Global Fund against AIDS, TB and Malaria (GFATM) dan United States Agency for International Development (USAID). Dukungan dana dari Donor, bagaimanapun diperkirakan akan berkurang pada beberapa tahun mendatang akibat dari membaiknya ekonomi Indonesia. Namun di sisi lain, diperlukan perhatian yang besar bahwa hal ini dapat menyebabkan hambatan atau bahkan akan mengalami kemunduran, jika tidak tersedia dana yang adekuat. Oleh sebab itu Pemerintah Indonesia tengah mengembangkan exit strategi jangka panjang yang bertujuan untuk mengeliminasi ketergantungan terhadap dana donor dan fokus untuk meningkatkan alokasi-alokasi anggaran pemerintah, mengembangkan pendapatan dari asuransi dan pembiayaan tanggung jawab sosial perusahaan (corporate social responsibility/CSR) serta meningkatkan efektifitas biaya (cost effectiveness) dan efisiensi. Dalam rangka memfasilitasi pengembangan dan implementasi exit strategy untuk TB, diperlukan pemahaman yang lebih baik terhadap biaya yang terjadi saat ini dan yang akan datang, sehingga kebutuhan dana domestik dapat disediakan serta dapat diidentifikasikannya area-area dimana efisiensi dan efektivitas biaya kemungkinan bisa tercapai. Pendampingan teknis kepada NTP dalam menganalisa dan memproyeksikan biaya, telah dikembangkan sebuah alat penghitungan biaya yang sederhana, mudah digunakan (user friendly) untuk digunakan oleh pengelola program di tingkat nasional, provinsi dan kabupaten/ kota. Alat tersebut dikembangkan atas permintaan dari NTP yang disebabkan oleh tidak tersedianya alat yang cocok untuk dipergunakan di provinsi dan kabupaten, dan alat tersebut telah di uji cobakan di Provinsi Jawa Tengah, provinsi yang cukup besar dengan jumlah penduduk sebesar 32 juta jiwa. Asumsi-asumsi yang digunakan dalam alat ini adalah berdasarkan jumlah aktual dari pelayanan yang disediakan pada tahun 2011, 2012, dan 2013 dan target pada pada tahun-tahun berikutnya. Harga dan biaya satuan (unit cost) didasarkan pada data pengeluaran sebenarnya dari beberapa sampel fasilitas kesehatan, dinas kesehatan kabupaten dengan menggunakan biaya yang normatif. Berdasarkan data yang telah diambil, insidensi TB akan berkurang secara bertahap setiap tahunnya, sedangkan angka temuan terus bertambah. Efek dari perubahan ini menjadi minimal dengan meningkatnya jumlah penduduk dan hasilnya akan diproyeksikan meningkat dalam hal jumlah penanganan kasus dari 39.854 pada tahun 2011, 42.269 pada tahun 2014, dan 44.043 pada tahun 2016. Target dari MDR-TB juga diasumsikan meningkat, baik dari jumlah deteksi dan penanganan kasus dari 39 pada tahun 2011, 405 pada tahun 2014, dan 523 pada tahun 2016.
The Cost of Scaling Up TB Services in Central Java
7
September 2013
Berdasarkan atas asumsi-asumsi terhadap kejadian dan penanganan ini, perkiraan biaya rutin dibutuhkan provinsi untuk mencapai targetnya pada tahun 2014 adalah USD 12,8 juta tidak termasuk inflasi ( USD 9,46 juta untuk kasus TB dan USD 3,2 juta untuk kasus MDR-TB). Hal ini akan meningkat menjadi total USD 14 juta pada tahun 2016 tidak termasuk inflasi. Biaya pelayanan dari MDR-TB merupakan biaya seluruh perawatan, yang dapat mencapai 3 tahun. Angka di atas belum termasuk beban biaya orang yang membantu pasien, namun, berdasarkan data tahun 2011, dengan biaya USD 42 per bulan per pasien, total beban biaya orang yang membantu pasien untuk seluruh pasien MDR-TB pada tahun 2014 sebesar USD 405.242. Perlu diperhatikan bahwa biaya ini terjadi selama 2 tahun atau lebih. Dalam hal komponen biaya program pada tahun 2014, USD 4,7 juta (37%) akan diperlukan untuk kegiatan perawatan pasien, USD 3,9 juta (31%) untuk pengobatan (obat TB & MDR-TB) dan USD 3,1 juta (25%) untuk diagnosis . Angka-angka ini termasuk biaya tidak langsung sekitar 32% dari total biaya. Dalam hal total biaya langsung dan tidak langsung, 50% akan dikelola di tingkat puskesmas, 45% di tingkat rumah sakit dan 4 % di tingkat dinas kesehatan kabupaten/ kota. Biaya rata-rata per kasus TB yang dirawat pada tahun 2014 sebesar USD 227, biaya rata-rata per kasus yang berhasil diobati sebesar USD 252 dan biaya rata-rata per kasus sembuh sebesar USD 274. Biaya rata-rata kegiatan diagnosis dan pengobatan untuk pasien TB-MDR yang mulai dirawat pada tahun 2014 sebesar USD 7.967 dan biaya rata-rata per kasus yang berhasil diobati dan disembuhkan sebesar USD 10.622. Biaya satuan pengobatan MDR-TB jauh lebih tinggi daripada biaya satuan TB, terutama karena durasi pengobatan yang lebih lama dari 24 bulan atau lebih dan biaya yang lebih tinggi dari obat-obatan Biaya rata-rata pengobatan per pasien TB lini pertama yang berhasil diobati sebesar USD 254 pada tahun 2011. Nilai tersebut sedikit di bawah nilai tengah dari rentang USD 100 sampai USD 500 yang diidentifikasi oleh WHO untuk sebagian besar negara beban tinggi TB. Biaya per pasien untuk pengobatan TB-MDR sebesar USD 7.968 juga dalam rentang perkiraan biaya di negara lain. Sebuah analisis yang lebih mendalam bagaimanapun sangat diperlukan untuk membuat perbandingan yang lebih berarti. Biaya rata-rata per kapita pada 2014 sebesar 38 sen USD per kapita . Hal ini dapat dibandingkan dengan beban ekonomi TB di Indonesia , yang lebih dari USD 8 per kapita, menunjukkan bahwa investasi dalam menemukan dan mengobati TB sangat bermanfaat. Angka-angka di atas tidak termasuk biaya untuk kegiatan penemuan kasus aktif, hanya penelusuran kontak , karena hal ini tidak dilakukan di provinsi ini . Hasil penelitian menunjukkan bahwa 1 % dari sumber daya yang dialokasikan untuk deteksi kasus dan itu perlu dilakukan peninjauan kembali untuk melihat kecukupannya. Biaya total yang sebagian besar didasarkan dengan menggunakan harga standar, serta beberapa anggaran yang diperoleh dari sampel fasilitas. Oleh karena itu, estimasi biaya sumber daya yang The Cost of Scaling Up TB Services in Central Java
8
September 2013
diperlukan untuk menyediakan layanan yang berkualitas baik untuk sejumlah target orang dengan TB dan MDR – TB, dapat berbeda dalam beberapa kasus dari pengeluaran yang sebenarnya. Biaya yang diperhitungkan hanya dari sisi penyedia pelayanan kesehatan dan tidak memperhitungkan biaya tambahan yang terkait dengan TB anak, TB / HIV atau XDR - TB. Mereka juga tidak termasuk biaya modal, provinsi dan biaya program nasional, atau orang yang membantu pasien atau biaya pasien dan tidak mencakup semua biaya operasional dan biaya administrasi. Karena keterbatasan ini dan lainnya, hasil angka yang dihasilkan oleh studi ini mungkin lebih rendah dari estimasi total sumber daya yang dibutuhkan seharusnya, karena itu, alat ini lebih cocok untuk tujuan kebijakan dan perencanaan, bukan untuk penganggaran secara rinci.
The Cost of Scaling Up TB Services in Central Java
9
September 2013
EXECUTIVE SUMMARY (English Language)
Indonesia is one of the countries with the largest TB burden in the world, mainly due to Indonesia’s population of more than 240 million people. The economic cost of TB to the country is significant – USD 2 billion, for example, relating to the people who developed active TB in 2011. Acknowledging this burden, Indonesia has made great progress in combatting the disease, thanks largely to the efforts of the National Tuberculosis Control Program (NTP) and with considerable assistance from donors, primarily the Global Fund against AIDS, TB and Malaria (GFATM) and the United States Agency for International Development (USAID). Donor funding is, however, expected to diminish over the coming years due to improvements in the Indonesian economy and there are concerns that progress in tackling TB can be hampered, or even reversed, if adequate funding is not provided. The Government of Indonesia is, therefore, developing a long-term exit strategy which aims to eliminate dependency on donor funding. It plans to increase government budget allocations, generate additional revenue from insurance and corporate social responsibility financing, and improve the cost-effectiveness and efficiency of TB services. To facilitate the development and implementation of the exit strategy for TB, it is necessary to have a good understanding of the cost of current and future services at all levels so that the necessary domestic funding can be provided and areas can be identified where greater efficiency and cost-effectiveness might be achieved. To assist the NTP to analyze and project service delivery costs, a simple, user-friendly costing tool was developed for use by national, district and provincial program managers. The tool was developed at the request of the NTP because there was no existing tool suitable for sub-national levels, and it was tested in Central Java, a large province with 32 million people. The assumptions used in the tool were based on actual numbers of services provided in 2011 and 2012 and targets for the following years. Some prices and unit costs were based on actual expenditure data from a small sample of facilities and district offices and others were based on normative costs. The incidence rates for TB are expected to reduce slightly each year and the treatment rates are expected to increase slightly. The net effect of these changes will be offset slightly by population increases and the result will be a projected increase in the number of treated TB cases from 39,854 in 2011 to 42,269 in 2014 and to 44,043 in 2016. The targets for MDR-TB also assume increases in numbers of cases detected and treated - from 39 in 2011 to 405 in 2014 and to 523 in 2016. Based on these incidences and treatment assumptions the approximate cost of the recurrent resources needed for the province to reach its targets in 2014 would be United States Dollars (USD) 12.8 million excluding inflation (USD 9.6 million for TB cases and USD 3.2 million for MDR-TB cases). This would increase to a total of USD 14.0 million in 2016 excluding inflation. These MDR-TB costs are for the full cost of treatment, which would be incurred over 3 years.
The Cost of Scaling Up TB Services in Central Java
10
September 2013
Patient enabler costs are not included in the above figures, but, based on the 2011 rate of USD 42 per month per patient, would amount to a total of USD 405,242 for MDR-TB patients who started treatment in 2014. Note that these costs are incurred over 2 or more years. In terms of program components in 2014, USD 4.7 million (37%) would be needed for patient monitoring, USD 3.9 million (31%) for treatment (medicines) and USD 3.1 million (25%) for diagnosis. These figures include indirect costs which would be around 32% of total costs. In terms of total direct and indirect costs, 50% would be managed at the health center level, 45% at the hospital level and 4% at the district health office level. The average cost per TB case treated in 2014 would be USD 227, the average cost per case successfully treated would be USD 252 and the average cost per case cured would be USD 274. The average cost of diagnosis and treatment for an MDR-TB patient who started treated in 2014 would be USD 7,967 and the average cost per case successfully treated and cured would be USD 10,622. The unit cost of treating MDR-TB is much higher than the unit cost of TB, primarily because of the longer treatment period of 24 months or more and the higher cost of medicines. The average cost of USD 254 per first-line TB patient successfully treated in 2011 falls a little below the middle of the range of USD 100 to USD 500 identified by the World Health Organization (WHO) for most high-burden countries. The cost per patient treated for MDR-TB of USD 7,968 is also within a range of costs estimated in other countries. A more in-depth analysis would, however, be required to make meaningful comparisons. The average cost per capita in 2014 would be 38 US cents per capita. This can be compared with the economic burden of TB in Indonesia, which is over USD 8 per capita, indicating that investment in detecting and treating TB is worthwhile. The above figures do not include the cost of active case detection, only contact tracing, since this is not carried out in the province. The results indicate that 1% of resources are being allocated to case detection and it would be worth reviewing to see if that is adequate. The total costs are based largely on the use of standard prices, as well as some budget figures that were obtained from the sample of facilities. They, therefore, mainly represent the estimated cost of the resources required to provide good quality services to the target numbers of persons with TB and MDRTB, which may be different in some cases from actual expenditures made. The figures only cover provider costs and do not take into account additional costs related to childhood TB, TB/HIV or Extremely Drug-Resistant Tuberculosis (XDR-TB). They also do not include capital costs, provincial and national program costs, community-based service costs, or patient enablers or patient costs and they may not include all operating and administrative costs. Due to these and other limitations, the figures provided by this study are probably underestimates of the total resources
The Cost of Scaling Up TB Services in Central Java
11
September 2013
required to reach the targets and should, therefore, be regarded as indicative and more suited for policy and planning purposes rather than for detailed budgeting.
1. INTRODUCTION With an estimated 370 to 540 thousand TB cases in 2010, Indonesia is one of countries with the largest TB burden in the world 1. This is largely due to Indonesia’s sizeable population of more than 240 million people. TB prevalence in Indonesia is estimated at 289 per 100,000 people, and the country has been categorized by the World Health Organization as one of twenty-two High TB Burden Countries (HBCs). TB has a high impact on society as well as on families - the economic burden of TB relating to people who developed active TB in 2011 is estimated at around USD 2 billion2, which comes to 0.25% of the GDP of around USD 800 billion 34. The high TB burden and difficulties of geographic access in Indonesia have posed significant challenges to controlling TB. Out of the existing 482 districts in Indonesia, 138 are officially recognized by the government as underserved districts, mostly in remote areas. Other access challenges exist among the urban poor. Decentralization was implemented in 2001, and this had a large impact on the national health system. Districts were given full discretion in prioritizing sectors for development and, in some cases, there has been low commitment from local governments towards health funding in general, and TB in particular, resulting in sub-optimal implementation of Directly Observed Therapy (DOTS) and inadequate human resources (HR) 5. Other major challenges relate to MDR-TB, where a high defaulter rate and the irrational use of second-line drugs have contributed to an increased number of cases. Despite these challenges, Indonesia has made great progress in combatting TB. Treatment protocols, based on international standards (ISTC), have been rolled out nationally, and the diagnosis and treatment of MDR-TB has started in several provincial hospitals. Specific guidelines have been developed for internal and external linkages among hospitals, clinics and DOTS providers; as well as for TB-HIV. The use of fixed dose combination drugs (FDCs) has been expanded to all provinces. Cutting edge diagnostic technology, such as GeneXpert for MDR-TB, has recently become available in some sites. Indonesia’s progress in expanding TB control over the last few years was made through the commendable efforts of the National Tuberculosis Control Program (NTP), together with considerable assistance from donors, primarily the Global Fund against AIDS, TB and Malaria (GFATM) and the United States Agency for International Development (USAID).
1
Global tuberculosis control: WHO report 2011. Available at: http://www.who.int/tb/publications/global_report/en/ The Economic Burden of TB in Indonesia. 2012. 3 Based on a figure of 450,000 new cases each year. 4 2011 per World Bank. 5 WHO Indonesia Country TB Profile. Available at: http://www.searo.who.int/en/Section10/Section2097/Section2100_14798.htm 2
The Cost of Scaling Up TB Services in Central Java
12
September 2013
The WHO TB World Report estimates that 26% of all TB control funding in Indonesia came from domestic sources in 2012, whereas the large majority, 74%, was supplied by the GFATM. These findings are particularly significant when compared with other high TB burden countries. For example, the proportion of funding from domestic sources in India, China and South Africa for TB control is 62%, 69% and 100%, respectively. While there are presently substantial external funds for the TB program, these are expected to diminish over the coming years due to reductions in Global Fund grants following improvements in the Indonesian economy. The government is developing a long-term exit strategy which aims to eliminate dependency on these grants and which focuses on increasing government budget allocations, generating revenue from insurance and corporate social responsibility financing, and improving costeffectiveness and efficiency. 6 There is a need to have a better understanding of the current and future cost of the TB program so that adequate funding can be provided and allocated to different service levels and inputs as well as to different program components. Understanding the costs will also help to identify areas where greater efficiency and cost-effectiveness can be achieved. For this reason a TB costing model was developed to estimate and project the costs of TB service delivery. The intention is for the tool to be used at sub-national, as well as, national levels and it was decided to develop and test it in Central Java province.
2. METHODOLOGY
Costing model
The TB Services Costing Tool was developed in Microsoft Excel for use primarily by sub-national program managers and was designed to be as simple and user-friendly as possible 7. The tool analyzes program costs based on the national TB detection and treatment algorithm, which comprises the following components: Case Finding, Diagnosis, Treatment, Treatment Monitoring, and
6
Collins, D and A. Parihatin. 2011. Indonesia National Tuberculosis Program: Planning for Financial Sustainability. Management Sciences for Health. USAID/TB CARE I. 7 The design of the tool took into account elements of the WHO TB Planning and Budgeting Tool. This WHO tool is used at the national level in Indonesia, mainly for GFATM grant planning. It was tested previously by the NTP at sub-national level, and they decided that it is not suitable at that level as it contains a lot of program cost elements that are not relevant. In addition, it does not automatically relate all costs to variables (e.g. supervision to numbers of facilities), and it does not separate clearly capital and recurrent costs, or TB and MDR-TB costs.
The Cost of Scaling Up TB Services in Central Java
13
September 2013
Other TB Program Activities (which includes activities such as TB-related meetings and trainings). The algorithm was based on the ISTC (International Standards of TB Care). 8 The tool has space for 11 years of data although more years can be added. Ideally the first 3 years should be used for actual numbers of treatments and costs and the remaining years for projections. The user can, however, select fewer actual and fewer projected years. The tool produces total TB program costs, cost per case treated and cured, cost per program element, and cost per resource type (staff, medicines, etc.). Results can be shown with or without inflation. It uses several key inputs, including: • Population data • Epidemiological, notification and treatment assumptions • Numbers of districts managing TB programs • Numbers of facilities and communities treating TB • Types of staff and amounts of time required • Quantities of consultations and tests • Quantities of medicines and laboratory reagents • Salaries and prices of medicines, reagents etc. • Indirect costs The tool uses a bottom-up approach (also known as micro-costing). This is done by determining first the standard direct costs associated with each component of the TB treatment algorithm. For example, the cost of diagnosing TB using sputum smear is based on the recurrent costs of the labor and reagents required for analyzing one sputum smear. This unit cost is then multiplied by the total number of expected sputum smears needed. Prevention and promotion, case detection and supervision and management costs are based on the numbers of facilities and staff that provide TB services. The total direct TB diagnosis and treatment costs (medicines, tests, clinical staff salaries, treatment monitoring costs, etc.) are multiplied by the number of TB cases treated to arrive at a total direct cost. Thus, the higher the case detection rate, the greater the number of TB cases that will be treated, and so the total direct costs will increase. Indirect costs relating specifically to TB, such as management, supervision and meetings, are entered separately and do not increase with numbers of patients. Overall district office and facility indirect costs are allocated as a percentage of total direct costs and, thus, increase in proportion to the direct costs. The costs relate to the diagnosis and treatment of the patients who start treatment in each year. In the case of TB, where treatment takes 6 months, this means that, on average, the costs of diagnosis and treatment for patients who start treatment in a year add up to the total costs incurred in one budget 8
Tuberculosis Coalition for Technical Assistance. International Standards for Tuberculosis Care (ISTC). The Hague: Tuberculosis Coalition for Technical Assistance, 2006.
The Cost of Scaling Up TB Services in Central Java
14
September 2013
year. The costs of treating MDR-TB patients are, however, different. MDR-TB patients should be under intensive treatment for 6 months and then a minimum of 18 months for continuation treatment. Continuation treatment could extend from 18 to 24 months where cases are chronic with extensive pulmonary damage. For simplicity 24 months was used in the tool, which may result in a slight underestimation of the cost. Since MDR-TB treatment takes a minimum of 24 months, the total costs of MDRTB treatment are spread over three budget years. For example, for an MDR-TB patient who is diagnosed and starts treatment halfway through 2013, roughly 6 months of costs would be incurred in 2013, 12 months of costs would be incurred in 2014 and 6 months of costs would be incurred in 2015 (assuming 24 months of treatment). However, also in 2013, 12 months of costs would be incurred for patients who started treatment in 2012 and 6 months of costs would be incurred for patients who started treatment halfway through 2011. Thus for MDR-TB cases, the full treatment costs for one cohort of MDR-TB cases who start treatment in a year are shown under that year in the model but those costs are actually incurred over three budget years. The tool estimates recurrent costs only, since these match with annual government budgets and they can be also projected automatically based on key assumptions, like numbers of treatments. Capital costs can be added separately if required. This first version of the tool does not take into account any additional costs related to TB/HIV and XDR-TB services 9. MDR-TB patient enabler costs can be included in tool but the there is no section for costs incurred by patients. Our normal practice would be to test the model with actual expenditure data. It is not currently feasible, however, to compile total actual TB expenditure because the information is fragmented between the different levels of government and between the government and donors, and the data are not aggregated at provincial or national levels. This should be feasible in future if District Health Accounts are fully implemented. The tool does not have any automated links between treatment or cure rates and incidence rates. In other words there is no automatic reduction in the incidence rate based on an increase in the number of people treated and cured. Changes in incidence rates are, therefore, based on the judgment of the TB program managers.
Standard treatment, price and cost inputs
The figures used in the model reflect public sector costs and do not take into account any additional private sector costs. The TB diagnosis and treatment costs used standard drug, supply, and laboratory reagent prices provided by KNCV and the TB-CARE I Project in Indonesia (see Annex 1 for the calculation methods). Additional cost and budget data were collected from a sample of facilities and district health offices (see Annex 2) – primarily for activities such as contract tracing, supervision, meetings and refresher trainings. Central Java uses only passive case detection, i.e. contact tracing, so no costs were 9
The number of cases used in the tool includes childhood cases but, for simplicity, uses the same drug quantities and costs for childhood cases as for adult cases.
The Cost of Scaling Up TB Services in Central Java
15
September 2013
incurred for active case detection 10. The estimation of some costs is based on numbers of district offices and facilities which are shown in Annex 3. The base year for the cost projections was 2011 because that is the year for which most of the price and budget data were available. Inflation was not taken into account in this costing since the main purpose was to show the impact of policy decisions on projected costs, which is harder to see in years further into the future as inflation has a greater effect.
3. TREATMENT ASSUMPTIONS The assumptions for the population, incidence and case notification are shown in Table 1. The population for Central Java was estimated at roughly 32.4 million people in 2011 (based on Indonesia’s 2010 census 11). With an average growth rate of 1% per year, the population of the province is expected to grow to 34.0 million by 2016. 12 The total TB incidence figure of 172.5 per 100,000 for 2011 is the Central Java Ministry of Health (MOH) estimate and the targets for the following years are based on that figure and the NTP national target of reducing the incidence by 1.1% each year. In 2011, the actual number of TB cases treated was 39,854. The NTP assumes that all cases detected are notified and that all cases notified are treated. Therefore in this model the numbers for cases detected and cases notified are the same as the number of cases treated. Based on the number of cases detected and cases notified are 39,854 – the same as the number of cases treated. The Case Detection Rate was, therefore, assumed to be 71.4% (39,854/55,857) and the treatment rate was 123.1 per 100,000 people (39,854/population). 13 The targets for the following years were based on the 2011 figures and the NTP national targets of increasing the numbers of treatments each year (e.g., by 0.7% in 2012). Therefore, the treatment target is 42,269 new cases in 2014 and 44,043 new cases in 2016. The increases are due to the growing population and increasing treatment targets offset by the targeted reductions in the incidence rate. The projected breakdown of the Case Notification Rate among smear-positive, smear-negative and other categories is based on proportions reported in 2011, which was 51.7% smear-positive cases, 42.7% smear-negative cases, 3.5% extra-pulmonary cases, 1.6% relapse cases and 0.4% other cases. The actual national treatment success rates reported by the NTP were used for 2011 and 2012 and the NTP target of 90% was used for 2013-2016 and was assumed to be the same for 2017-2021 14. The TB 10
The cost of contract tracing are based on information that each district health office makes an overage of 12 visits per year and each health centre makes an average of 20 visits per year. 11 Hasil Sensus Penduduk 2010, Data Agregat per Provinsi (Indonesian Census Data by Province); Badan Pusat Statistik. Available at: http://dds.bps.go.id/eng/ 12 For simplicity only the figures for 2011 to 2016 are shown in the tables and graphs. 13 There is, therefore, no data to show how many cases are detected through diagnosis and/or cases notified who do not start treatment. 14 A target of 91% was set by WHO in the Global tuberculosis control: WHO report 2011. Available at: http://www.who.int/tb/publications/global_report/en/
The Cost of Scaling Up TB Services in Central Java
16
September 2013
cure rates of 82.9% for 2011 and 2012 are from Central Java reports and were assumed to remain the same in the following years.
The Cost of Scaling Up TB Services in Central Java
17
September 2013
Table 1: Population, TB incidence and treatment figures, Central Java, 2011 – 2016.
Total population of Central Java Target for change in incidence rate TB Incidence Rate (per 100,000 population)
2011
2012
2013
2014
2015
2016
32,380,687
32,704,494 -1.1%
33,031,538.8 -1.1%
33,361,854.2 -1.1%
33,695,472.7 -1.1%
34,032,427.5 -1.1%
172.5
170.7
168.8
167.0
165.1
163.3
Total expected new TB cases
55,857
55,812
55,761
55,703
55,638
55,567
Total new pulmonary smear-positive cases treated Total new pulmonary smear-negative cases treated Total new extrapulmonary cases treated
20,612
20,971
21,490
21,861
22,395
22,778
17,030
17,327
17,756
18,062
18,503
18,820
1,395
1,419
1,454
1,480
1,516
1,542
Total new relapse cases treated
647
658
675
686
703
715
Total new other cases treated
170
173
177
180
185
188
39,854
40,549
41,552
42,269
43,302
44,043
Total new TB cases treated Treatment target (per 100,000 population)
123.1
124.0
125.8
126.7
128.5
129.4
TB Case Detection Rate (%)
71.4%
72.7%
74.5%
75.9%
77.8%
79.3%
0.7%
1.5%
0.7%
1.4%
0.7%
51.7%
51.7%
51.7%
51.7%
51.7%
51.7%
42.7%
42.7%
42.7%
42.7%
42.7%
42.7%
3.5%
3.5%
3.5%
3.5%
3.5%
3.5%
1.6%
1.6%
1.6%
1.6%
1.6%
1.6%
0.4%
0.4%
0.4%
0.4%
0.4%
0.4%
90.3%
90.2%
90.2%
90.0%
90.0%
90.0%
Target rate of change in number of cases treated Percentage of CNR for new smear-positive cases Percentage of CNR for new smear-negative cases Percentage of CNR for new extrapulmonary cases Percentage of CNR for relapse cases Percentage of CNR for other Estimated % TB treatment success rate Estimated % TB cure rate
82.9%
82.9%
82.9%
82.9%
82.9%
82.9%
Estimated number of patients treated successfully Estimated number of patients cured
35,988
36,575
37,480
38,042
38,972
39,639
33,039
33,615
34,446
35,041
35,897
36,512
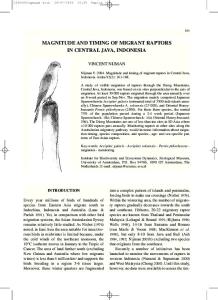
Projections of the target figures of expected and treated cases through 2021 shows the significant narrowing of the gap by 2016 and even more by 2021 (Figure 1) 15.
15
All the years included in the model are shown in the figure to provide a longer projection of the narrowing of the gap.
The Cost of Scaling Up TB Services in Central Java
18
September 2013
Figure 1: TB Cases Expected, Notified and Treated, Central Java, 2011-2021. 60,000 50,000 40,000
Total expected new TB cases
30,000
Total new TB cases notified
20,000
Total new TB cases treated
10,000
2021
2020
2019
2018
2017
2016
2015
2014
2013
2012
2011
-
The number of expected MDR-TB cases was estimated by using the NTP rate of 2.0% 16 of new cases plus 12.0% of retreatment cases (relapse cases plus other cases) (Table 2). In this case the number of new smear positive cases is the number of total expected new TB cases times the percent expected to be smear positive (for 2011 that is 55,857 times 51.7%). The actual numbers of cases notified and treated were used for 2011 and 2012 and figures for the years 2013 – 2021 are derived from the Central Java TB Program targets Case Notification Rates and treatment rates. 17 This would result in an expected number of 680 MDR-TB cases in 2014 of which 405 would start treatment. Based on the NTP’s assumptions, with an estimated 75% cure rate, 304 of those 405 patients would be successfully treated (completed treatment) and the same number would be cured. Table 2: MDR-TB treatment projections, Central Java, 2011 – 2016 2011 Total new TB cases smear positive
2012
2014
2015
2016
28,865
28,839
28,809
28,775
28,738
2.0%
2.0%
2.0%
2.0%
2.0%
2.0%
Total MDR-TB cases among new TB cases
578
577
577
576
576
575
Total new re-treatment cases treated
817
831
852
867
888
903
12.0%
12.0%
12.0%
12.0%
12.0%
12.0%
98
100
102
104
107
108
Total new MDR-TB cases expected
676
677
679
680
682
683
Target CNR %
8%
9%
60%
70.0%
80.0%
90.0%
Estimated % of MDR-TB cases among new cases
Estimated % of MDR-TB cases among retreatment cases Total MDR-TB cases among retreatment TB cases
MDR-TB case notification target % of notified cases treated Total MDR-TB cases started treatment / targets
8,888
2013
52
63
407
476
546
615
75%
78%
85%
85%
85%
85%
39
49
346
405
464
523
70.3%
70.3%
70.3%
75.0%
75.0%
75.0%
Estimated number of patients treated successfully
27
34
243
304
348
392
Estimated number of patients cured
27
34
243
304
348
392
Estimated % TB cure rate
16
The national figures shown in the WHO Global Tuberculosis Report, 2013 are 1.9% but since the Central Java figures are believed to be slightly different from the national figures we used the figures provided by the Provincial NTP. The difference in numbers of treatments and costs is, in any event, small. 17 Note that the target for 2013 represents a significant increase from the number of patients actually treated in 2012.
The Cost of Scaling Up TB Services in Central Java
19
September 2013
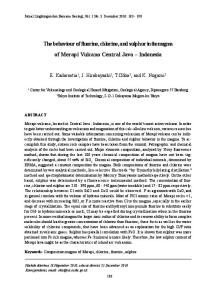
The targets for notified MDR-TB cases increase greatly in 2013, 2014 and 2015 and would cover 90% of cases by 2016 (Figure 2). Figure 2: MDR-TB Cases Expected, Notified and Treated, Central Java, 2011-21
4. RESULTS Based on the above assumptions, the approximate total cost of recurrent resources required to detect and treat TB and MDR-TB in 2014 would be USD 12.8 million (Table 3). This is comprised of roughly USD 9.6 million for TB cases and USD 3.2 million for MDR-TB cases. These figures include both direct and indirect costs, a breakdown of which are shown later in this section. By 2016, with higher treatment targets, the total funding required would be USD 14.0 million (excluding inflation), with the cost projections depending on treatment targets. It should be noted that these figures would not match with budget year figures since they include the full costs of MDR-TB treatment for patients who start treatment each year and these costs are actually incurred over three budget years. Patient enabler costs are not included in the above figures, but, based on the 2011 rate of USD 42 per month per patient, would amount to a total of USD 405,242 for MDR-TB patients who started treatment in 2014. Note that these costs are incurred over 2 or more years. Table 3: Total TB Services Costsa , Central Java, 2011 – 2016, (USD) TOTAL COSTS TOTAL PROGRAM COST TOTAL COST - TB TOTAL COST - MDR-TB
a
2011 9,454,916 9,144,152 310,763
2012 9,680,797 9,273,848 406,949
2013 12,214,410 9,454,983 2,759,426
2014 12,812,042 9,588,051 3,223,990
2015 13,473,999 9,780,163 3,693,836
2016 14,079,159 9,917,722 4,161,437
These are the average costs for patients who start treatment in each year. In the case of MDR-TB treatment costs would fall into three budget years. The costs exclude inflation.
The Cost of Scaling Up TB Services in Central Java
20
September 2013
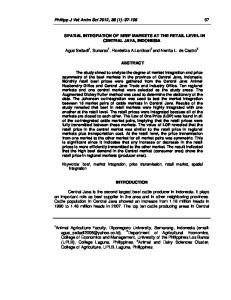
The cost by algorithm component is shown in Table 4 and Figure 3. In 2014 the highest cost components of the TB treatment algorithm would be treatment monitoring at USD 4.7 million (37%) with treatment (medicines) next at USD 3.9 million (31%) and diagnosis third at USD 3.1 million (25%). Treatment monitoring includes DOTS surveillance and follow-up smears as well as inpatient costs for an estimated 10% of the patients. Prevention and Promotion and Case Detection costs are based on numbers of facilities and are assumed not to change over the years. 1% of the resources go to case detection 18. Other TB activities comprise TB-related meetings and refresher trainings for health facility staff. Table 4: Total TB Services Costs by Algorithm Componentc, Central Java, 2011 – 2016 (USD)
Prevention & Promotion
2011
2012
2013
2014
2015
2016
471,382
471,382
471,382
471,382
471,382
471,382
% Prevention & Promotion Case Detection
5%
5%
4%
4%
3%
3%
138,032
138,032
138,032
138,032
138,032
138,032
1%
1%
1%
1%
1%
1%
2,953,139
3,010,422
3,125,333
3,179,064
3,250,300
3,305,424
% Case Detection Diagnosis % Diagnosis Treatment
31%
31%
26%
25%
24%
23%
1,458,559
1,544,885
3,517,955
3,921,322
4,338,637
4,745,285
15%
16%
29%
31%
32%
34%
4,116,338
4,198,611
4,644,241
4,784,776
4,958,182
5,101,571
% Treatment Treatment Monitoring % Treatment Monitoring Other TB Activities
44%
43%
38%
37%
37%
36%
317,466
317,466
317,466
317,466
317,466
317,466
3%
3%
3%
2%
2%
2%
9,454,916
9,680,797
12,214,410
12,812,042
13,473,999
14,079,159
% Other TB Activities TOTAL c
The costs for MDR-TB treatment and treatment monitoring cover the whole treatment and fall into three budget years. Inflation is not included.
Figure 3: TB Service Costs by Algorithm Componenta, Central Java, 2011 – 2016 USD 16,000,000 14,000,000 12,000,000
Other TB Activities
10,000,000
Treatment Monitoring Treatment
8,000,000
Diagnosis
6,000,000
Case Detection
4,000,000
Prevention & Promotion
2,000,000 2011
b
2012
2013
2014
2015
2016
These are the average costs for patients who start treatment in each year. In the case of MDR-TB treatment costs fall into three budget years. Inflation is excluded.
18
As mentioned previously, case detection in Indonesia comprises contact tracing solely; active case detection is not routinely practiced.
The Cost of Scaling Up TB Services in Central Java
21
September 2013
The highest cost element for first-line TB in 2014 would be treatment monitoring at USD 4.3 million (45%), followed by diagnosis at USD 3.0 million (32%) and then treatment (medicines) at USD 1.2 million (13%) (Table 5 and Figure 4). Table 5: Total First-Line TB Costs by Algorithm Component, Central Java, 2011 – 2016 (USD) 19 Prevention & Promotion
2011
2012
2013
2014
2015
2016
470,922
470,813
467,486
466,912
466,387
465,855
% Prevention & Promotion Case Detection
5%
5%
5%
5%
5%
5%
137,897
137,865
136,891
136,723
136,569
136,414
2%
1%
1%
1%
1%
1%
2,943,355
2,981,569
3,036,776
3,076,251
3,133,065
3,173,837
% Case Detection Diagnosis % Diagnosis Treatment
32%
32%
32%
32%
32%
32%
1,203,693
1,224,669
1,254,973
1,276,641
1,307,828
1,330,208
13%
13%
13%
13%
13%
13%
4,071,131
4,141,850
4,244,016
4,317,069
4,422,212
4,497,665
% Treatment Treatment Monitoring % Treatment Monitoring Other TB Activities
45%
45%
45%
45%
45%
45%
317,155
317,082
314,842
314,455
314,101
313,743
3%
3%
3%
3%
3%
3%
9,144,152
9,273,848
9,454,983
9,588,051
9,780,163
9,917,722
% Other TB Activities TOTAL
Figure 4: Total First-Line TB Costs by Algorithm Component, Central Java, 2011 – 2016 (USD) 12,000,000 10,000,000 Prevention & Promotion
8,000,000
Other TB Activities Treatment Monitoring
6,000,000
Treatment
4,000,000
Diagnosis Case Detection
2,000,000 2011
2012
2013
2014
2015
2016
The highest cost element for MDR-TB in 2014 would be treatment at USD 2.6 million (82%) followed by treatment monitoring at USD 467 thousand (14%) and then diagnosis at USD 102 thousand (3%) (See Table 6 and Figure 5). 19
Note that the costs of Prevention & Promotion, Case Detection, and Other TB Activities decrease over time for First-Line TB and increase over time for MDR-TB. This is because these costs are treated as fixed and a greater proportion of them are allocated to MDR-TB as the direct MDR-TB costs increase over time.
The Cost of Scaling Up TB Services in Central Java
22
September 2013
Table 6. Total MDR-TB Service Costs by Algorithm Componentd, Central Java, 2011 – 2016 (USD) 2011
2012
Prevention & Promotion % Prevention & Promotion Case Detection
2013
2014
2015
2016
461
569
3,896
4,470
4,995
5,527
0.1%
0.1%
0.1%
0.1%
0.1%
0.1%
135
167
1,141
1,309
1,463
1,619
% Case Detection
0.0%
0.0%
0.0%
0.0%
0.0%
0.0%
Diagnosis
9,783
28,853
88,558
102,814
117,235
131,587
% Diagnosis
3.1%
7.1%
3.2%
3.2%
3.2%
3.2%
254,866
320,216
2,262,983
2,644,680
3,030,809
3,415,076
Treatment % Treatment
82.0%
78.7%
82.0%
82.0%
82.1%
82.1%
Treatment Monitoring
45,208
56,761
400,225
467,706
535,970
603,906
% Treatment Monitoring
14.5%
13.9%
14.5%
14.5%
14.5%
14.5%
Other TB Activities
310
383
2,624
3,011
3,364
3,723
0.1%
0.1%
0.1%
0.1%
0.1%
0.1%
310,763
406,949
2,759,426
3,223,990
3,693,836
4,161,437
% Other TB Activities TOTAL d
The costs for MDR-TB treatment and treatment monitoring cover the whole treatment of 24 months and would fall into three budget years.
Figure 5: Total MDR-TB Service Costs by Algorithm Component, Central Java, 2011-2016 (USD). 4,500,000 4,000,000 3,500,000
Prevention & Promotion
3,000,000
Other TB Activities
2,500,000
Treatment Monitoring
2,000,000
Treatment
1,500,000
Diagnosis
1,000,000
Case Detection
500,000 2011
2012
2013
2014
2015
2016
The above figures include indirect costs for each level of service. In 2014 these indirect costs come to 32% of total costs (Table 7) 20 21. This figure increases slightly over the years as more MDR-TB services are provided since the hospital component of MDR-TB carries a higher indirect cost. These figures may
20
This includes an assumption that indirect costs at district health office level are 25% of direct costs which is a rough estimate. To simplify these estimates we assumed that all first-line diagnoses and treatments were carried out at the health centre level and all MDR-TB diagnoses and treatment were carried out at the hospital level. 21
The Cost of Scaling Up TB Services in Central Java
23
September 2013
be understated since an analysis of DHA figures from 36 districts in 2010 indicated that 41% of total district health budgets were made up of support costs 22. Table 7: Total Direct and Indirect Costs by Service Level, Central Java, 2011-16 (USD) Direct and indirect cost by service level Total direct DHO cost Total direct Health Centre cost Total direct Hospital cost Total direct costs Total indirect DHO cost Total indirect Health Centre cost Total indirect Hospital cost Total indirect costs Total cost Indirect cost as % of direct cost Indirect cost as % of total cost
2011 437,640 5,086,055 1,376,832 6,900,528 109,410 999,289 1,445,689 2,554,388 9,454,916 37% 27%
2012 437,640 5,159,284 1,445,200 7,042,124 109,410 1,013,677 1,515,586 2,638,673 9,680,797 37% 27%
2013 437,640 5,303,048 2,597,195 8,337,883 109,410 1,041,923 2,725,193 3,876,526 12,214,410 46% 32%
2014 437,640 5,385,149 2,840,803 8,663,593 109,410 1,058,054 2,980,985 4,148,449 12,812,042 48% 32%
2015 2016 437,640 437,640 5,499,959 5,584,552 3,096,700 3,342,526 9,034,299 9,364,718 109,410 109,410 1,080,611 1,097,232 3,249,679 3,507,799 4,439,700 4,714,441 13,473,999 14,079,159 49% 50% 33% 33%
The major part of the costs (50%) would be incurred at the health center level (42% direct plus 8% indirect) in 2014 (Table 8) 23. Due to the higher level of indirect costs at the hospital level, the major part of indirect costs would be incurred at that level – 72%. Table 8: Total Direct and Indirect Costs by Service Level for Central Java, 2014 (USD) Direct and indirect cost by service level 2014 2014 2014 Total direct DHO cost 437,640 5% 3% Total direct Health Centre cost 5,385,149 62% 42% Total direct Hospital cost 2,840,803 33% 22% Total direct costs 8,663,593 100% 68% Total indirect DHO cost 109,410 3% 1% Total indirect Health Centre cost 1,058,054 26% 8% Total indirect Hospital cost 2,980,985 72% 23% Total indirect costs 4,148,449 100% 32%
The average unit cost of detecting, diagnosing and treating a TB patient who started treatment in 2014 would be USD 227, the average cost per case successfully treated would be USD 252 and the average cost per case cured would be USD 274 (Table 9) 24 25. The average unit cost for an MDR-TB patient who started treated in 2014 would be USD 7,967 and the average cost per case successfully treated and cured would be USD 10,622. The unit cost of treating MDR-TB is much higher than the unit cost of TB, primarily because of the longer treatment period of 24 months or more and the higher cost of medicines. 22 23
24 25
Source - unpublished data collected and analyzed by the authors. In this case “incurred” refers to the use of resources, which is different from the procurement of resources. It was assumed that the treatment success and cure rates apply to all types of first-line TB treatment.
The average cost per case successfully treated and per case cured can be used as a simple measure of cost-effectiveness. For example, the cost will be lower if fewer patients default or die during treatment.
The Cost of Scaling Up TB Services in Central Java
24
September 2013
The average cost of USD 254 per first-line TB patient successfully treated in Central Java in 2011 is a little below the middle of the range of USD 100 to USD 500 identified by WHO for most high-burden countries 26 27. The 2011 cost per patient treated for MDR-TB of USD 7,968 can be compared with 2005 estimates for four countries 28. These costs were USD 10,880 in Estonia, USD 2,423 in Peru, USD 3,613 in the Philippines and USD 14,657 in Tomsk. The figures for Estonia and Tomsk are high because patients stay in hospital for extended periods. The figure for Peru was considered on the low side as the regimen was deemed suboptimal. The figure of USD 3,613 for the Philippines could provide the most relevant comparison but, given that the Philippines figure was from 2005 and diagnosis and treatment protocols as well as resources prices would have changed. A more in-depth analysis would be needed to make meaningful comparisons 29. The average cost per capita in 2014 would be 38 US cents, based on the total population. This figure can be compared with the economic burden of TB in Indonesia, which is over USD 8 per capita 30, indicating that investment in TB detection and treatment is worthwhile. Table 9: Total TB and MDR-TB Cost per Case and per Capita, Central Java, 2011-16 (USD) COST PER CASE AND PER CAPITA Cost per TB case that started treatment - TB Cost per TB case successfully treated Cost per TB case cured Cost per MDR-TB case that started treatment - TB Cost per MDR-TB case successfully treated Cost per MDR-TB case cured TB Cost per Capita MDR-TB Cost per Capita Total TB and MDR-TB Cost per Capita
2011
2012
229 254 277 7,968 11,339 11,339 0.28 0.01 0.29
229 254 276 8,305 11,819 11,819 0.28 0.01 0.30
2013 228 252 274 7,969 11,340 11,340 0.29 0.08 0.37
31
2014 227 252 274 7,967 10,622 10,622 0.29 0.10 0.38
2015 226 251 272 7,965 10,620 10,620 0.29 0.11 0.40
2016 225 250 272 7,963 10,618 10,618 0.29 0.12 0.41
26
Global Tuberculosis Report, 2012, WHO. Accurate comparisons are difficult since the bases for the figures may be different, for example including or excluding the cost of treating TB/HIV or indirect costs. 28 A Systematic Review of the Cost and Cost Effectiveness of Treatment for Multidrug-Resistant Tuberculosis. Fitzpatrick and Floyd, 2012. 29 Comparisons of costs across countries should be treated with caution since they may use different methods and cost elements and key resources, such as medicine prices and salaries, can differ significantly. 30 The Economic Burden of Tuberculosis in Indonesia, 2012. 31 Some figures do not appear to add correctly, which is due to rounding. 27
The Cost of Scaling Up TB Services in Central Java
25
September 2013
5. FINDINGS The provincial targets assume that the incidence rates for TB will reduce slightly each year and the treatment rates will increase slightly. The net effect of these will be offset somewhat by population increases and the result will be a projected increase in the number of treated cases from 39,854 in 2011 to 42,269 in 2014 and 44,043 in 2016. The targets for MDR-TB assume more significant increasing levels of case notification and treatment, resulting in a projected increase in the number of treated cases from 39 in 2011 to 523 in 2016. Based on these incidence and treatment assumptions the approximate cost of the recurrent resources needed for the province to reach its TB and MDR-TB targets in 2014 would be USD 12.8 million (excluding inflation) (USD 9.6 million for TB cases and USD 3.2 million for MDR-TB cases). This would increase to a total of USD 14.0 million in 2016 (excluding inflation). It should be noted that these figures would not match with budget year figures since they include the full costs of MDR-TB treatment for patient who start treatment each year and these costs are actually incurred over three budget years. Patient enabler costs are not included in the above figures, but, based on the 2011 rate of USD 42 per month per patient, would amount to a total of USD 405,242 for MDR-TB patients who started treatment in 2014. Note that these are incurred over a period of 24 or more months. In terms of program components for 2014 cases, USD 4.7 million (37%) would be needed for treatment monitoring, USD 3.9 million (31%) for diagnosis and USD 3.1 million (25%) would be needed for treatment. The above figures include indirect costs which come to around 32% of total costs in 2014. Around 50% of total costs (42% direct and 8% direct) would be managed at the health center level, 45% at the hospital level and 4% at the district health office level. The average unit cost of detecting, diagnosing and treating a TB patient who started treated in 2014 would be USD 227, the average cost per case successfully treated would be USD 252 and the average cost per case cured would be USD 274. The average unit cost for an MDR-TB patient who started treated in 2014 would be USD 7,967 and the average cost per case successfully treated and cured would be USD 10,622. The unit cost of treating MDR-TB is much higher than the unit cost of TB, primarily because of the longer treatment period of 24 months and the higher cost of medicines. The average cost of USD 254 per first-line TB patient successfully treated in Central Java in 2011 falls a little below the middle of the range of USD 100 to USD 500 identified by WHO for most high-burden countries. The cost per patient treated for MDR-TB of USD 7,968 is also within a range of costs estimated in other countries, but a more in-depth analysis would be required to provide a meaningful comparison.
The Cost of Scaling Up TB Services in Central Java
26
September 2013
The average cost per capita in 2014 would be 29 US cents for a TB case and 10 US cents for an MDR-TB case, based on the total population. The total of 38 32 US cents per capita can be compared with the economic burden of TB in Indonesia, which would be over USD 8 per capita indicating that investment in treating TB is worthwhile. These figures do not include the cost of active case detection, only contact tracing, since this is not carried out in the province. The results indicate that around 1% of the resources are allocated to case detection and it would be worth reviewing to see if that is adequate. The total costs are based largely on the use of standard prices, as well as some budget figures that were obtained from the sample of facilities. They, therefore, mainly represent the estimated cost of the resources required to provide good quality services to the target numbers of persons with TB and MDRTB, which may be different in some cases from actual expenditures made. The figures only cover provider costs and do not take into account additional costs related to childhood TB, TB/HIV or XDR-TB. They also do not include capital costs, provincial and national program costs, or patient enablers or patient costs and they may not include all operating and administrative costs. Due to these and other limitations, the figures provided by this study are probably underestimates of the total resources required and should, therefore, be regarded as indicative and more suited for policy and planning purposes rather than for detailed budgeting. The preliminary model and findings were presented to senior Central Java health and TB managers and were deemed to be useful. Copies of the tool were requested and a request was made for costeffectiveness analysis capacity to be added to the tool.
6. LIMITATIONS The tool was developed for use by sub-national program managers and was designed to be simple and user friendly. It does not include relationships between some variables, such as the impact of incentives on cure rates. It does not have components for: • Provincial management and supervision costs or any share of national program costs • Capital costs or depreciation or any initial development or training costs • Community-based costs related to services provided by Civil Society Organizations (CSOs) and Community-Based Organizations (CBOs) • TB/HIV costs • XDR-TB costs • Childhood TB • Incentives for laboratory staff • Patient costs 32
Difference due to rounding
The Cost of Scaling Up TB Services in Central Java
27
September 2013
Some of these may be added in a second version of the tool which will be developed later. In addition, the results do not include the cost of active case detection, apart from contact tracing, since this is not carried out in the province. Finally the cost estimates that were obtained from district and facility managers were based on a very small sample. These cost findings should therefore be treated as indicative and although they can be used for planning they should be used for setting district and facility budgets without reviewing the cost components. 7. FUTURE ACTIONS The model provides a useful and easy way to predict future costs over several years in a transparent way based on key assumptions such as case notification and treatment rates. The results can be used in determining how funds will be raised and allocated and can serve as a basis for assessing costeffectiveness and efficiency. There are several future actions that the provincial and national MOH and TB program managers can take: • •
• •
Additional research should be conducted to get better estimates of some of the costs, such as prevention and promotion and indirect costs. The results indicate that only around 1% or 2% of the resources are allocated to case detection and this should be reviewed to see if those resources are sufficient for successful TB and MDR-TB case detection. The tool can be expanded to cover additional costs, such as for community and civil society organization support, and for the detection and treatment of XDR-TB, TB/HIV and childhood TB. The NTP should develop a process to roll out the tool for use in all provinces.
The Cost of Scaling Up TB Services in Central Java
28
September 2013
ANNEXES
The Cost of Scaling Up TB Services in Central Java
29
September 2013
Annex 1: Cost calculation methods Type of cost
Price
Specific district TB promotion TB incentives District health promotion – TB share
Budget estimate per facility Budgeted incentive for one person per facility District health promotion budget
Case detection (contact tracing incentives) Diagnosis consultation Smear X-ray Lab and X-ray technicians
Budget
GeneXpert and culture tests GeneXpert maintenance TB medicines Drug procurement and management DOTS treatment consultation Non-TB medicines and other supplies and oxygen Inpatient doctor and nurse labor
Estimated cost (KNCV) Estimated cost - other country studies Local prices % of medicines costs Average actual salary plus incentive Average actual costs
Inpatient accommodation
Average actual costs
District health office supervision
Budgets
Health center - training and meetings
Budgets
Indirect health center and hospital costs Indirect district health office costs
A previous study
Number of consultations Number of smears Number of X-rays Percent of time spent on TB service Number of tests Number of tests per machine Number of cases treated NA Number of consultations Number of inpatient days (standard) Number of inpatient days (standard) Number of inpatient days (standard) Numbers of facilities, staff, meetings Number of training events and meetings Applied as a % to direct costs
Estimate
Applied as a % to direct costs
Fee Who TB costing for Indonesia Actual cost per private practitioner Average salary
Average actual costs
The Cost of Scaling Up TB Services in Central Java
30
Quantity (actual for 2011, target for 2012-2021) Number of facilities Number of facilities % relating to TB and number of districts Number of visits
September 2013
Annex 2: Facilities and District Offices included in the sample (Central Java) The study team was based in Surakarta, the city where the Provincial Hospital (Moewardi) provides MDR-TB diagnostic and treatment services. The Province Health Office selected three representative districts accessible from Surakarta and one of each type of facility providing TB services in each district the district health office, hospital and health center. Data were also collected from one lung clinic in Klaten, which is under the Provincial Health Department, the Surakarta District Health Office and Moewardi Hospital. The districts and facilities from which data were collected are: • • • • • • • • • •
Surakarta (Solo) District Health Office Klaten District Health Office Sragen District Health Office Sukoharjo District Health Office Moewardi Provincial Hospital Suraji Tirtonegoro Hospital Klaten Lung Clinic Puskesmas Juwiring, Klaten District Puskesmas Sragen, Sragen District Puskesmas Sukoharjo, Sukoharjo District
We were unable to collect data from Sragen Hospital, one of the district hospitals.
The Cost of Scaling Up TB Services in Central Java
31
September 2013
Annex 3: Numbers of Public Facilities that Provide TB Services (Central Java) Total Number Number of Provincial / Referral Hospitals Number of District Hospitals Number of Lung Clinics Number of Puskesmas Number of Communities
Providing TB Providing TB - Providing TB Diagnosis DOTS Hospitalization
1 44 10 868 7,804
The Cost of Scaling Up TB Services in Central Java
1 44 10 868 7,804
1 44 10 868 7,804
32
1 44 10 868 7,804
Providing MDR-TB Diagnosis
Providing MDR-TB DOTS 1
-
Providing MDR-TB Hospitalization 1
10 10 10
September 2013
1 -
Annex 4: References 1. Global tuberculosis control: WHO report 2011. Available at: http://www.who.int/tb/publications/global_report/en/ 2. Hasil Sensus Penduduk 2010, Data Agregat per Provinsi (Indonesian Census Data by Province); Badan Pusat Statistik. Available at: http://dds.bps.go.id/eng/ 3. WHO estimates for Indonesia National Health Accounts (NHA) data. Available at: http://www.who.int/nha/country/idn/en/ 4. Tuberculosis Coalition for Technical Assistance. International Standards for Tuberculosis Care (ISTC). The Hague: Tuberculosis Coalition for Technical Assistance, 2006. 5. Collins, D., F. Hafidz and C. Suraratdecha. The Economic Burden of Tuberculosis in Indonesia. Management Sciences for Health, TB CARE I, 2012. 6. Fitzpatrick, Christopher and Katherine Floyd. A Systematic Review of the Cost and Cost Effectiveness of Treatment for Multidrug-Resistant Tuberculosis. Pharmacoeconomics, 2012. 7. Global tuberculosis control 2012. WHO. 8. Collins, D and A. Parihatin. 2011. Indonesia National Tuberculosis Program: Planning for Financial Sustainability. Management Sciences for Health. USAID/TB CARE I. 9. Global Tuberculosis Report, 2103. WHO.
The Cost of Scaling Up TB Services in Central Java
33
September 2013