PROCEEDINGS of the HUMAN FACTORS AND ERGONOMICS SOCIETY 52nd ANNUAL MEETING—2008
79
Testing a Nonveridical Aircraft Collision Avoidance System: Experiment 2 William Knecht Maneuver Space Technologies Pocasset, Oklahoma Veridical displays represent realistic scenes. State spaces are nonveridical displays representing ndimensional information based on arbitrary coordinate axes plus variables such as color and shading. Here, flight performance using only a veridical cockpit display of traffic information (CDTI) was compared to performance augmented by a 4D state space-based collision avoidance system (CDTI+4CAS). Twelve general aviation pilots flew scenarios with the task of deviating as little as possible from course while still maintaining standard enroute separation from traffic. The CDTI+4CAS condition showed performance superiority over the CDTI-only condition for five of five dependent measures of maneuver efficiency, four of four measures of maneuver safety, and six of nine measures of workload. INTRODUCTION
Copyright 2008 by Human Factors and Ergonomics Society, Inc. All rights reserved. 10.1518/107118108X348837
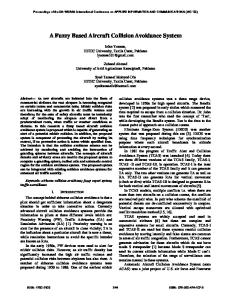
State spaces are nonveridical representations common in chemistry and physics. State spaces can be constructed from any features that can be classified or quantified. Figure 1 shows a hypothetical 4D state space representing chemical reaction speed at different combinations of temperature, pressure, and enzyme concentration.
Figure 1. A 4D state space based on temperature, pressure, enzyme concentration, plus color to depict reaction speed.
The present research examines a nonveridical state space display—specifically, one intended to help keep aircraft safely separated. Numerous veridical displays of traffic information (DTI) have been developed, ranging from familiar map-view ATC displays and cockpit displays of traffic information (CDTI), all the way to sophisticated 2D veridical conflict resolution displays (Johnson, Battiste, & Holland, 1999), coplanar displays (Pekela & Hilburn, 1998; Thomas & Wickens, 2005), and even 3D veridical displays (Canton, Refai, Johnson, & Battiste, 2005; Granada, Quang Dao, Wong, Johnson, & Battiste, 2005; Naikar, 1998). Many systems make use of separationmaintenance technology to predict and resolve conflicts between aircraft. Cockpit variants of veridical collision avoidance systems (CAS) have also been developed (Johnson & Battiste, 1999; van Gent, Hoekstra, & Ruigrok, 1998). The
most widely known system is TCAS ([Traffic Alert and Collision Avoidance System], Kuchar & Yang, 2000). However, TCAS has a short lookahead time, insufficient for strategic traffic planning. Therefore, developers have focused on systems with lookaheads sufficiently long to allow gentle aircraft maneuvers. One of the key human factors issues common to all these efforts involves the difficulty of veridically displaying certain critical types of aircraft maneuver information. Specifically, veridical displays have trouble representing maneuver combinations—simultaneous changes in aircraft speed, heading, and/or altitude. In response, some developers have begun using elements of nonveridical display. For instance, Van Dam, Appleton, Mulder, and van Paassen (2006) developed a CDTI that nonveridically represents aircraft speed, allowing speed + heading combination maneuvers. This device has demonstrated its effectiveness on difficult air traffic scenarios. Maneuver space. In an attempt to fully address the data visualization problem, Knecht and Smith, (2001) reconceptualized aircraft maneuver in terms of maneuver space (MS). MS is defined as a 4D state space unique to each aircraft, dimensionalized by that aircraft’s a) heading, b) speed, c) altitude, and d) available maneuver time. MS represents all conflictual and non-conflictual maneuvers achievable by one aircraft within a fixed period of time, given the obstacles predicted along each potential maneuver’s hypothesized path. T his approach is not intended to replace veridical displays of traffic information (DTI)—merely to augment them. Basically, MS is just a maneuver hypothesis-tester. Each potential autopilot setting is treated as a hypothesis, namely whether or not that particular setting would be safe over the established lookahead time. The full definition of MS is decomposed into eight primary components. Figure 2 illustrates. In Figure 2 (Right), the entire colored, translucent, glasslike structure is called a conflict region (CR). A CR represents a set of numerically contiguous maneuvers predicted unsafe, given the specified lookahead time. In MS, these conflictual maneuvers are predicted by a hardware/software conflict probe
PROCEEDINGS of the HUMAN FACTORS AND ERGONOMICS SOCIETY 52nd ANNUAL MEETING—2008
(Bakker, Kremer, & Blom, 2000; Erzberger, Paielli, Isaacson, & Eshowl, 1997; Kuchar & Yang, 2000). The present study uses a deterministic probe, assuming that most modern commercial aircraft trajectories are precisely, cybernetically controlled. To simplify computation, instantaneous maneuver
80
response is also assumed for the ownship (“pilot’s own ship”). While instantaneous response is often an assumption for prototypes, it is acknowledged that realistic maneuver response time must ultimately be engineered into the conflict probe.
Figure 2. (Left) Hypothetical example of three aircraft, all at 290 kt indicated airspeed (.78 mach) at flight level 32,000 (FL 320). The pilot’s own ship (ownship, O) must maneuver to avoid two intruders (I1, 12). (Middle) the ownship autopilot, showing its three “dimensions” of heading, indicated airspeed, and altitude. (Right) a slightly downward-looking view of how the veridical space transforms into 4D nonveridical maneuver space.
1) Each cube inside MS is equivalent to one maneuver (one discrete setting of the autopilot). 2) When we move inside MS: a) moving left or right plans a left or right turn (heading change) b) “ in or out “ “ throttle-in or -out (acceleration/deceleration) c) “ up or down “ “ climb or descent 3) Colored MS signifies “unsafe” (shows maneuvers predicted to result in separation failure). 4) Color signifies available maneuver time (minutes remaining until a given maneuver produces separation failure). a) black signifies no immediate conflict b) dark green “ 6 minutes to separation failure c) yellow “ 3 “ “ “ “ d) magenta “ 0 “ “ “ “ 5) The 3D center of MS represents the current autopilot setting. 6) Therefore, no avoidance is needed unless MS-center is colored. 7) Maneuvers in conflict with more than one obstacle are colored for the conflict closest in time. 8) Maneuvers are translucent to let us see through the entire MS. EXPERIMENT 2 A prototype 4-Dimensional Collision Avoidance System (4CAS) was first pretested with 18 GA pilots from Lund University, Sweden. An improved version was then tested and reported as Experiment 1 (Knecht, 2007). Eight male GA pilots flew nominal straight-line courses threatened by traffic. In comparing CDTI-only trials (with no conflict alert or resolution capability) to 4CAS+CDTI trials, with 4CAS present, average path length, maneuver onset time, and duration of pilot deviations were significantly shorter, and enjoyability-ofuse was reported as significantly greater. With further revisions, Experiment 2 follows below. Method Participants. Twelve general aviation pilots volunteered with informed consent, 11 male, one female. Median pilot age was 23.5 (range 19-63, mean 27.8, SD 12.1). Median flight
hours was 701 (range 70-8000, mean 1271, SD 2185). All pilots held at least a private license, 10 held instrument ratings, six were certified as both Certified Flight Instructor (CFI) and Certified Flight Instructor-Instrument (CFII), seven held Commercial ratings. One held the Air Transport Pilot (ATP) rating. Apparatus. The part-task flight simulator is described in Knecht (2007). The FS2004 Boeing 737-400 model was used in conjunction with FS2004 Artificial Intelligence (AI) Traffic to create simulated enroute air traffic and generate recordable latitudes, longitudes, headings, ground speeds, and vertical speeds for ownship and traffic. A CDTI displayed a veridical, top-down, moving map, with ownship occupying display-center. Traffic was depicted as chevrons aimed in the direction of travel. Data tags showing traffic flight level (FL) were positioned nearby. Zoom buttons allowed viewing from 5-200 statute miles ([sm], 8-322 km) in width and height. To maneuver in the CDTI-only condition, pilots clicked directly on the B737 autopilot. The CDTI had no conflict alert or resolution capability.
PROCEEDINGS of the HUMAN FACTORS AND ERGONOMICS SOCIETY 52nd ANNUAL MEETING—2008
Normally, the CDTI updated and wrote data to file every 2.5 s. Failure to maintain 5 nm/1000 ft aircraft separation was treated as a pilot deviation (PD, [FAA, 2006]). This triggered a burst timer, boosting the sampling rate to 25 Hz, allowing accurate capture of aircraft separation to within ±30 ft. The 4CAS MS was rotatable around vertical (z) and horizontal (x) axes to allow inspection of MS geometry. A 3D planning cursor moved within MS to allow selection of avoidance maneuver. To resolve a conflict, users positioned the 3D cursor in a black region of MS and hit the “Execute” button. This reset the FS2004 autopilot and began the maneuver. Experiment 1 had revealed problems of excessive vertical traffic speed, altitude porpoising, and overly simple scenarios. These were rectified by generating straight-and-level “primary conflict” traffic via a custom Traffic Creation Utility (TCU) panel (Figure 3, middle). FS2004’s AI Traffic mode was used only to create traffic for a single “standard background” (Fig-
81
ure 3, right). This provided distractors and blocking aircraft only. During each experimental trial, primary traffic was added to the standard background to create a single traffic situation displayed on the CDTI. Traffic latitude, longitude, and altitude were updated differentially, using prior values and known elapsed time. To the viewer, traffic looked identical to FS2004 AI Traffic, but without altitude wobble. 4CAS displayed MS and CRs identically to Experiment 1. However, a new, translucent 3D planning cursor was tested, which stayed put after maneuver planning, and a new, smaller cube was introduced to represent current (real-time) values of heading/speed/altitude. After maneuver completion, the display recentered itself to again represent current autopilot settings as MS-center. A message box displayed the words “NO MANEUVER NECESSARY” as appropriate. This changed to the alert message “MANEUVER!!” when necessary.
Figure 3. (Left) 4CAS display. Grid and color scales are the same as Figure 2, (Middle) Primary traffic used to create scenario 1, plus the Traffic Creation Utility panel, (Right) Background traffic used in all scenarios. Blue paths were visible only during scenario creation, not at runtime.
Task. The overall task was simply to stay generally oncourse (path+altitude), deviating for traffic as necessary, then returning to course when clear of traffic. To improve the accuracy of path length measures, program shutdown was automatic, triggered by point-of-closest approach to destination. Experimental design. Repeated-measures were used, with scenario presentation order counterbalanced by Latin squares. Half the pilots started in the CDTI-only condition, flying the first four scenarios, followed by a break, followed by the CDTI+4CAS condition using mirror-image scenarios in the same order. The remaining pilots ran with the CDTI+4CAS first. Pilots were not told they would repeat scenarios. This method appears to minimize scenario-specific learning and asymmetrical transfer (Knecht & Hancock, 1999; Knecht, 2007). Flight Scenarios. Scenarios began in mid-flight, at 32000 ft (FL 320), 300 kt indicated airspeed (IAS, .80 mach). This emulated enroute free flight in that aircraft were not restricted to odd-or-even 1000-ft flight levels (no “East-West Rule”).
T he CDTI portrayed the ownship flying nearly due north (354º). Each of the four 10-min base scenarios had a mirrorimage, generated by graphically flipping each scenario’s initial state, then using the TCU to create a mirror with the appropriate endpoints. Figure 3 shows a typical base scenario. These incorporated as many cognitive complexity factors as possible (Hilburn & Flynn, 2005). Primary traffic (generated by the TCU) converged toward the ownship straight and level from various angles, shaping the conflict situation. Non-conflictual FS2004 AI Traffic was then superimposed as a constant background to provide distractors and blocking aircraft. All scenarios were “close calls.” To test false alarms, one mirror-pair contained a near-conflict, but technically required no avoidance. The remaining three pairs all contained a grazing conflict in heading. This could most easily be solved by a heading change of 2-4 degrees, or by an altitude change of either 1000 or 3000 ft. Heading solutions were both camouflaged and constrained by blocking aircraft. Altitude solutions were set up so that the minimal altitude solution was disguised
82
PROCEEDINGS of the HUMAN FACTORS AND ERGONOMICS SOCIETY 52nd ANNUAL MEETING—2008
by the presence of 1-2 near-conflict aircraft, with the more extreme altitude solution left wide open. Speed solutions were occasionally available, but not particularly emphasized. Within the maximum viewable area on the CDTI, each scenario maintained a traffic density of 10-12 primary aircraft (median 11) plus an additional 11-16 secondary, distractor/ blocking aircraft (median 12.5). Compared to Experiment 1, this was approximately double the primary traffic density, and triple the overall density. One participant, a professional FAA ATC instructor, judged Experiment 2’s overall traffic density as “moderate” (his word) compared to real-life enroute traffic. 4CAS showed the MS and CRs corresponding to the current traffic situation. Each CR cube showed heading-speedaltitude triplets predicted to intersect with traffic within the next 6 min. CRs were translucent, allowing pilots to see the 3D planning cursor even when obscured by other CRs. Each CR cube’s color corresponded to that maneuver’s predicted available maneuver time (minutes-to-predicted separation failure); colors were based on three anchor colors, with intermediate
values linearly interpolated from integer RGB values. A color/time reference bar was displayed under the MS. Dependent Measures. These were identical to Knecht (2007), except for new measure, 3D normalized path length. This equaled the sum of normalized path increments, reflecting total path length in “standard units,” letting lateral deviation of 5 nm count the same as vertical deviation of 1000 ft. Training. Training was kept brief, to explore inherent ease-of-use. Pilots received a one-page description of the task, a one-page description of the CDTI, and one for 4CAS. They then practiced on two training scenarios as desired before starting data collection. Most elected to start after about 25-30 min. After completion of four test scenarios, pilots received a short break, and then retrained similarly for the second half. Results Table 1 summarizes the relative performance of CDTIonly trials versus 4CAS+CDTI trials for 12 participants x 4 trial-pairs each = 96 total trials.
Table 1. Experiment 2, relative performance of CDTI-alone versus CDTI + 4CAS trials. Mean m 1 Mean m 2 p (2-tail) p (1-tail) (1) (CDTI(CDTI + Dependent measure m 1 v. m 2 m 1 v. m 2 only) 4CAS) Efficiency Measures 4.6E -10 1 False alarms (2) N=12 N=2 0.002 2 Unnormalized path length (sm)
(3)
3 Normalized 3D path length (std units, SU) 4 3d maximum deviation fr path (SU)
(3)
(3)
5 Rmin (scenarios w no PDs, N=74, SU) 6 Rmin (scenarios w 1 PD / pair, N=22, SU) 7 Maneuver onset time (sec)
(3)
8 Pilot Deviations, duration (sec) 9 Pilot Deviations (experiment-wide counts)
lower/upper .95 CI for effect
Significant?
p =.167
0 / .38
Yes
Wilcoxon
-.18 sm
-.712 / +.004
Yes
Binomial
Effect size
Sign
Yes
84.8250
84.3395 .076
16.1568
15.1367 .0000005
Wilcoxon
-.91 SU -1.219 / -.559
Yes
1.56
0.68 .0000009
Wilcoxon
-.77 SU -1.104 / -.436
Yes
Wilcoxon
-.07 SU
-.131 / -.015
Yes
Wilcoxon
.15 SU
1.21 1.13 .021 Safety Measures 1.04 1.19 .013 109.09
54.43 .00046
11.60
6.32 .050
N=10 N=2 .033 Workload Measures 5.92 3.25 .00002
.035
(5, 6)
test
.050 / .246
Yes
Wilcoxon -51.5 sec -79.8 / -27.0 Wilcoxon -8.83 sec -18.9 / -.1
Yes
Wilcoxon
-1 PD
-1.0 / 0.0
Yes
Yes
Wilcoxon
-2.5
-3.5 / -1.5
Yes
1.63
1.00 .00011
Wilcoxon
-.5
-1.0 / 0.0
Yes
6.35
4.08 .0010
Wilcoxon
-2.0
-3.5 / -1.0
Yes
1.69
1.25 .0045
Wilcoxon
-.5
-1.0 / 0.0
Yes
14 Ease of avoiding traffic
4.33
5.67 0.007
Wilcoxon
1.5
0.5 / 2.0
Yes
15 Sufficient time to avoid traffic
4.42
5.67 .0152
Wilcoxon
1.5
0.0 / 2.0
Yes
16 Enjoyability of use
4.42
5.08 0.136
Wilcoxon
No
17 Reasonability of basic concept
5.25
5.67 0.096
Wilcoxon
No
18 Training required (hr)
4.08
3.42 0.101
Wilcoxon
No
10 N. of maneuvers / scen. (all trials, N=96) 11 N. maneuver types used /scen. (N=96) 12 N. maneuvers made / scen.
(3)
13 N. maneuver types used / scen.
(1) (2) (3) (4) (5) (6)
(3, 4)
(4)
Measures 2-13 compare matched scenario pairs. M 14-17 are based on a Likert scale of 1-6, higher numbers implying superiority. M 18 is estimated number of hr training needed to achieve competency with real traffic of the same difficulty. Computed only for the 2 scenarios per participant where maneuver was un necessary (total N=24) Computed only for the 6 scenarios where maneuver was necessary (total N=72) Maximum of 3 per scenario (heading, speed, and/or altitude). "Effect size" for false alarms = estimated probability of having a FA w CDTI+4CAS = 2/12 = .167 Wilcoxon effect size = Hodges-Lehmann estimator = median units change from CDTI-only condition to CDTI+4CAS.
All statistics, plus, effect size estimators, and confidence intervals (CI) are described in Hollander and Wolfe (1999). The binomial test of false alarm rate used the rate from the CDTI+4CAS trials (2/12) as its base rate during the expansion
of the binomial ((10/12) + (2/12))12 ; therefore, p reflects the chance of getting the observed 100% false alarms, given the estimated base rate (i.e., p = (2/12)12 ).
PROCEEDINGS of the HUMAN FACTORS AND ERGONOMICS SOCIETY 52nd ANNUAL MEETING—2008
Statistics 2-18 reflect matched-scenario pair difference scores (4CAS+CDTI trial – CDTI-only trial). Therefore, negative effect sizes mean that the 4CAS+CDTI scores are lower. All measures were statistically significant, except as noted. Unwanted effects. Regression of dependent measures onto treatment order found no meaningful effects of fatigue or learning. Based on pairwise Wilcoxon reliabilities, mirrorimage scenario pairs appeared functionally equivalent, with no uniform directionality to score ranks for bases or mirrors. DISCUSSION The term veridical means “coinciding with, or representing, physical reality.” The term maneuver space is defined to mean a 4D nonveridical state space unique to each aircraft, dimensionalized by that aircraft’s a) heading, b) speed, c) altitude, and d) available maneuver time. Maneuver space represents conflictual and non-conflictual maneuvers achievable by one aircraft within a fixed period of time, given the obstacles predicted along each potential maneuver’s hypothesized path. This work constitutes Experiment 2 in a planned series of tests of a nonveridical, MS-based four-dimensional collision avoidance system called 4CAS. 4CAS is not meant to replace veridical traffic displays—merely to augment them. Twelve general aviation pilots were tested, using moderate traffic density and complex traffic geometry. The CDTI+4CAS condition showed performance superiority over the baseline CDTI-only condition for five out of five dependent measures of maneuver efficiency, four of four measures of maneuver safety, and six of nine measures of user workload. Experiment 2 suggests that human operators can effectively use a complex, 4D nonveridical information display. So far, training needs and user acceptance appear similar to those a task-equivalent veridical display (the CDTI). ACKNOWLEDGMENTS The Wolf Aviation Fund graciously funded participant salaries. Dr. Kevin Williams skillfully coded the first version of a CDTI which served as the foundation for the one used here. David McClurkin, Chief Flight Instructor, University of Oklahoma School of Aviation, was invaluable in pilot recruitment. REFERENCES Bakker, G.J., Kremer, H.J., & Blom, H.A.P. (2000, June). Geometric and probabilistic approaches towards conflict prediction. Paper presented at the 3rd USA/Europe Air Traffic Management R&D Seminar, Napoli, Rome.
83
Canton, R., Refai, M, Johnson, W.W., & Battiste, V. (2005). Development and integration of human -centered conflict detection and resolution tools for airborne autonomous operations. Proceedings of the 13th International Symposium on Aviation Psychology (pp. 115-120). Columbus, OH: Ohio University Press. Erzberger, H., Paielli, R.A., Isaacson, D.R., & Eshowl, M.M. (1997, June). Conflict detection and resolution in the presence of prediction error. Paper presented at the 1 st USA/Europe Air Traffic Management R&D Seminar, Saclay France. Federal Aviation Administration. (2006). Order 7110.65R Air traffic control. Washington, DC: Author. Granada, S. Quang Dao, A., Wong, D., Johnson, W.W., & Battiste, V. (2005). Development and integration of a human-centered volumetric cockpit situation display for distributed air -ground operations. Proceedings of the 13th International Symposium on Aviation Psychology. (pp. 279284). Columbus, OH: The Ohio University Press. Hoekstra, J.M., Ruigrok, R.C.J., & van Gent, R.N.H.W. (2000, June). Free flight in a crowded airspace? Paper presented at the 3rd USA/Europe Air Traffic Management R&D Semina r, Napoli, Rome. Hilburn, B., & Flynn, G. (2005). Modeling cognitive complexity in air traffic control. Human Factors and Aerospace Safety, 5(2), 169-182. Hollander, M., & Wolfe, D.A. (1999). Nonparametric statistical methods (2nd ed.). New York: Wiley. Johnson, W.W., Battiste, V., & Holland, S. (1999). A cockpit display designed to enable limited flight deck separation responsibility. SAE Transactions, Journal of Aerospace, 108 (1), 1041-1062. Knecht, W.R. (2007). Testing a nonveridical aircraft collision avoidance system: Experiment 1. International Journal of Applied Aviation Stu dies, 7(1), 60-82. Downloadable from http://www.faa.gov/ about/office_org/headquarters_offices/arc/programs/academy/journal/ pdfs and native files/FinalIJAAS SP-2007.pdf Knecht, W.R., & Hancock, P.A. (1999). Separation maintenance in high-stress free flight using a time -to-contact-based cockpit display of traffic information. Proceedings of the 4th Annual Meeting of the Human Fa ctors and Ergonomics Society. (pp. 16-20). Santa Monica, CA: Human Factors and Ergonomics Society. Knecht, W.R., & Smith, K. (2001) The manoeuvre space. In D. Harris (Ed.), Engineering psychology and cognitive ergonomics. Aldershot: Ashgate. Kuchar, J.K., & Yang, L.C. (2000). A review of conflict detection and resolution modeling methods. IEEE Transactions on Intelligent Transport ation Systems. 1(4), 179-89. Naikar, N. (1998). Perspective displays: A review of human factors issues. Retrieved December 13, 2006 from Australian Government, Dept. of Defense, Defence Science and Technology Organisation Web site: http://www.dsto.defence.gov.au/publications/2069/DSTO-TR-0630.pdf. Pekela, W.D., & Hilburn, B. (1998, Sept). Air traffic controller strategies in resolving free flight traffic conflicts: The effect of enhanced controller displays for situation awareness. Paper presented at the AIAA and SAE World Aviation Conference, Anaheim, CA. Thomas, L.C., & Wickens, C.D. (2005). Display dimensionality and conflict geometry effects on maneuver preferences for resolving in-flight conflicts. Proceedings of the Human Factors and Ergonomics Society 49th Annual Meeting. (pp. 40-44). Santa Monica, CA: Human Factors and Ergonomics Society. Van Dam, S.B.J, Appleton, R., Mulder, M., & van Paassen, M.M. (2006, September). Comparison of two interfaces for supporting pilots in airborne self-separation tasks. Paper presented at the International Conference on Human-Computer Interaction in Aeronautics, Seattle, WA. van Gent, R.N.H.W., Hoekstra, J.M., & Ruigrok, R.C.J. (1998, May). Free flight with airborne separation assurance: A man-in-the loop simulation study. Paper presented at the International Conference on Human Computer Interaction in Aeronautics , Montreal, Canada.