Taxi-out Prediction using Approximate Dynamic Programming Submitted to the TRB 2008 Annual Meeting Submission date: August 1, 2007 Total number of words:fill Poornima Balakrishna, Ph.D. Candidate Department of Systems Engineering and Operations Research George Mason University Fairfax, VA 22030 Phone: 703-993-1693 Fax: 703-993-1521
[email protected] Corresponding Author Rajesh Ganesan, Ph.D. Department of Systems Engineering and Operations Research George Mason University Fairfax, VA 22030 Phone: 703-993-1693 Fax: 703-993-1521
[email protected]
Lance Sherry, Ph.D. Department of Systems Engineering and Operations Research George Mason University Fairfax, VA 22030 Phone: 703-993-1711 Fax: 703-993-1521
[email protected]
P.Balakrishna, R.Ganesan, L.Sherry
2
ABSTRACT High taxi-out times (time between gate push-back and wheels off) at major airports is a primary cause for flight delays in the National Airspace System (NAS). These delays have a cascading effect and affect the performance of Air Traffic Control (ATC) System. Accurate prediction of taxi-out time is needed to make downstream schedule adjustments and better departure planning, which mitigates delays, emissions, and congestions on the ground. However, the accurate prediction of taxi-out time is difficult due to the uncertainties associated with them. The primary objective of this paper is to accurately predict taxi-out time at major airports, in the presence of weather and other departure-related uncertainties. This paper presents a novel reinforcement learning (RL) based stochastic approximation scheme for predicting taxi-out times. The prediction problem is cast in a probabilistic framework of stochastic dynamic programming and solved using approximate dynamic programming (ADP) approaches. The strengths of the method is that is it non-parametric unlike the regression models with fixed parameters, highly adaptable to the dynamic airport environment since its learning based, is scalable, is inexpensive since it does not need highly sophisticated surface management system, and effectively handles uncertainties due to the probabilistic framework. The taxi-out prediction performance was tested on data obtained from the FAA’s Aviation System Performance Metrics (ASPM) database on Detroit Metropolitan Wayne County International Airport (DTW), and Washington Reagan National (DCA) airports. Results show that the average prediction error 15 minutes before gate departure for about 80% of the flights was less than 2.9 min. 1. INTRODUCTION Flight delays are one of the most pressing problems that have far reaching effects on both the society and nation’s economy. The United States National Airspace System (NAS) is one of the most complex networked systems ever built, and has several components to it. The major components include the administration, control centers, airports, airlines, aircrafts, and passengers. The complexity of NAS poses many challenges for its efficient management and control. One of the challenges includes reducing flight delays. Delays propagate throughout the system and it increases with time over the length of the day. This is known as the cascading effect and it means that there are fewer delays in the morning than in the evenings. Delays result in losses for the airlines via cancellations, increased passenger complaints, and difficulty in managing the airline and airport operations since both gate operations and air traffic controllers (ATC) could simply be overwhelmed at certain peak hours by too many take-offs and landing aircrafts. Delays are caused by several factors. Some of these include increases in demand, near capacity operation of the major hubs (leads to congestion), weather, and air traffic management programs such as the ground delay program (GDP). GDP is said to be in effect, when an aircraft is held at the gate of the origin airport due to delays experienced at the destination airport. Hence, it is necessary for all stakeholders (the Federal Aviation Administration (FAA), airlines, passengers (PAX), and the ATC) to stay informed, understand the causes, and find solutions to predict and mitigate the delays. The delay phenomenon is continuously evolving, and is both stochastic and elastic. The stochastic nature is due to the uncertainties that lie at the local level (such as the local control tower, arrival/departures movements on ground, human causes), system level (such as GDP), and in the environment (weather). The elastic behavior is due to the fact that delay could be adjusted (positively or negatively) by flying speed, taking alternate routes, turnaround time on the ground, position in the departure clearance queue especially during busy hours of the airport. Thus, total delay of a flight segment from its origin to destination comprises
P.Balakrishna, R.Ganesan, L.Sherry
3
of turn-around time delay, gate-out delay, taxi-out delay, airborne delay, taxi-in delay, and gatein delay. Among these delay elements, historical data indicates that, taxi-out time contributes to over 60% of the total delay. Hence, it is imperative to minimize taxi-out delay, which we believe has a significant impact on the efficiency of airport operations and on the performance of the entire NAS. In order to minimize taxi-out delay, it is necessary to accurately predict taxi-out under dynamic airport conditions. This information in turn will allow the airlines to better schedule and dynamically adjust departures, which minimizes congestions, and the control towers will benefit from smoother airport operations by avoiding situations when demand (departure rates) nears or exceeds airport capacity. There is also a great potential for increased and efficient utilization of the airport capacity, which is one of the key focus items of NGATS, as per the report from Joint Program and Development Office (JPDO) [1]. This will also lead to significant improvement in the capabilities for Flow Contingency Management and Tactical Trajectory Management, and will benefit the implementation of an holistic Total Airport Management (TAM) system [2]. As an example of a future concept of automating airport control towers and Terminal Radar Control (TRACON) operations, it will be necessary to predict airport dynamics such as taxi-out times, and feedback this information for aiding artificial intelligence-based departure time decision making at airport operational level. Improved taxi-out time prediction can be used by airline operating centers (AOC), and airline station operations to increase utilization of ground personnel and resources. The primary contribution of this paper include a novel, inexpensive, adaptive, and efficient methodology for taxi-out prediction, which is built by developing a stochastic dynamic programming model and solved using artificial intelligence based reinforcement learning (RL) (a strand of Approximate Dynamic programming, ADP). Other contributions include a state-of-theart literature review of taxi-out-prediction research and results from validating the methodology on DTW and DCA airports using data from FAA’s Aviation System Performance Metrics (ASPM) data base. The paper is organized as follows. In Section 2 we present a literature review of taxi-out prediction methods and the RL based stochastic approximation scheme. In Section 3 we present the RL methodology for taxi-out prediction. Section 4 presents the results from validating the RL methodology for predicting taxi-out time at DTW and DCA airports. Conclusions and future work are presented in Section 5. 2. LITERATURE REVIEW Many recent studies have proposed different methods to predict and then use the prediction to minimize taxi-out times. One such study is to predict gate push back times using Departure Enhanced Planning And Runway/Taxiway Assignment System (DEPARTS) (Cooper et al.), in which the objective for near-term departure scheduling is to minimize the average taxi-out time over the next 10 to 30 minutes, to get flights into the air from the airport as early as possible without causing downstream traffic congestion in the terminal or en route air space. DEPARTS uses a near-real time airport information management system to provide its key inputs, which it collects from the airport’s surface movement advisor (SMT), and recommends optimal runway assignment, taxi clearance and takeoff clearance times for individual departures. The sensitivity of taxi-out delays to gate push back times was also studied using the DEPARTS model. Other research that develops a departure planning tool for departure time prediction is available in
P.Balakrishna, R.Ganesan, L.Sherry
4
Barrer et al. 1989, Idris et al. 1998, Anagnostakis et al. 2000, Shumsky,1997 and Lindsay et al. 2005. Direct predictions attempting to minimize taxi-out delays using accurate surface surveillance data have been presented to literature (Clow et al. 2004, Welch et al. 2001). Recent work using surface surveillance data presented in (Signor and Levy 2006) develops a bivariate quadratic polynomial regression equation to predict taxi time. In this work data from Air Situation Data to Industry (ASDI) and that provided for Northwest Airlines for DTW (Flight Event Data Store, FEDS) were compared with surface surveillance data to extract gate OUT, wheels OFF, wheels ON, and gate IN (OOOI) data for prediction purposes. The analysis presented suggest that division of the data into different taxi paths (depending on the Airport Diagram) may at times result in a reduction of standard error by one-tenth of a minute. Algorithms adapted to taxi-time prediction such as space time network search which uses Dijkstra’s algorithm and event based A* and co-evolution based genetic algorithm have been compared in Brinton et al. 2002. Cheng et al. 2001 studied aircraft taxi performance for enhancing airport surface traffic control in which they consider the surface-traffic problem at major airports and envision a collaborative traffic and aircraft control environment where a surface traffic automation system will help coordinate surface traffic movements. In specific, this paper studies the performance potential of high precision taxi towards the realization of such an environment. A state-of-the-art nonlinear control system based on feedback linearization is designed for a detailed B-737 aircraft taxi model. Other research that has focused on departure processes and departure runway balancing are available in Atkins and Walton 2002, and Idris et al. 1999. Many statistical models that consider the probability distribution of departure delays and aircraft takeoff time in order to predict taxi-time have evolved in recent years (Tu et al. 2005, and Shumsky 1995). Idris et al. 2002 developed a queuing model for taxi-time prediction. They identify takeoff queue size to be an important factor affecting taxi-out time. An estimate of the takeoff queue size experienced by an aircraft is obtained by predicting the amount of passing that it may experience on the airport surface during its taxi-out, and by considering the number of takeoffs between its pushback time and its takeoff time. The model is valid for a specific runway configuration since the runway configuration at the future time of taxi-time prediction is unknown. Suggested extensions to the model include a runway configuration predictor. Test data for a period of one month obtained from the ASQP database showed that the queuing model predicted 66% of the taxi-out times within 5 minutes of the actual time, while a running average model predicted 54% of the flights within the same margin or error. Levine and Gao developed a queuing model based on simulation to test different emissions scenarios related to duration of taxi-out. Some of the scenarios considered are redistribution of flights evenly across the day and variation in number of departure under current capacity. The study showed that lower taxi-out times (and thus lower emissions) are experienced by airlines that use less congested airports and don’t rely on hub-and-spoke systems. A Bayesian networks approach to predict different segments of flight delay including taxi-out delay has been presented in Laskey et al. 2006. The method used in this research is new and is learning-based (uses artificial intelligence). It is significant since the method has the potential to solve large-scale stochastic dynamic systems of which the airport control system is a subset. The prediction accuracy obtained 15 minutes before departure is very high and is comparable to methods that use sophisticated surface management systems as described above.
P.Balakrishna, R.Ganesan, L.Sherry
5
2.1 RL literature and motivation for a model free approach: The sequential decision making by air traffic Managers for DAC can be perceived as a stochastic control problem. Control theory has its roots in many disciplines with a multitude of applications. Typically, control theory is classified into optimal, robust, and adaptive control. The literature reviewed here pertains to the model-based and model-free classification of control theory and provides a historical motivation for pursuing the model-free approach. 2.1.1 The model-based controllers These controllers use two main types of models: differential-algebraic equations and difference equations. The differential-algebraic equation approach has been used for both linear and linearquadratic optimal control [4], and in control of non-linear systems [6]. Robust control for nonlinear systems has been addressed by [8], which in turn reduces to finding a solution to the Hamilton-Jacobi-Bellman (HJB) equation. In recent years, linear and non-linear hybrid dynamical system (HDS) has been the focus of research [9-10]. The most popular form of control using difference equations is the Run-by-Run (RbR) controller in which the control laws are obtained from designed experiments and/or regression models. Some of the RbR methods are given in [21]. Model-based simulation techniques have been used for the control of discrete-event dynamic systems (DEDS) but lack closed form solutions [33]. Some primary limitations of above model-based controllers are that 1) they depend on good process models, 2) control actions are based on the parameters of the model, which are often fixed, 3) they cannot handle large perturbations of the system because the system is not intelligent, 4) they need multiple filtering steps to compensate for drifts and autocorrelation, and 5) they lack scalability. One of the ways to handle the above limitations is through a process model-free (data-driven) learning-based control, which is a simulation-based optimization technique. Learning-based model free approaches for taxi-time prediction would overcome many limitations of regression model based approaches with constant parameters that are not suitable in the presence of adverse events such as weather that affect airport operations. Another limitation arises due to the complex nature of airport operations and the uncertainties involved, which often make it difficult to obtain mathematical models to describe the complete airport dynamics. In such situations model-free learning based techniques perform better than model based approaches. A unique feature of this model free approach is its adaptive nature to changing dynamics of the airport. 2.1.2 Process model-free (Dynamic Data Driven) control Model-free control systems, though have been in existence, their potential has not been fully explored. Typically, these systems use some form of artificial intelligence such as neural networks, fuzzy-logic rules, and machine learning. They have strong mathematical foundations underlying their construction. Some of these systems, particularly neural networks and fuzzylogic rules, though are claimed to be model-free, do contain certain hidden or implicit models and make certain strong modeling assumptions when it comes to proving the stability of the controller [36]. 2.1.3 (Near-) optimal control and Approximate Dynamic Programming (ADP)
P.Balakrishna, R.Ganesan, L.Sherry
6
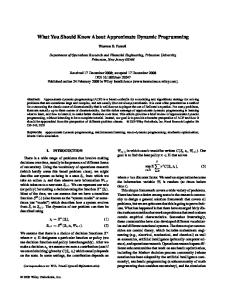
Stochastic approximation methods have been proved to be effective for control of non-linear dynamic systems. In this method the controller is constructed using a function approximator (FA). However, it is not possible for a model-free framework to obtain the derivatives necessary to implement standard gradient-based search techniques (such as back-propagation) for estimating the unknown parameters of the FA. Usually such algorithms for control applications rely on well-known finite-difference stochastic approximations (FDSA) to the gradient [41]. The FDSA approach, however, can be very costly in terms of the number of system measurements required, especially in high-dimensional problems for estimating the parameters of the FA vector. This led to the development of Simultaneous Perturbation Stochastic Approximation (SPSA) algorithms for FA, which is based only on measurements of the system that operates in closed-loop [42]. Among the several variants and applications of SPSA, the implementation of SPSA in simulation-based optimization using Reinforcement Learning (RL) offers several advantages in solving many stochastic dynamic sequential decision-making problems of which the control problem is a subset [49]. RL (a strand of ADP) is a method for solving Markov Decision Processes (MDP), which is rooted in the Bellman [51] equation, and uses the principle of stochastic approximation (e.g. Robbins-Monro method [52]). Howard [53] first showed how the optimal policy for a MDP may be obtained by iteratively solving the linear system of Bellman equations. Textbook treatment of this topic and convergent average reward RL algorithms can be found in [55-56]. The connection between various control theories and ADP is available in [58]. Some applications of ADP are available in [59, 63]. 3. RL METHODOLOGY FOR TAXI-OUT PREDICTION In this section we show how a novel machine learning approach is used for the task of taxi-out time a ∈ A prediction. The evolution of system state x ∈ X is modeled as a Markov chain. The decision to predict the taxi-out time based on the system state is modeled as a Markov decision process (MDP). For the purpose of solving the MDP, it is necessary to discretize X and A. Due to the large number of state and action combinations (x,a), the Markov decision model is solved using a machine learning (reinforcement learning, in particular) approach. We first present a formal description of the MDP model and then discuss the RL approach to solve the model. The RL based functional block diagram for taxi-out prediction is shown in Figure 1. 3.1 MDP model for taxi-out prediction Assume that all random variables and processes are defined on the probability space (Ω, F , P) . The system state xt = (x1,x2,x3,x4) at time t is defined as the number of flights in the departure queue waiting for take off (x1), number of departing flights taxiing (x2), number of arriving flights that are taxiing (x3) and the average taxi time in the last 30 minutes from current time (x4). A flight is said to be waiting in the departure queue if it has exceeded the nominal taxi time and has still not departed. Since, it can be easily argued that xt+1 is dependent only on xt the random process Xt is a Markov chain. Since the state transitions are guided by a decision process, where a decision maker selects an action (taxi-out prediction) from a finite set of actions at the end of each run, the combined system state process and the decision process becomes a Markov decision process. The transition probability in a MDP can be represented as p(x,a,q), for transition from state x to state q under action a. Let X denote the system state space, i.e., the set of all possible values of x. Then the prediction system can be stated as follows. For any given x ∈ X at time t there is an
P.Balakrishna, R.Ganesan, L.Sherry
7
prediction a such that the expected value of error yt=(Actual Taxi-Out – predicted TO) is zero. Theoretically, the action space for the predicted taxi-out could have a wide range of numbers. However, in practice, for a non-diverging process, the action space is quite small, which can be discretized to a finite number of actions. We denote the action space as A. Several measures of performance such as discounted reward, average reward, and total reward can be used to solve a MDP. We define reward r(x,a,q) for taking action a in state x at any time t that results in a transition to state q, as the absolute value of error = |Actual Taxi-Out – predicted TO| resulting from the action. Since the objective of the MDP is to develop an action strategy that minimizes the actual error, we have adopted discounted reward as the measure of performance. In the next subsection, we provide the specifics of the taxi-out prediction methodology using a RL based stochastic approximation scheme. 3.1.1 Reinforcement Learning RL is a simulation-based method for solving MDPs, which is rooted in the Bellman [] equation, and uses the principle of stochastic approximation (e.g. Robbins-Monro method []). The purpose of the RL estimator is to predict taxi out time given the dynamic system state. The dynamic system state evolution is modeled as a Markov chain and the prediction process is modeled as a Markov decision process. The MDP process is solved using RL based stochastic approximation schemes. The input to RL is the system state and the output of the learning process is a reward function R(X,P) where P is the predicted taxi out values. The utility function (reward) R(X,P) is updated based on the difference between the actual an predicted taxi-out values. Mathematical details of the RL based prediction methodology are available in [22] and is not presented here for the sake of brevity. Bellman's optimality equation for discounted reward says that there exists R* that satisfies the following equation: R* = min[r ( x, a) + β ( ∑ p( x, a, q) R * (q))] a∈A
q∈X
where R* is the optimal bias and 0 < β < 1 is the discount factor. The above optimality equation can be solved using the relative value iteration (RVI) algorithm as given []. However, the RVI needs the transition probabilities p(x,a,q), which are often, for real life problems, impossible to obtain. An alternative to RVI is asynchronous updating of the R-values through Robbins-Monro (RM) stochastic approximation approach, in which the expected value component ∑ p( x, a, q) R * (q) can be replaced by a sample value of q∈X
R(q) obtained through simulation. The RL algorithm is a learning based stochastic approximation scheme, which learns R*(x,a) for all x ∈ X and a ∈ A . Convergent average reward RL algorithms (R-learning) can be found in [], and []. The strategy adopted in R-Learning is to obtain the R-values, one for each state-action pair. After the learning is complete, the action with the highest (for maximization) or lowest (for minimization) R-value for a state constitutes the optimal action. Particularly in prediction and control problems, reinforcement learning has significant advantages as follows: 1) it can learn arbitrary objective functions, 2) there is no requirement to provide training examples, 3) they are more robust for naturally distributed system because multiple RL agents can be made to work together toward a common objective, 4) it can deal with the `curse of modeling' in complex systems by using simulation models instead of exact analytical models that are often difficult to obtain, and 5) can
P.Balakrishna, R.Ganesan, L.Sherry
8
incorporate function approximation techniques in order to further alleviate the `curse of dimensionality' issues. The Bellman's equation given above can be rewritten in terms of values for every stateaction combination as follows. Bellman's theory of stochastic dynamic programming says that the optimal values for each state-action pair (x,a) can be obtained by solving the discounted reward optimality equation R * ( x, a) = ∑ p( x, a, q)r ( x, a, q ) − β [ ∑ p( x, a, j ) minR * ( j , b)] ∀x, ∀a q∈X
b∈A
j∈X
A learning version of the above equation that we have adopted to solve the optimal values for each state-action combination R*(x,a) is as follows.
Rt+1( x, a) = (1 − α )Rt ( x, a) + α [r( x, a) + β minRt ( j, b)] b∈A
x, j ∈ X
a∈ A
In the above equation, 0 < α < 1 is the learning parameter which is gradually decayed. At the beginning of the learning process, the R-values are initialized to zeros. When the process enters a state for the first time, the action is chosen randomly since the R-values for all actions are zero initially. In order to allow for effective learning in the early learning stages, instead of the greedy action the decision maker with probability Pt chooses from other actions. The choice among the other actions is made by generating a random number from a uniform distribution. The above procedure is commonly referred to in literature as exploration. The value of Pt (called the exploration probability) is decayed faster than the learning parameters. 3.2 Obtaining predicted taxi-out time Once learning is completed, the R-values provide the optimal action choice for each state. At any time t as the process enters a state, the action a corresponding to the lowest non-zero absolute R-value indicates the predicted taxi-out time a. In what follows we present the steps of the RL algorithm in the implementation phase.
FIGURE 1: RL based functional block diagram for taxi-out prediction 3.3 Steps in RL Intelligence is gathered in 3 stages: exploration, learning and learnt.
P.Balakrishna, R.Ganesan, L.Sherry
9
Step 1: Once the states, actions, and the reward scheme are step up, the next step is to simulate the t+45 look-ahead window as shown in Figure 1. Assume 15 minute decision (prediction) epochs i.e prediction was done for flights in a moving window of length t to t+15 minutes. This means that for each departing flight in the 15 minute interval from current time, the airport dynamics was simulated for 30 minutes from its scheduled departure time. Step 2: Simulate the first 15 minute window. For each flight in the window obtain the system state x. To calculate average taxi-out times before current time t, actual flight data between t and t-30 are used. Initialize R(x,a) to zeros. Step 3: If exploration has decayed go to step 4, else choose arbitrary actions (predictions from set A). The window is then moved in 1 minute increments and all flights in the window are predicted again. This means that every flight, unless it leaves before scheduled time, its taxi-out time will be predicted at least 15 times. Simulate the new window of 15 minutes. Find the next state j for each flight. Compute r(x,a). Update reward R(x,a) using the fundamental Robbin-Monro’s stochastic approximation scheme [52] that is used to solve Bellman’s optimality equation [51] (called R-value learning). This is given as Rt+1( x, a) = (1 − α )Rt (x, a) + α [r( x, a) + β minRt ( j, b)] x, j ∈ X a ∈ A b∈A
Step 4: If learning phase is in progress, choose greedy action a from set A (action corresponding to the lowest R-value). The window is then moved in 1 minute increments and all flights in the window are predicted again. Simulate the new window of 15 minutes. Find the next state j. Compute r(x,a). Update R(x,a). Step 5: Continue learning by simulating every 15 minute interval, until 45 minutes have been completed. Next, move the window of width 45 minutes by a fixed time increment (say 15 minutes) and repeat learning by going to Step 2. Step 6: Continue learning with several months of ASPM data until a stopping, or a nearoptimal criterion is reached such as | R t +1 ( x, a) − R t ( x, a) |≤ ε where ε is a very small number. Step 7: Once learning is complete, the near-optimal decision for a given state is the one that corresponds to the minimum R-value for that state.
4.RESULTS In this section we describe the results from applying the RL-based algorithm for taxi-out time prediction. 4.1 Data source OOOI data for DTW and DCA airports was extracted from the Aviation System Performance Metrics (ASPM) data base maintained by Federal Aviation Administration (FAA). The data from 1st May 2006 to 26th July 2006 was used to train the RL based Taxi-out time predictor. Testing was done on data from July 27th to July 31st 2006 (DTW).
Dates for DCA The following were extracted from the ASPM database for each individual flight: flight number, actual on time (ACTONTM), actual in time (ACTINTM), actual out time
P.Balakrishna, R.Ganesan, L.Sherry
10
(ACTOUTTM), actual off time (ACTOFFTM), scheduled out time (SCHOUTTM), actual taxi out time (ACTTO), actual taxi in time (ACTTI), nominal taxi in time (NOMTI), and nominal taxi out time (NOMTO). 4.2 Model parameters The learning rate α was fixed to be 0.7 and decayed slowly. The discount rate β was fixed at 0.9. The exploration probability Pt was fixed at 0.5 and decayed faster than the learning rate. The variables in the system states xt = (x1,x2,x3,x4) were discretized into 26, 10, 10, 12 values, which yielded 31200 states. The actions (predicted taxi-out values) were dicretized into 41 values from 5 min to 45 min taxi-out time. 4.3 Model assumptions and performance metrics Due to lack of gate and runway allocation information from ASPM database, if 2 runways are for departures, then a queue size of 15 would mean about 7-8 flights in each runway. It is assumed that runways are used equally. It is also assumed that the nominal TO time is an indicator of the nearness of the runway from the gate. Also size of aircraft was not considered in the prediction algorithm. A common model valuation metric is the root mean square error (RMSE) between the actual and predicted taxi-out values. Also mean, median and standard deviation of the actual and predicted taxi-out times were compared. The RL based estimator was coded using Matlab software. 4.4 Observations Figure 2 indicates that there is a strong correlation between taxi-out time and the following factors:
(1) Number in departure queue (A flight is considered in queue if its real time TO has exceeded its unimpeded TO and the flight has still not taken off with respect to current time). (2) Number of departing flights that are taxiing (A departing flight is considered taxiing if its real time TO has NOT exceeded its unimpeded TO and the flight has still not taken off with respect to current time). As the number of departures increases the queue size increases after a lag. Also the taxiout time increases. DTW displays an oscillating High and Low taxi-out times throughout the day. It also shows that it’s necessary to consider the behavior of the above factors over a time period (say 30 min) from the scheduled gate out time to make an accurate prediction of taxi out time based on a look-ahead airport dynamics. Similar observations were noted for DCA airport operations.
P.Balakrishna, R.Ganesan, L.Sherry
11
FIGURE 2: Plot of the number of departure flights taxiing, queue length at runway, and actual taxi out times for DTW: May 1st 2006. 2) To evaluate the algorithm we compare predicted taxi-out times with the actual observed data available from the ASPM database via the FAA website. Some of the statistical parameters are summarized in Table 1 for DCA and DTW airports. TABLE 1: Prediction statistics for DCA and DTW DCA 1
DCA 2
DCA 3
DCA 4
DCA 5
DTW 27
DTW 28
DTW 29
DTW 30
DTW 31
Mean Actual Taxi Time (min)
12.9
16.48
13.06
14.07
15.42
19.59
16.27
15.93
17.7
17.04
Mean Predicted Taxi Time (min) Std. Dev. Actual Taxi Time (min) Std. Deviation Predicted Taxi Time (min) Median Actual Taxi Time (min) Median Predicted Taxi Time (min) % of Flights with RMSE as given below RMSE (min)
13.73
14.39
13.73
14.51
16.12
17.07
16.8
16.22
17.27
17.13
4.51
7.44
4.56
6.93
5.56
6.89
5.08
4.9
5.83
5.12
3
3.61
3.2
3.65
4.29
3.04
2.5
2.59
3.04
2.77
12
13.8
12
12
15
18
16.2
15
16.8
16.2
13.13
13.33
13.01
13.23
14.88
17
16.88
16.2
17.45
17.15
82
69
79
67
76
73
82
82
78
79
2.9
2.96
2.52
2.89
3.07
3.04
2.83
2.9
3.19
2.92
Date July 2006
P.Balakrishna, R.Ganesan, L.Sherry
12
It was observed that the mean of predicted taxi-out times is not significantly different (statistically) from the mean of actual taxi-out times. However, we notice that the standard deviation of predicted taxi-out times is significantly different (statistically) from the standard deviation of the actual observed taxi-out times. The larger spread of actual taxi-out times explains the reason why only on average about 80% of the flights are predicted with RMSE of