TARGETING THE CANCER METABOLIC PHENOTYPE USING HIGH DOSE VITAMIN B1 THERAPY by BRADLEY SCOTT HANBERRY (Under the Direction of Dr. Jason Zastre) ABSTRACT The dichotomous effect of thiamine supplementation on cancer cell growth is characterized by growth stimulation at low doses and growth suppression at high doses. Unfortunately, how thiamine affects cancer cell proliferation is currently unknown. Recent focuses on metabolic targets for cancer therapy have exploited the altered regulation of the thiamine-dependent enzyme pyruvate dehydrogenase (PDH). Cancer cells inactivate PDH through phosphorylation by overexpression of pyruvate dehydrogenase kinases (PDKs). Inhibition of PDKs exhibits a growth suppressive effect in many cancers. Recently it has been shown that the thiamine co-enzyme, thiamine pyrophosphate, can regulate the phosphorylation of PDH. Therefore, we hypothesize that high dose thiamine can normalize glycolysis in cancer cells leading to a cellular apoptosis. We have determined that high dose vitamin B1 reduces cell proliferation in cancer cell lines by a mechanism involving a reduction in PDH phosphorylation. Additionally we have established that thiamine homeostasis is altered in breast cancer cells and in hypoxic microenvironments. Together these findings suggest that using high dose thiamine may provide an important targeting advantage directed towards altering the cancer metabolic phenotype.
INDEX WORDS:
Thiamine, TPK1, Pyruvate Dehydrogenase, Hypoxia, Cell Metabolism, Transport, Chemotherapy
TARGETING THE CANCER METABOLIC PHENOTYPE USING HIGH DOSE VITAMIN B1 THERAPY
by
BRADLEY SCOTT HANBERRY B.S. Biochemistry and Molecular Biology, University of Georgia, 2009 B.S. Biology, University of Georgia, 2009
A Dissertation Submitted to the Graduate Faculty of The University of Georgia in Partial Fulfillment of the Requirements for the Degree
DOCTOR OF PHILOSOPHY
ATHENS, GEORGIA 2014
© 2014 Bradley Scott Hanberry All Rights Reserved
TARGETING THE CANCER METABOLIC PHENOTYPE USING HIGH DOSE VITAMIN B1 THERAPY
by
BRADLEY SCOTT HANBERRY
Major Professor: Committee:
Electronic Version Approved: Julie Coffield Interim Dean of the Graduate School The University of Georgia December 2014
Jason Zastre Rajgopal Govindarajan Tamas Nagy Robert Arnold Mandi Murph
DEDICATION This dissertation is dedicated to my teacher and friend, Nancy Gordeuk. You instilled in me a love of science that continues to this day. Your positive attitude throughout your personal battle with breast cancer has been an inspiration to me. Thank you for showing me how fun science is!
iv
ACKNOWLEDGEMENTS When I walk across the stage and hold this degree in my hands I know that I have a huge group of supporters who have encouraged me every step of the way. To my wife, Brittany, you have been with me since day one of this journey. I remember when you looked at me 5 years ago and told me that we are in this together no matter what. You will never understand how much you meant to me during this time. You make me smile when I have a rough day, you are there to provide a listening ear even though you have no idea what I am talking about, and you are a shoulder to cry on. You have never questioned my career path and have pushed me every step of the way. I love you with all of my heart! To my parents, you shaped me into the man I have become. Even though what I do might as well be in a different language you have always made sure to ask how things in lab were going. You have always encouraged me to pursue what I love and have supported me every step of the way. You are the greatest parents any boy could ask for. I love you both so much. To my brother, Brock, thanks for encouraging me while I was doing beakers and test tubes. You have always supported me and been there for me. Even though we live apart now I can always count on you to check in one me and make sure that I am still curing cancer. I love you very much and am so proud of the man you have become. To my family, you have all been such an incredible support network for me. Gama and Gaga, you have always encouraged me even when no one else would understand. Grandmother and Bigdaddy, you have taken such an interest in my work and have always made sure to keep
v
updated on what I am doing. Aunt Cindy, Uncle George, and Nick, I am so blessed to have such a great relationship with you. Thank you for all the phone calls, notes, and dinners during the last 5 years. Eric, Sheila, Amanda, and Josh, you have made this time so much easier on Brittany and I. Thank you for your encouragement and trusting your daughter with me. I promise you I am not a professional student! To my lab mates: Becky, Kristy, and Hunter. Thank you so much for putting up with me day in and day out. Becky, as you once said we are like brother and sister. Although we were at each other’s throats we were also there to help one another through the many struggles of grad school. Kristy and Hunter, take care of Dr. Zastre for me. Y’all will both do great things. You couldn’t have chosen a better lab to be in and I know it will pay off for both of you. Work hard but enjoy what you do! To my graduation committee, you have given so much of your time and wisdom to me. They say that it takes a village to raise a child and I would also argue that it takes a graduation committee to properly train a graduate student. You have all done that and I will be forever grateful. To Dr. Zastre, where do I begin? You are the best mentor that a student could ask for. Not only are you my boss and my advisor, but also you are my friend. Thank you for putting up with me. Your have given me advice in all areas of life and I know without a doubt that I am the scientist that I am today because of you. I cannot say thank you enough.
vi
TABLE OF CONTENTS Page ACKNOWLEDGEMENTS .............................................................................................................v LIST OF TABLES ......................................................................................................................... ix LIST OF FIGURES .........................................................................................................................x CHAPTER 1
INTRODUCTION AND LITERATURE REVIEW .....................................................1 1.1 MALIGNANT ALTERATIONS .......................................................................1 1.2 THE ROLE OF COFACTORS IN CELLULAR METABOLISM .................15 1.3 RATIONALE AND GOAL .............................................................................56 1.4 RESEARCH OBJECTIVES ............................................................................57
2
HIGH-DOSE VITAMIN B1 REDUCES PROLIFERATION IN CANCER CELL LINES ANALOGOUS TO DICHLOROACETATE ..................................................58 2.1 ABSTRACT .....................................................................................................59 2.2 INTRODUCTION ...........................................................................................60 2.3 MATERIALS AND METHODS .....................................................................62 2.4 RESULTS ........................................................................................................67 2.5 DISCUSSION ..................................................................................................76
3
HYPOXIA INDUCED UP-REGULATION AND FUNCTION OF THE THIAMINE ACTIVATING ENZYME THIMIANE PYROPHOSPHOKINASE 1 IN MDA-MB231 BREAST CANCER CELLS .................................................................................81
vii
3.1 ABSTRACT .....................................................................................................82 3.2 INTRODUCTION ...........................................................................................82 3.3 MATERIALS AND METHODS .....................................................................85 3.4 RESULTS ........................................................................................................90 3.5 DISCUSSION ..................................................................................................98 4
SUPPLEMENTAL DATA ........................................................................................101 4.1 HIGH-DOSE THIAMINE SUPPLEMENTATION AND ANALOGS ........101 4.2 TARGETING HOMEOSTATIC REGULATION OF THIAMINE .............114
5
SUMMARY AND FUTURE DIRECTIONS ............................................................120 5.1 SUMMARY ...................................................................................................120 5.2 EXPERIMENTAL LIMITATIONS ..............................................................124 5.3 FUTURE DIRECTIONS ...............................................................................126
REFERENCES ............................................................................................................................129 APPENDICES A UP-REGULATION OF VITAMIN B1 HOMEOSTASIS GENES IN BREAST CANCER ...................................................................................................168
viii
LIST OF TABLES Page Table 1.1: Vitamins and their cofactor forms ................................................................................16
ix
LIST OF FIGURES Page Figure 1.1: Diffusional gradient established during solid tumor formation ..................................11 Figure 1.2: Thiamine and Thiamine Phosphate Derivatives ..........................................................25 Figure 1.3: SLC19A Family ..........................................................................................................28 Figure 1.4: Thiamine Homeostasis ................................................................................................35 Figure 1.5: The role of TPP as an enzyme cofactor .......................................................................37 Figure 1.6: Pentose Phosphate Pathway ........................................................................................39 Figure 1.7: Structure of the tetrahedral subunits of the PDC E1 complex ....................................44 Figure 1.8: Regulation of the E1 alpha component of the pyruvate dehydrogenase complex ......47 Figure 1.9: Malignant Metabolic Alterations.................................................................................50 Figure 2.1: Cell proliferation of SK-N-BE and Panc-1 cells .........................................................70 Figure 2.2: Representative Western blots of PDH phosphorylation at Ser-293 ............................71 Figure 2.3: Glucose consumption in (A) SK-N-BE and (B) Panc-1 cells .....................................72 Figure 2.4: Changes in the mitochondrial membrane potential of SK-N-BE and Panc-1 cells after thiamine and DCA treatment .............................................................................................73 Figure 2.5: Production of H2O2 in SK-N-BE and Panc-1 cells......................................................74 Figure 2.6: Activation of capase-3 in SK-N-BE and Panc-1 cells .................................................75 Figure 3.1: Representative Western blot of TPK1 expression in MDA-MB-231 cells .................93 Figure 3.2 HPLC of Normoxic and Hypoxic MDA-MB-231 cells ..............................................94
x
Figure 3.3: MDA-MB-231 cells transfected with TPK1 variant 1 or vector control: Representative Western blot and HPLC ............................................................................95 Figure 3.4: Representative Western blot of THTR1 and THTR2 in MDA-MB-231 cells ............96 Figure 3.5: Transcriptional and Translational Regulation of TPK1 ..............................................97 Figure 4.1: Cell proliferation of MDA-MB-231, Pc-3, and SKOV-3 cells .................................107 Figure 4.2: Cell proliferation of Panc-1 cells treated with Mannitol ...........................................108 Figure 4.3: Cell proliferation of Panc-1 cells...............................................................................109 Figure 4.4: Cell proliferation of Panc-1 cells treated with Benfotiamine and Sulbutiamine .......110 Figure 4.5: Cell proliferation of Panc-1 cells following 48 h of treatment..................................111 Figure 4.6: DAPI staining of Panc-1 cells ...................................................................................112 Figure 4.7: Representative Western blot of TPK1 expression in BT-474 cells ...........................116 Figure 4.8: Panc-1 cells transfected with TPK1 variant 1 ...........................................................117 Figure 4.9: Cell proliferation of Panc-1 cells transfected with TPK1 variant 1 ..........................118
xi
ABBREVIATIONS
α-KG: α-Ketoglutarate α-KGDH: α-Ketoglutarate Dehydrogenase AKT: Serine-threonine-specific protein kinase AThTP: Adenosine Thiamine Triphosphate ATP: Adenosine triphosphate DCA: Dichloroacetate DHF: Dihydrofolate DHFR: Dihydrofolate Reductase ECM: Extra-cellular Matrix ER: Estrogen receptor F-6-P: Fructose-6-phosphate FAD: Flavin Adenine Dinucleotide FMN: Flavin Mononucleotide FR: Folate Receptor G-3-P: Glyceraldehyde-3-phosphate G-6-P: Glucose-6-phosphate GLUT: Glucose Trasporter GTPase: Guanosine triphosphatase HF: High fat HIF: Hypoxia inducible factor
xii
HK2: Hexokinase 2 HMECs: Primary human mammilary epithelial cells HT: High thiamine LDHA: Lactate Dehydrogenase A LT: Low thiamine M2-PK: M2 isoform of Pyruvate Kinase MAPK: Mitogen-Activated Protein Kinases MCT: Proton-coupled Monocarboxylate Transporters mtDNA: mitochondrial DNA mTOR: Mechanistic Target of Rapamycin MTX: Methotrexate NAD: Nicotinamide adenine dinucleotide NADH: Nicotinamide adenine dinucleotide (reduced) NADP: Nicotinamide Adenine Dinucleotide Phosphate NF: Normal fat NT: Normal thimaine OAA: Oxaloacetate OXPHOS: Oxidative Phosphorylation PAGE: Polyacrylamide gel electrophoresis PDC: Pyruvate Dehydrogenase Complex PDH: Pyruvate Dehydrogenase PDK: Pyruvate Dehydrogenase Kinase PDP: Pyruvate Dehydrogenase Phosphatases
xiii
PI3K: Phosphatidylinositol-4,5-bisphosphate 3-kinase PK: Pyruvate Kinase PPP: Pentose Phosphate Pathway qRT-PCR: Reverse transcriptase polymerase chain reaction R-5-P: Ribose-5-phosphate Ras: Rat sarcoma RDA: Recommended Daily Allowance RDI: Recommended Daily Intake RFC1: Reduced Folate Carrier 1 ROS: Reactive Oxygen Species SD: Standard deviation SLC: Solute Carrier SMVT: Sodium dependent Multivitamin Transporter Src: Proto-oncogene tyrosine-protein kinase TBS-T: Tris buffered saline-tween 20 TCA: Tricarboxylic Acid Cycle TDP: Thiamine Diphosphate THF: Tetrahydrofolate TKT: Transketolase TKTL: Transketolase-like protein TMP: Thiamine Monophosphate TMPase: Thiamine Monophosphatase TPK1: Thiamine Pyrophosphokinase 1
xiv
TPP: Thiamine Pyrophosphate TPPase: Thiamine Pyrophosphatase TRMA: Thiamine-responsive Megaloblastic Anemia TTP: Thiamine Triphosphate VEGF: Vascular endothelial growth factor
xv
CHAPTER 1 INTRODUCTION AND LITERATURE REVIEW
1.1. MALIGNANT ALTERATIONS Malignancy is defined by atypical cellular growth that results in the invasion of surrounding tissues (Bertram 2000).
These diseases are characterized by alterations in growth signals,
limitless replication, altered metabolism, sustained angiogenesis, and activation of metastasis (Hanahan and Weinberg 2000, Cantor and Sabatini 2012, Hainaut and Plymoth 2013). The change from a normal cell to malignant cell involves multiple cellular alterations in what is now termed malignant progression (Hanahan and Weinberg 2011, Hainaut and Plymoth 2013). This progression is initially asymptomatic but eventually results in a myriad of effects both locally and systemically (Holland-Frei 2003). Although it is difficult to establish that any single event results in the formation of a malignant cell, it is commonly accepted that a number of effectors induce this transformation (Tolar and Neglia 2003). It is currently thought that 90-95% of malignancies are the result of environmental factors while 5-10% are a result of genetic factors (Anand, Kunnumakkara et al. 2008). Whatever the cause of its initiation, malignant progression is characterized not by the cause of transformation but by the changes that are induced to support newly immortalized cells.
There are three key requirements for rapidly dividing cells;
maintenance of energy through ATP generation, biosynthesis of macromolecules, and maintenance of redox status (Bertram 2000, Cairns, Harris et al. 2011). Each of these are supported by alterations in the expression of tumor suppressor genes, oncogenes, and through the
1
transcriptional regulation of genes that augment cell growth and survival (Cairns, Harris et al. 2011).
1.1.1. Glycolysis Within normal cells the constant supply of energy is produced through an organized series of catabolic reactions that are necessary to maintain cellular function. ATP is the most common form of chemical energy and is generated as a product of three main metabolic pathways; glycolysis, the tricarboxylic acid cycle (TCA), and oxidative phosphorylation (OXPHOS) (Michael and Schomburg 2013). Within all cells, byproducts of these glycolytic reactions can also be shuttled into pathways that serve specific roles in maintaining cellular function. However, rapid proliferation requires metabolic reprogramming to meet the bioenergetic and biomass requirements of rapidly proliferating cells. The metabolic changes that occur within malignant cells were first identified over 80 years ago by Otto Warburg, who observed that ascites tumor cells consume glucose at a much higher rate when compared to normal cells (Warburg 1923). Warburg noted that malignant cells secrete most of the carbons obtained from glycolytic reactions as lactate instead of utilizing these carbons within oxidative metabolic reactions (Warburg 1923). Although rapid metabolism of glucose seems counterproductive, given the high-energy yield through OXPHOS, cancer cells preferentially utilize this pathway to support both bioenergetics and biosynthesis of macromolecules. These series of observations, now termed the Warburg effect, were the first to indicate that cancer cells primarily utilize glycolysis for energy production. Although Warburg believed that this phenomenon was a result of impaired or defective oxidative metabolism in
2
cancer cells, research has shown that many cancer types have fully functioning mitochondria (Moreno-Sanchez, Rodriguez-Enriquez et al. 2007). Glycolysis utilizes the most abundant extracellular nutrient, glucose, for the production of energy. The rate of ATP produced through glycolysis alone exceeds that of OXPHOS if the flux of carbons into glycolysis is high enough (Guppy, Greiner et al. 1993). In cancer cells, the rate of glucose metabolism exceeds that of oxidative phosphorylation and therefore allows for rapid generation of ATP using this pathway exclusively (Pfeiffer, Schuster et al. 2001). However, a key regulatory and rate-limiting step in glycolysis is the ATP-independent transport of glucose across the cell membrane (Medina and Owen 2002, Macheda, Rogers et al. 2005).
The
facilitative uptake of glucose takes place through members of the Solute carrier 2A (SLC2A) family of genes also known as glucose transporters (GLUTs). Smith et al. reviewed 30 studies that examined changes in SLC2A expression across a variety of cancers and found that GLUT1 (SLC2A1) is the most frequently over-expressed glucose transporter in malignant cells. GLUT1 overexpression is observed in a number of malignancies including colorectal, laryngeal, thyroid, prostate, pancreatic, and lung cancers (Sakashita, Aoyama et al. 2001, Luo, Zhou et al. 2010, Basturk, Singh et al. 2011, Jun, Jang et al. 2011, Grabellus, Nagarajah et al. 2012, Reinicke, Sotomayor et al. 2012). In addition to these alterations, the level of GLUT1 is indicative of proliferative index and may be beneficial as a prognostic factor in lung cancer (Smith 1999). Although GLUT 1 is the most widely studied, an increase in the expression of GLUT3 is also observed in many cancers including small intestine, kidney, and breast (Medina and Owen 2002).
The increase in the expression of glucose
transporters supports a shift in metabolism and plays an important role in the adaptive response to physiological stress. Alterations in the expression and function of glucose transporters are
3
driven by the activation of oncogenes such as c-myc, ras, and src (Rodriguez-Enriquez, MarinHernandez et al. 2009). Overexpression of GLUTs is also driven by transcription factors such as Hif1α (Marin-Hernandez, Rodriguez-Enriquez et al. 2006). Multiple groups have shown a hypoxia related increase in the mRNA expression of GLUT1 and GLUT3 in many malignant cells including thyroid lesions and hepatocellular carcinomas (Gleadle and Ratcliffe 1997, Chen, Pore et al. 2001, Jozwiak, Krzeslak et al. 2012). Rapid glycolysis is also supported by alterations in the expression and function of glycolytic enzymes. Once glucose is transported into the cell it is phosphorylated to glucose-6-phosphate (G-6-P) by the enzyme Hexokinase-2 (HK2). An increase in HK2 activity supports malignant metabolism and is required for the initiation of tumors in many murine cancer models (Mathupala, Ko et al. 2006, Patra, Wang et al. 2013). Mathupala et al. also found a hypoxia induced increase in the expression and function of HK2 (Mathupala, Rempel et al. 2001). Alterations in the expression and function of other glycolytic enzymes are also observed during malignant progression. An increase in the expression of aldolase, an enzyme which catalyzes the conversion of fructose-1,6-bisphosphate to glyceraldehyde-3-phosphate and dihydroxyacetone phosphate, is implicated in supporting malignant progression through an increase in glycolytic metabolism (Pelicano, Martin et al. 2006). Overexpression of this enzyme is observed in lung squamous cell, pancreatic, and prostate carcinomas (Zhong, Chiles et al. 2000, Akakura, Kobayashi et al. 2001, Li, Xiao et al. 2006). Although alterations in the expression and function of glycolytic enzymes support cellular bioenergetics, an increase in the production of glycolytic intermediates is necessary to support biomass generation. Influx of carbons into additional metabolic pathways, such as the pentose phosphate pathway (PPP), glycogen metabolism, serine biosynthesis, and triglyceride synthesis, is highly dependent
4
upon a buildup of glycolytic intermediates (DeBerardinis, Lum et al. 2008). Diverting the flow of glucose carbons away from glycolysis and into different pathways requires a truncation in glycolytic metabolism to increase the intracellular supply of glycolytic intermediates. This buildup can be achieved through the truncation of metabolism at key regulatory points within glycolysis. The M2 isoform of pyruvate kinase (M2-PK) is one example of a regulator of glycolysis within cancer cells. M2-PK, the dominant isoform in rapidly proliferating cells, oscillates between an active tetramer and an inactive dimer depending of the cells metabolic needs (Christofk, Vander Heiden et al. 2008, Mazurek 2011).
Dimeric M2-PK is highly
expressed in cancer cells and has been suggested as a malignant biomarker. PK catalyzes the transfer of a phosphate group from phosphoenolpyruvate to ADP resulting in the formation of pyruvate and ATP. A reduction in PK activity within cancer cells results in a buildup of phosphometabolites such as fructose-6-phosphate (F-6-P) and glyceraldehyde-3-phosphate (G-3P). These intermediates can be shuttled in to the PPP and converted to ribose-5-phosphate (R-5P) by transketolase (TKT). Imatinib resistance in chronic myeloid leukemia cells is associated with an increase in glucose carbon flux into RNA through the non-oxidative portion of the PPP due to an increase in M2-PK expression (Serkova and Boros 2005, Zhao, Mancuso et al. 2010).
1.1.2. Oncogenes Oncogenes arise from mutations in normal cellular genes, called proto-oncogenes, that lead to the formation of tumors through the dysregulation of cell division (Pierce 2005). These genetic mutations result in the constitutive activation or suppression of genes whose expression is normally regulated. Although cellular defects in DNA replication normally result in a cell death response, oncogenic activation supports survival and proliferation under these conditions
5
(Croce 2008). In addition to serving specific roles in regulating tumor initiation, oncogenes affect a number of different pathways that support malignant progression.
These effected
pathways include those through which oncogenes support the transition to a malignant glycolytic phenotype through the activation of genes involved in glucose uptake and metabolism (Edinger and Thompson 2002, Wieman, Wofford et al. 2007). Several oncogenes, such as regulatory GTPases, support rapid proliferation. These genes are molecular switches that, when turned on, produce proliferation-stimulating signals. There are three Ras genes (HRAS, KRAS, and NRAS) that represent some of the most common oncogenes found in human cancers. Permanently activated Ras is found in approximately 20% of all tumors and in as much as 90% of pancreatic cancers (Downward 2003). Ras oncogenes mediate the activation of multiple effector pathways including mitogen-activated protein kinases (MAPK) and
phosphatidylinositol-4,5-bisphosphate
3-kinase/serine-threonine-specific
protein
kinase/mechanistic target of rapamycin (PI3K/AKT/mTOR). Activation of this effector pathway results in an increase in metabolism through alterations in the expression and function of glucose transporters, glycolytic enzymes, fatty acid synthase, and ATP citrate lyase (Barthel, Okino et al. 1999, Yang, Han et al. 2002, Alberola-Ila and Hernandez-Hoyos 2003, Rathmell, Fox et al. 2003, Robey and Hay 2006, Ramjaun and Downward 2007, Ahmad, Patel et al. 2011). Transfection of ras or src into rodent cells increases the mRNA and protein expression of glucose transporters (Flier, Mueckler et al. 1987). Ramanathan et al. also showed that cells transformed by hTERT, SV-40T/t, and H-ras exhibited an increase in glucose dependency during tumorigenesis (Ramanathan, Wang et al. 2005).
The PI3K/Akt pathway, which supports
malignant transformation, not only enhances glycolysis but also results in glucose dependence in leukemia and glioblastoma cells (Elstrom, Bauer et al. 2004).
6
Another group of oncogenes that support rapid cell proliferation and malignant metabolism are transcription factors, such as the MYC oncogene. Alterations in the expression of the MYC oncogene have been implicated in a number of cancers including ovarian, pancreatic, breast, gastric, colorectal, and uterine (Ross, Ali et al. 2013, Chen, McGee et al. 2014). MYC plays a key role in regulating transformation, cell cycle progression, and apoptosis (Dominguez-Sola, Ying et al. 2007). The collaboration of MYC and HIF result in the activation of glucose transporters, lactate dehydrogenase A (LDHA), and pyruvate dehydrogenase kinase 1 (PDK1) (Kim, Gao et al. 2007, Dang, Kim et al. 2008, Dang, Le et al. 2009). This oncogene also activates transcription of target genes that increase the metabolism of glutamine (Li, Wang et al. 2005).
1.1.3. Mitochondrial Dysfunction Although Otto Warburg suggested that cancer cells preferentially utilize glycolysis as a consequence of dysfunctional mitochondria, it is now known that cancer cells utilize glycolysis for energy and biomass production even in the presence of adequate amounts of oxygen. On average, the rate of glycolysis in malignant cells is often as much as five times higher than normal cells (Denko 2008). Although mitochondrial dysfunction does not completely explain Warburg’s hypothesis, an increase in mitochondrial respiration injury is hypothesized to be a factor in supporting an increase in malignant glycolysis (Chatterjee, Dasgupta et al. 2011). Studies have revealed that malignant cells have a high rate of mitochondrial DNA (mtDNA) mutations (Carew and Huang 2002, Taylor and Turnbull 2005, Pelicano, Xu et al. 2006, Singh, Sullivan et al. 2006). For example, high rates of mtDNA mutation have been observed in breast cancer, gastric cancer, prostate cancer, and leukemia (Carew, Zhou et al. 2003, Chen and
7
Kadlubar 2004, Zhao, Yang et al. 2005, Zhu, Qin et al. 2005). Factors affecting these mutations include the close proximity of mtDNA to reactive oxygen generation sites within the mitochondria, weak DNA repair capacity, and decreased histone protection. Since oxidative phosphorylation is one of two primary ATP generating pathways, malfunctioning mitochondria would result in an increased reliance on glycolysis (Pelicano, Xu et al. 2006).
Genomic
mutations in subunit 1 of cytochrome oxidase or NADH dehydrogenase provide tumorpromoting effects due to an increase in the levels of both cytosolic and mitochondrial reactive oxygen species (ROS) (Petros, Baumann et al. 2005, Ishikawa, Takenaga et al. 2008, Ralph, Rodriguez-Enriquez et al. 2010). Additional evidence suggests that electron transport chain activity, specifically through complex I, maintains a high level of NAD+/NADH and limits breast cancer growth and metastasis (Santidrian, Matsuno-Yagi et al. 2013). Malignant alterations in the expression and function of phosphoglycerate dehydrogenase, phosphoglycerate mutase 1, and pyruvate kinase M2 function to divert glucose carbons away from the mitochondria (Vander Heiden, Cantley et al. 2009).
The buildup of glycolytic intermediates increases carbon flux to alternative
biosynthetic pathways such the PPP and serine biosynthesis pathways (Locasale, Grassian et al. 2011, Possemato, Marks et al. 2011, Hitosugi, Zhou et al. 2012). Contrary to the conventional belief that all malignant cells have dysfunctional mitochondria, it has been suggested that many tumor cells adaptively regulate mitochondrial metabolism to provide a proliferative advantage (Koppenol, Bounds et al. 2011, Cantor and Sabatini 2012). Mitochondrial play a central role in regulating cell differentiation, apoptosis, necrosis, and oncosuppression (Scatena 2012). Therefore, alterations in the cellular utilization and activity of mitochondria support malignant progression. Mitochondrial mutations, although common in
8
malignancy, do not inactivate mitochondrial metabolism, but rather result in a shift in the bioenergetics and biosynthetic state (Wallace 2012). However, many malignant cell types also continue to utilize mitochondrial OXPHOS to produce ATP (Weinhouse 1976, Gottlieb and Tomlinson 2005).
Differences in mitochondrial function illustrate metabolic heterogeneity
within malignant cells.
1.1.4. Cellular Heterogeneity Cellular heterogeneity is observed in all cell systems and contributes to a cells ability to respond to changing extracellular conditions (Altschuler and Wu 2010).
Tumor heterogeneity
refers to the observation that tumor cells exhibit different and distinct phenotypic and morphological variations. These variations include differences in gene expression, metabolism, morphology, proliferation, and metastatic potential (Marusyk and Polyak 2010). Within a solid tumor, cellular heterogeneity results in differences between malignant cells that originated within the same tumor. Tumor heterogeneity occurs both within and between tumors from the same tissue of origin and results in treatment resistance (Marusyk and Polyak 2010). Although glycolytic metabolism is a characteristic feature of malignant cells, the heterogeneities of an individual cell dictate how metabolic reprogramming is accomplished. For this reason, a single metabolic alteration cannot globally define malignancy (Cantor and Sabatini 2012). Using single cell–derived clones from human primary colorectal tumors, Kreso et al observed that malignant cells display both genetic homogeneity and biological diversity (Kreso, O'Brien et al. 2013). Tumor heterogeneity has been observed in breast, colon, prostate, bladder, brain, head and neck, esophageal, and gynecological cancers (Konishi, Hiasa et al. 1995, Sauter, Moch et al. 1995, Califano, van der Riet et al. 1996, Macintosh, Stower et al. 1998, Samowitz
9
and Slattery 1999, Fujii, Yoshida et al. 2000, Maley, Galipeau et al. 2006, Shipitsin, Campbell et al. 2007, Campbell, Pleasance et al. 2008).
For example, the cell specific expression of
glutamine synthase, the enzyme responsible for catalyzing the conversion of glutamate to glutamine, differs between breast tumor subtypes (Kung, Marks et al. 2011). Although glucose and glutamine are the preferred carbon source by a number of malignant cells, leukemia and lung cancer cells utilize fatty acid oxidation as a means of obtaining energy (Wieman, Wofford et al. 2007, Zaugg, Yao et al. 2011).
These observations illustrate variability in metabolic
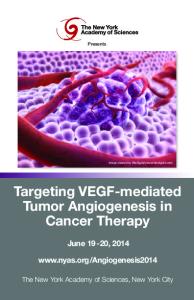
heterogeneity not only within the same tumor type but also across different tumor tissues. In addition to genetic and epigenetic alterations that contribute to tumor heterogeneity, microenvironment also leads to alterations in tumor characteristics. Tumor microenvironment is simply defined as the environment in which tumor cells proliferate and includes the extracellular matrix, blood vessels, and signaling molecules (Weber and Kuo 2012). As illustrated in figure 1.1, malignant cells proliferate at a rate faster than that at which oxygen and nutrients can be supplied. Therefore, cellular adaptations are necessary to overcome physiological stress that occurs as a result of rapid cell proliferation.
Within solid tumors, an incomplete vascular
network results in the formation of hypoxic microenvironments requiring cells to undergo adaptations in order to scavenge available nutrients and utilize these nutrients in the most effective way possible.
10
Figure 1.1 Diffusional gradient established during solid tumor formation. Within a solid tumor, malignant cells proliferate at a rate faster than that of which vasculature can be produced. As a result, limitations in the diffusion of oxygen and nutrients are observed in cells furthest away from blood vessels. An additional limitation and effect of malignant progression is the decrease in the penetration of chemotherapeutic drugs. Figure adapted from Threshold Pharmaceuticals.
11
Tumor hypoxia results in the stabilization of the transcription factor HIF1-α. HIF1 is a transcription factor complex that is responsible for gene expression changes under low oxygen conditions. The heterodimeric complex of the constitutively expressed HIF1β (aryl hydrocarbon receptor nuclear translocator) and HIF1α is stabilized following hypoxic exposure (Bertout, Patel et al. 2008, Cairns, Harris et al. 2011). Nuclear translocation of this complex results in the induction of genes involved in angiogenesis, glycolysis, lactate production, and mitochondrial activity (Firth, Ebert et al. 1995, Gleadle and Ratcliffe 1997, Chen, Pore et al. 2001, Blagosklonny 2004, Mathupala, Ko et al. 2006). Hypoxia-induced alterations in the extracellular environment also promote degradation of the extra-cellular matrix (ECM) and induce cell migration (van Sluis, Bhujwalla et al. 1999, Estrella, Chen et al. 2013). Tumor hypoxia also results in genetic instability through the down-regulating nuclear mismatch repair and nucleotide excision repair pathways (Bindra and Glazer 2005, Fuss and Cooper 2006, Iyer, Pluciennik et al. 2006, Li 2008).
Stabilization of HIF1-α is also implicated in poor patient prognosis and
increased metastatic potential (Blagosklonny 2004). Hypoxia has also been associated with both reduced radio-sensitivity and increased chemotherapeutic resistance. Overcoming therapeutic resistance presents a significant issue in the treatment of many cancers and therefore the inhibition of glycolysis presents a therapeutic alternative.
Recent studies have shown that
malignant cells have an increased sensitivity to oxamate, 2-deoxyglucose, and 3-bromopyruvate under hypoxic conditions (Liu, Savaraj et al. 2002, Maher, Krishan et al. 2004, Xu, Tong et al. 2005).
12
1.1.5. Autophagy Cellular autophagy is necessary to support both metabolism and survival. Autophagy is defined as the process through which cellular proteins and organelles are broken-down by autophagosomes, digested by lysosomes, and then recycled to support cell survival and proliferation. In malignant cells, autophagy suppresses an intracellular accumulation of damaged proteins and promotes tumor growth. Self-cannibalism is a response to metabolic stress cues that results in the recycling of proteins and organelles to meet the metabolic demands associated with rapid proliferation (Mathew and White 2011, Yang, Chee et al. 2011). Autophagic degradation is a survival response in conditions where cells are growth-factor deprived or unable to uptake extracellular nutrients (DeBerardinis, Lum et al. 2008). Mutated Ras results in an increase in cancer cell autophagy. Mutated H-rasV12 or KrasV12 genes, introduced into immortal, non-tumorigenic baby mouse kidney epithelial (iBMK) cells, resulted in a 10-fold increase in autophagy when compared to control cells (Guo, Chen et al. 2011). In pancreatic cancer cells, Ras-driven autophagy functions to limit cells death under low nutrient stress conditions (Yang, Wang et al. 2011). In Ras-driven cells, autophagy supports oxidative metabolism through the maintenance of healthy mitochondria and maintenance of mitochondrial substrates through macromolecular degradation (Guo, Chen et al. 2011, Mathew and White 2011, Yang, Wang et al. 2011, Youle and Narendra 2011). An increase in malignant autophagy is also observed within hypoxic tumor microenvironments (Mazure and Pouyssegur 2010).
13
1.1.6. Metastasis Metastasis is the process through which cancer spreads throughout the body. Metastatic tumors arise from a primary tumor and occur in almost all cancer types. A majority of cancer related deaths are a result of cancer spread from its tissue of origin throughout the body (Chaffer and Weinberg 2011).
Malignant metastasis involves local invasion of surrounding tissues,
intravasion into the blood of lymph nodes, extravasion into new tissue, proliferation within the tissue, and angiogenesis to support further survival and proliferation.
Both the ability to
metastasize and the site of metastasis are highly dependent on the cancer type. Malignant metastases are often found in the liver, lungs, bones, and brain (Bubendorf, Schopfer et al. 2000, Hess, Varadhachary et al. 2006, Aragon-Ching and Zujewski 2007, Coghlin and Murray 2010, Berman, Thukral et al. 2013). Metastasis occurs as a result of tumor cells breaking away from the primary tumor and breaking down proteins that surround the extracellular matrix (Nguyen and Massague 2007). Within malignant cells, alterations in cellular metabolism support the metastatic cascade of events. By diverting pyruvate away from the mitochondria and reducing it to lactate, malignant cells export a waste product that acidifies the ECM (Stasinopoulos, Mori et al. 2008). LDHA alleviates an intracellular buildup of pyruvate by converting it to lactate. Elevated LDHA levels are a hallmark of may tumors including squamous cell head and neck, colorectal, and non-smallcell lung cancers (Dawson, Goodfriend et al. 1964, Koukourakis, Giatromanolaki et al. 2003, Koukourakis, Giatromanolaki et al. 2005, Koukourakis, Giatromanolaki et al. 2009). LDHA is also a transcriptional target of Hif1α (Semenza, Roth et al. 1994, Firth, Ebert et al. 1995, Denko 2008). Hypoxia induced loss of p53 promotes an increase in the expression and function of proton-coupled monocarboxylate transporters (MCTs), which catalyze the transport of lactate
14
and pyruvate across the plasma membrane. An increase in the expression and function of MCT1 is observed in cervical, breast, and colon cancer cells (Boidot, Vegran et al. 2012). An increase in the expression of MCT4 is also observed in colorectal, breast, and pancreatic cancers (Ullah, Davies et al. 2006, Queiros, Preto et al. 2012, Gotanda, Akagi et al. 2013). The efflux of lactate results in an inflammatory response that attracts macrophages which then secrete cytokines and growth factors which support the growth of tumor cells and their metastasis (Shime, Yabu et al. 2008, Yabu, Shime et al. 2011).
1.2. THE ROLE OF COFACTORS IN CELLULAR METABOLISM Vitamins play an essential role in mammalian cellular metabolism by serving as enzyme cofactors. An enzyme cofactor is defined as a non-protein component necessary for enzymatic activity. Vitamins such as niacin, folic acid, pantothenic acid, biotin, riboflavin and thiamine represent some of the most common enzyme cofactors (Table 1.1).
These water-soluble
vitamins serve a variety of metabolic functions including methyltransferase reactions (vitamin B12), fatty acid biosynthesis (biotin), and as precursor molecules utilized as activated electron carriers (riboflavin used in the generation of FAD and niacin for NAD) (Decker and Byerrum 1954, Wakil and Gibson 1960, Nishizuka and Hayaishi 1963, Weissbach and Taylor 1970). In addition to their role in cell metabolism, some vitamins are involved in regulating gene expression (Oommen, Griffin et al. 2005).
15
Table 1.1 Vitamins and their cofactor forms. All vitamins listed here are water-soluble vitamins that support metabolic function. Additionally, all require a transport system that is adaptively regulated during tumorigenesis.
16
1.2.1. Folate (Vitamin B9) Folate is an essential vitamin that is involved in DNA synthesis, repair, and methylation. Transport of folate and folic acid derivatives occurs through folate receptors (FR), organic anion transporters, a proton-coupled folate transporter, and the reduced folate carrier (RFC1) (Matherly and Goldman 2003). Following transport, folate is first converted to dihydrofolate (DHF) by the enzyme dihydrofolate reductase (DHFR).
The biologically active derivative of folate is
produced following the reduction of DHF, by DHFR, to tetrahydrofolate (THF) (Bailey and Ayling 2009). THF is involved in the metabolism of both amino acids and nucleic acids. This cofactor is important in the synthesis of nucleotides precursors such as serine and methionine through the transfer of enzymatically attached one-carbon units. Additionally, methylene groups attached to THF are used in the conversion of uracil-like pyrimidine bases to thymine, found in DNA. 5-methyltetrahydrofolate, another folate cofactor, is involved in the re-methylation of homocysteine during the methionine methylation cycle. Methionine can then be converted to Sadenosylmethionine, which acts as a methyl donor in many different cellular methyltransferase reactions.
Low concentrations of folate can impair metabolic pathways and result in an
accumulation of homocysteine, a reduction in methyl groups necessary for DNA methylation, and a decrease in precursors that are involved in DNA synthesis repair (Scott 1999, Weinstein, Hartman et al. 2003, Figueiredo, Grau et al. 2009). As a result of its role in both metabolism and proliferation, the intercellular homeostasis has been widely studied. In 1945 Leuchtenberger et al. discovered that folic acid administration resulted in the regression of spontaneous breast cancer tumors in mice (Leuchtenberger, Leuchtenberger et al. 1945).
This observation inspired Dr. Sidney Farber, who was working on treating acute
leukemia in children, to utilize folic acid administration as a treatment strategy. However, Dr.
17
Farber discovered that administration of folic acid mimetics resulted in an acceleration of this disease. This observation suggested the potential of arresting the growth of leukemia cells if they were deprived of folic acid.
In 1947, Dr. Farber administered aminopterin, a folic acid
antagonist, to an ill child and observed a dramatic regression of this disease (Farber and Diamond 1948). Dr. Farber concluded that altering the maintenance of folate homeostasis, in malignant cells, represented a potential chemotherapeutic strategy. An inverse relationship has been observed between folate intake and risk of developing pancreatic, lungs, esophageal, stomach, cervical, ovarian, breast, and colorectal cancers (Kim 1999). In these studies patients with a high level of folate intake showed a decrease in cancer incidence compared to patients with lower levels of circulating folate (Kim 1999, Choi and Mason 2000, Lucock 2000). Qin et al. also found that folate supplementation results in a significantly reduced risk in developing melanoma (Qin, Cui et al. 2013). Differential responses following folic acid supplementation suggest phenotypic differences in the utilization and uptake of this vitamin.
An increase in the expression of hFR and RFC1 has been observed in
nasopharyngeal epidermoid, leukemia, non-mucinous ovarian, lymphoma, cervical, uterine, metastatic endometrial, primary renal cell, and metastatic pancreatic carcinomas (Elwood, Nachmanoff et al. 1997, Kelley, Rowan et al. 2003, Pillai, Chacko et al. 2003, Elnakat and Ratnam 2004, Parker, Turk et al. 2005). Low expression is observed in primary endometrial, metastatic renal cell, lung, primary breast, primary bladder, primary pancreatic, colorectal, prostate brain, and liver carcinomas (Parker, Turk et al. 2005). Chemotherapeutics, such as methotrexate (MTX), pemetrexed, and raltitrexed, target the folate-activating enzyme DHFR (Goldman and Matherly 1985, Vos, Ros et al. 1999, Goldman and Zhao 2002). These compounds are transported into the cell by RFC1 and reduce cell
18
proliferation through their effects on nucleotide synthesis (Goldman and Matherly 1985, Goldman and Zhao 2002, Matherly and Goldman 2003, Jansen 19991). MTX has also been used in the treatment of lymphoma, osteogenic sarcoma, breast, and pediatric cancers (Monahan and Allegra 2001). Impaired folate transport, observed in some breast cancers, results in MTX resistance (Pinard, Jolivet et al. 1996).
1.2.2. Biotin (Vitamin B7) Biotin is a coenzyme involved in the synthesis of fatty acids, gluconeogenesis, the synthesis of amino acids, and in branched-chain amino acid catabolism. Biotin also provides a necessary cofactor for enzymes that are responsible for the transfer of carbon dioxide in several carboxylase enzymatic reactions (Fiume and Cosmetic Ingredient Review Expert 2001). Transport of biotin occurs through a carrier mediated, Na+ dependent process (Said 1999). Sodium dependent multivitamin transporter (SLC5A6 or SMVT) is a transmembrane protein involved in the transport of biotin, pantothenic acid and lipoic acid. SMVT is expressed in a variety of human tissues including intestine, brain, liver, lung, and kidney. Conditional knockout of SLC5A6 in mice results in impaired biotin absorption in the intestine.
Loss of gene
expression resulted in the absence intestinal SMVT and premature death between 6 and 10 weeks (Ghosal, Lambrecht et al. 2013). Increased biotin uptake through SMVT has been observed in a number of cancers including prostate and breast (Patel, Vadlapatla et al. 2012, Vadlapudi, Vadlapatla et al. 2013). Minko et al. also found an increase in biotin-receptor expression in human ovarian carcinoma cells (Minko, Paranjpe et al. 2002). As a result of the broad substrate specificity, SMVT is an excellent candidate to enhance drug uptake (Vadlapudi, Vadlapatla et al. 2012).
19
Alterations in the expression of biotin transporters can be exploited through targeted drug delivery such as biotin conjugation of chemotherapeutics (Marek, Kaiser et al. 1997, Cannizzaro, Padera et al. 1998, Mishra and Jain 2002, Na, Bum Lee et al. 2003, Russell-Jones, McTavish et al. 2004). In cells with high biotin transporter expression, conjugation of a chemotherapeutic results in increased efficacy.
Using a biotin-conjugated saquinavir, Luo et al. showed a
significant inhibition of [3H]-biotin in MDCK-MDR1 cells suggesting that this conjugate is recognized by SMVT (Luo, Kansara et al. 2006). Minko et al. hypothesized that a SMVT uptake of a biotin conjugated camptothecin–poly(ethylene glycol) increased the cellular permeability of camptothecin (Minko, Paranjpe et al. 2002). Interestingly, extracellular supply of biotin alters gene expression. Using an in vitro model of small cell lung cancer, NCI-H69, Scheerger et al. observed an increase in the expression of oncogenes N-myc, c-myb, N-ras, and raf in cells cultured in pharmacologic biotin concentrations. When cells were cultured at borderline deficient biotin concentrations (0.025 nmol/L), expression of these oncogenes decreased by up to 47% (Scheerger and Zempleni 2003).
1.2.3. Niacin (Vitamin B3) Vitamin B3, niacin or nicotinic acid, is a necessary vitamin that is involved in the metabolism of lipids. Niacin uptake is facilitated by multiple membrane bound transporters, which include OATP2B1, MCT1, and SLC22A13 (Broer, Schneider et al. 1998, Bahn, Hagos et al. 2008, Hagenbuch and Gui 2008). Once inside the cell, niacin binds to G protein coupled receptors, niacin receptor 1 and niacin receptor 2, and inhibits cyclic adenosine monophosphate production (Soga, Kamohara et al. 2003, Wise, Foord et al. 2003). This inhibition results in an increase in both adipose tissue and free fatty acids that can be used in the production of
20
triglycerides and very-low-density lipoproteins (Gille, Bodor et al. 2008, Wanders and Judd 2011). Within cells, niacin is converted to nicotinamide which is the precursor molecule for two cofactors; NAD+ (nicotinamide adenine dinucleotide) and NADP (nicotinamide adenine dinucleotide phosphate) (Jaconello 1992). These cofactors, which are involved in oxidationreduction (redox) and other non-redox reactions, can be phosphorylated (NADP) and reduced (NADH and NADPH). More than 400 enzymes require either NAD+ or NADP as electron acceptors or donors in redox reactions (Panberthy and Kirkland 2012). In cells, NAD+ is involved in catabolic, energy-producing, reactions such as the breakdown of proteins, carbohydrates, fats, and alcohol.
NADP is involved in anabolic reactions such as the
biosynthesis of fatty acids and cholesterol (Brody 1999, Cervantes-Laurean, McElvaney et al. 1999). Studies have also found that cellular maintenance of niacin homeostasis is essential in maintaining genomic stability. Poly ADP-ribosylations enzymes are NAD-dependent enzymes that facilitate DNA repair at strand breaks and are critical in the cellular response to DNA injury (Kirkland 2012). A loss of genomic stability results in a high rate of DNA damage and is now considered a hallmark of cancer (Negrini, Gorgoulis et al. 2010). Intracellular niacin and NAD deficiency leads to a decrease in the levels of tumor suppressor p53 in skin, breast, and lung cells (Jacobson, Shieh et al. 1999, Spronck, Nickerson et al. 2007). Interestingly, administration of nicotinamide increases the incidence of pancreatic islet-cell tumors after streptozotocin and heliotrine treatment. The development of kidney neoplasias was also promoted in rats that were pretreated with high doses of nicotinamide and then treated with diethylnitrosamine (Schoental 1977).
21
1.2.4. Riboflavin (Vitamin B2) Vitamin B2 (Riboflavin) is an essential component of flavin adenine dinucleotide (FAD) and flavin mononucleotide (FMN) cofactors. Riboflavin is transported by two membrane bound transporters, RFT1 and RFT2 (Yonezawa, Masuda et al. 2008, Yamamoto, Inoue et al. 2009). These cofactors are required for the enzymatic activity of flavoprotein enzymes such as those in the ETC, decarboxylation of pyruvate and ketoglutarate, and fatty acid oxidation. They are also necessary for the conversion of a number of vitamins to their active forms. Riboflavin regulates the synthesis of 5-methyl THF and the conversion of retinol to retinoic acid (Higdon 2014). Co-administration of riboflavin and folate increase circulating levels of 5-methyl THF (Powers, Hill et al. 2007). As a direct result, homocystine metabolism is affected by riboflavin concentration through its role in mediating methylenetetrahydrofolate reductase (Yin, Ming et al. 2012, Gao, Ding et al. 2013, Shujuan, Jianxing et al. 2013, Wen, Yang et al. 2013). Riboflavin’s implication in cellular metabolism and maintenance of vitamin homeostasis, alterations in the intracellular supply of riboflavin are implicated in malignant progression. In 1943, Morris and Robertson found that riboflavin deficiency slowed the growth and spread of spontaneous mammary cancers in mice (Morris and Robertson 1943). Additionally, high doses of riboflavin enhance proliferation, invasion, and migration of lung cancer cell (Yang, Chao et al. 2013). Riboflavin has been used in conjunction with niacin and coenzyme Q10 to prevent oxidative stress associated with tamoxifen treatment (Yuvaraj, Premkumar et al. 2008).
22
1.2.5. Thiamine (Vitamin B1) Thiamine, vitamin B1, is classified as a water-soluble vitamin and is essential for cellular metabolism within all living organisms. Thiamine’s structure is composed of a thiazole and pyrimidine ring joined together by a methylene bridge (See Figure 1.3). Both the presence of quaternary nitrogen and the overall hydrophilicity of this molecule result in the requirement for carrier-mediated transport to achieve both absorption and uptake.
1.2.5.1.
Sources
Although thiamine biosynthesis occurs in bacteria, plants, and fungi, humans lack the genes necessary to produce this necessary vitamin (Webb, Marquet et al. 2007). As a result of this inability, humans must obtain this vitamin through dietary sources. Thiamine is found naturally in foods such as fish, meats, eggs, bread, legumes, pasta, watermelon and milk. A number of food products are also fortified with thiamine during processing. For example, refined grains have less thiamine when compared to whole grains. As a result, thiamine is often added to processed grains such as flour. Thiamine is also added to many soups to produce a meaty flavor (Jr. 2008). The recommended daily intake (RDI) of thiamine varies by both age and gender. According to the National Institutes of Health (NIH) RDI of thiamine for men and women over the age of 18 is approximately 1 – 1.2 mg/day (Pitkin, Allen et al. 2000). A 2012 study administered thiamine to healthy patients at doses up to 1500 mg/day and found no adverse side effects (Smithline, Donnino et al. 2012). Additionally only nausea and indigestion have been observed in Alzheimer’s patients who were administered up to 7500 mg/day (Meador, Loring et
23
al. 1993). Currently many over-the-counter vitamin supplements supply thiamine at values between 80 and 6,000% of the RDI (Pitkin, Allen et al. 2000). Bacteria contain specialized genes that support the biosynthesis and utilization of thiamine. Within these organisms the thiazole and pyrimidine rings are synthesized independently and are combined by thiamine pyrophosphate synthase to form thiamine monophosphate (TMP). Microbiota in the gut also produce both thiamine and thiamine pyrophosphate (TPP) (Arumugam, Raes et al. 2011). Intracellular uptake of TPP, by mammalian cells, was previously though unlikely due to the size and charge of the molecule. Recently, however, Nabokina, et al. identified a TPP transporter present in human colon cells (Nabokina, Subramanian et al. 2013). This observation suggests that TPP, generated by microbiota, can be transported and utilized within human cells.
24
Figure 1.2. Thiamine and Thiamine Phosphate Derivatives. (A) Thiamine, (B) Thiamine Monophosphate, (C) Thiamine Diphosphate, and (D) Thiamine Triphosphate.
25
1.2.5.2.
Absorption and Uptake
Thiamine is a hydrophilic organic cation and therefore requires carrier-mediated transport in order to cross the cell membrane. Although exogenous supply of thiamine is essential for cellular homeostasis, the intestinal absorption of thiamine plays a critical role in the body’s maintenance of this essential vitamin. The facilitated transport of thiamine by members of the solute carrier family or transporters; THTR1 (SLC19A2) and THTR2 (SLC19A3), is necessary to sustain cellular homeostasis of this nutrient (Eudy, Spiegelstein et al. 2000, Fleming, Steinkamp et al. 2001).
Once inside the cell, transport of TPP across the mitochondrial
membrane occurs through SLC25A19 (Kang and Samuels 2008). Along with carrier-mediated transport of thiamine by SLC transporters, uptake by members of the cation family of transporters (OCT1) as well as passive diffusion at high concentrations has been observed (Hoyumpa 1980, Zielinska-Dawidziak, Grajek et al. 2008, Lemos, Faria et al. 2012, Nabokina, Subramanian et al. 2013).
1.2.5.2.1.
SLC19A Family
There are currently three solute carrier transporters grouped into the SLC19 family. SLC19A1 (RFC1) is a folate transporter while SLC19A2 (THTR1) and SLC19A3 (THTR2) are both thiamine transporters (See Figure 1.4). RFC1 and THTR1 have a 39% sequence homology, RFC1 and THTR2 have a 42% sequence homology, and THTR1 and THTR2 have a 53% sequence homology (Ganapathy, Smith et al. 2004). Although the members of this family display a high degree of sequence homology they have high substrate specificity. RFC1 has not been shown to transport thiamine and THTR1/2 have not been shown to transport folate (Rajgopal, Edmondnson et al. 2001, Subramanian, Marchant et al. 2003).
26
At physiological pH the substrates for RFC1 exist as anions while the substrates for THTR1/2 exist as cations.
Although each of the SLC19 family of transporters are pH
responsive, RFC1 has a higher transport capacity at low pH (5.5) while THTR1/2 have higher transport capacities (pH 8 and 7.5 respectively) (Dutta, Huang et al. 1999, Rajgopal, Edmondnson et al. 2001, Rajgopal, Sierra et al. 2001).
RFC1 transports folate through an
inwardly directed H+ gradient with a folate/H+ symport and folate/OH- antiport. In contrast, THTR1/2 transport thiamine by an outwardly directed H+ gradient using a thiamine/ H+ transport mechanism. Each of the transporters in the SLC19 family is ubiquitously expressed, but the expression levels are dependent upon the specific tissue type. The expression of the SLC19 family of transporters is generally high in absorptive tissue such as the intestine, placenta, and kidneys. Additionally, while all SLC19 transporters are found only on the plasma membrane, RFC1 has also been shown to localize on the mitochondrial membrane (Said, Ortiz et al. 1999, Marchant, Subramanian et al. 2002, Boulware, Subramanian et al. 2003, Subramanian, Marchant et al. 2003, Said, Balamurugan et al. 2004).
27
Figure 1.3. SLC19A Family. Percentages represent sequence homology between each of the transporters.
28
1.2.5.2.1.1.
SLC19A1
Reduced Folate Carrier 1 (RFC1) is a 12 transmembrane domain protein with one Nglycosylation site (Moscow, Gong et al. 1995, Prasad, Ramamoorthy et al. 1995, Williams and Flintoff 1995, Wong, Proefke et al. 1995). RFC1 is expressed ubiquitously in the human body on both the plasma and mitochondrial membranes where it facilitates the cellular uptake of folate and its derivatives. Genetic knockout of the RFC1 protein is lethal in mouse embryos (Zhao, Russell et al. 2001). SLC19A1 expression is regulated in response to folate status in which increased availability results in a decrease in transporter expression (Said, Chatterjee et al. 2000). The expression of wild-type p53 also reduces the expression of RFC1 (Ding, Whetstine et al. 2001). Interestingly, although SLC19A1 does not transport free thiamine it plays a role in maintaining thiamine homeostasis through its ability to transport phosphate esters of thiamine. As a result, RFC1 may also provide an alternative route for thiamine uptake in diseases such as thiamine-responsive megaloblastic anemia (TRMA) (Zhao, Gao et al. 2002). RFC1 has received a substantial amount of attention as a chemotherapeutic target due to its uptake activity, widespread tissue distribution, and altered expression in cancer tissues. Chemotherapeutics such as MTX, pemetrexed, raltitrexed, and pralatrexate are all transported by RFC1 (Matherly, Hou et al. 2007, Desmoulin, Hou et al. 2012).
1.2.5.2.1.2.
SLC19A2
SLC19A2 (THTR2) is a 497 amino acid protein that is ubiquitously expressed in human tissues.
This high capacity, low affinity thiamine transporter (Km = 2.5μM) has 12
transmembrane domains with two N-glycosylation cites, which are not essential for transport function (Diaz, Banikazemi et al. 1999, Dutta, Huang et al. 1999, Fleming, Tartaglini et al. 1999,
29
Balamurugan and Said 2002). Within the cell, THTR1 is localized to the plasma membrane and relies on intact microtubules for trafficking to the cell membrane (Fleming, Steinkamp et al. 2001). This protein is present on both the apical and basolateral surfaces of epithelial cells (Subramanian, Marchant et al. 2003). Alterations in the expression of THTR1 are implicated in a number of disease states. Mutations in SLC19A2 result in TRMA, which is characterized by megaloblastic anemia, diabetes, and hearing loss.
Symptoms of TRMA are treatable following thiamine
supplementation (Raz, Labay et al. 2000, Neufeld, Fleming et al. 2001). In 2003 Moscow et al. demonstrated that the RNA levels of SLC19A2 remain relatively unchanged when comparing normal breast tissue to breast cancer tissue (Liu, Huang et al. 2003). Recently, Zastre et al. showed an increase in the expression of SLC19A2 in human breast tissue samples when compared to normal breast tissues. This marked the first time that an increase in expression of this gene has been observed in cancer (Zastre, Hanberry et al. 2013). The conflicting data concerning SLC19A2 expression suggests that more work is necessary to understand alterations of this transporter during malignant progression.
1.2.5.2.1.3.
SLC19A3
SLC19A3 (THTR2) is a 496 amino acid protein that is ubiquitously expressed in tissues throughout the human body. THTR2 is a high affinity, low capacity thiamine transporter (Km = 27nM) with 12 transmembrane domains and 2 N-glycosylation sites.
THTR2 is localized
primarily on the plasma membrane and is restricted to the luminal apical side of polarized epithelial cells (Boulware, Subramanian et al. 2003, Said, Balamurugan et al. 2004, Ashokkumar, Vaziri et al. 2006). Mutations in THTR2 result in biotin-responsive basal ganglia
30
disease for which the administration of thiamine is ineffective (Tabarki, Al-Shafi et al. 2013). Extensive evaluation has been conducted to elucidate the regulation and alteration of SLC19A3 expression in malignant cells. Liu et al. demonstrated an approximately 14% reduction in the mRNA level of SLC19A3 when comparing normal breast tissue to breast cancer tissue (Liu, Huang et al. 2003). This study examined clinical samples of breast tissue and therefore represents a wide range of breast cancer subtypes. Zastre et al. confirmed the findings of this report in demonstrating a decrease in SLC19A3 using similar techniques (Zastre, Hanberry et al. 2013). Similarly, a down regulation has been observed in both colon and gastric cancers (Liu, Lam et al. 2009, Ikehata, Ueda et al. 2012). In 2010 Sweet et al. used a breast cancer cell line to show that the expression of SLC19A3 increases following chronic hypoxic exposure (Sweet, Paul et al. 2010). This study was the first to examine a microenvironment specific alteration in thiamine transport. Additional studies have elucidated the epigenetic regulation of SLC19A3. Liu et al. found that SLC19A3 expression decrease in gastric cancer due to promoter hypermethylation (Liu, Lam et al. 2009). Both hypermethylation and histone deacetylation of the SLC19A3 promoter are thought to be responsible for the epigenetic repression of this gene.
1.2.5.2.2.
Mitochondrial Thiamine Transporter (SLC25A19)
SLC25A19 (DNC, TPC, MUP1, MCPHA, THMD3, THMD4) is a 320 amino acid mitochondrial thiamine pyrophosphate transporter located on chromosome 17q25.3.
This
transporter has three variants that encode the same protein. The minimal promoter region contains a nuclear factor Y binding site that controls basal activity (Nabokina, Valle et al. 2013). Although originally thought responsible for the transport of deoxynucleotides into the
31
mitochondria, comparisons to yeast TPP transporter lead to its identification as a human TPP transporter (Dolce, Fiermonte et al. 2001, Lindhurst, Fiermonte et al. 2006, Kang and Samuels 2008). The transport of TPP into the mitochondrial is essential for the enzymatic activity of both PDH and α-Ketoglutarate Dehydrogenase (α-KGDH). Mutations in SLC25A19 result in Amish lethal microcephaly, a metabolic disorder characterized by elevations in 2-ketoglutaric acid (Kelley, Robinson et al. 2002). Currently little is known about malignant alterations in the expression of this transporter.
Zastre et al. were the first to show that the expression of
SLC25A19 increases in breast cancer tissue when compared to normal breast tissue (Zastre, Hanberry et al. 2013).
1.2.5.2.3.
Human Thiamine Pyrophosphate Transporter (SLC44A4)
SLC44A4 (hTTPT) encodes a recently characterized TPP transporter located on chromosome 6p21.3. This 710 amino acid transporter, recently described by Nabokina et al., transports TPP within human colon cells (Nabokina, Valle et al. 2013). Transport of TPP through hTTPT is both temperature and energy dependent but NA+ independent. hTTPT has a high specificity for TPP with an apparent Km of 0.17 μM (Nabokina, Inoue et al. 2014). The identification of this transporter suggests that bacterial-produced TPP produced may be transported and utilized by human cells. The recent nature of this finding has not allowed complete characterization and cellular localization of this transporter.
32
1.2.5.3.
Physiological Function
1.2.5.3.1.
Activation
Following its transport into the cell thiamine must first be phosphorylated to its active form, thiamine pyrophosphate (TPP), by the diphosphotransferase enzyme Thiamine Pyrophosphokinase (TPK1) (Liu, Timm et al. 2006). The conversion of thiamine to its cofactor form is hypothesized to be a driving force for thiamine uptake (Yoshioka 1984, Bettendorff 1995). TPP plays an essential role as an enzyme cofactor for three key enzymes within the glycolytic network; TKT, PDH, and α-KGDH. The continued presence of TPP is necessary to support enzymatic activity in subsequent daughter cells. In humans, TPK1 is ubiquitously expressed with high levels found in the small intestine, kidneys, and testis. Within human cells, three other phosphorylated forms of thiamine have been observed; thiamine monphosphate (TMP), thiamine triphosphate (TTP), and adenosine thiamine triphosphate (AThTP) (Gangolf, Czerniecki et al. 2010). Currently, the physiological functions of TMP, TTP, and AThTP have not been established. Of the four phosphorylated forms, TPP is the only phosphorylated form known to function as an enzyme cofactor. The dephosphorylation of TPP to TMP occurs through the enzyme thiamine pyrophosphatase (See Figure 1.5). TMP can be subsequently recycled back to free thiamine through the enzyme thiamine monophosphatase (Rindi and Laforenza 2000, Zhao, Gao et al. 2002). Both TPP and TMP are transported outside of the cell by SLC19A1 (Zhao, Gao et al. 2001). TPP is transported across the mitochondrial membrane by the mitochondrial thiamine transporter, SLC25A19, where it serves as a necessary cofactor for PDH and α-KGDH (Lindhurst, Fiermonte et al. 2006). Additionally, TPK1 exists as a homodimer with two splice variants, a long from and short form (Nosaka, Onozuka et al. 2001).
33
Mutations to or deficiency of TPK1 results in developmental delays, encephalopathy, and hypotonia (Mayr, Freisinger et al. 2011, Fraser, Vanderver et al. 2014). Although the role of TPK1 in thiamine conversion to TPP is well established, little is known about alterations in the expression and function of this enzyme during malignant progression (Sanioto, Reinauer et al. 1977, Liu, Timm et al. 2006). Zastre et al. were the first to show an increase in TPK1 gene expression in breast cancer tissue compared to normal breast tissue (Zastre, Hanberry et al. 2013). The role and regulation of TPK1 in malignant progression is a current area of need in the field.
34
Figure 1.4. Thiamine Homeostasis. Once transported into the cell, by THTR1 or THTR2, thiamine is converted to the cofactor form (TPP) by the enzyme TPK1. TPP can then be converted to TMP by thiamine pyrophosphatase (TPPase), and can be effluxed through RFC1. TMP can also be converted to free thiamine through thiamine monophosphatase (TMPase). .
35
1.2.5.3.2.
Distribution
Thiamine’s inability to be stored by mammalian cells results in the requirement for constant dietary intake. Gangolf et al. hypothesized that as a result of this inability, humans are highly sensitive to thiamine deficiency (Gangolf, Czerniecki et al. 2010). External factors such as nutrition, disease, gender, age, and lifestyle all contribute to the inter-patient variability in relative tissue distribution. The greatest concentration of thiamine and its derivatives is found in skeletal muscle, brain, heart, kidneys, and liver (Gangolf, Czerniecki et al. 2010). Kimura et al. reported that the concentration of thiamine in human plasma ranges from 10 - 20nM. This report indicates that only thiamine and TMP are found in the plasma while TPP and TTP are found in erythrocytes (Kimura and Itokawa 1983).
1.2.5.3.3.
Cofactor Role
Following transport into the cell, thiamine is phosphorylated to the active form TPP by the diphosphotransferase enzyme TPK1 (Yoshioka 1984, Bettendorff 1995, Liu, Timm et al. 2006). TPP functions as a cofactor for three key enzymes within the metabolic network; TKT, PDH, and α-KGDH (See Figure 1.6). TKT links glycolysis with the PPP and catalyzes a reversible conversion that produces R-5-P for use in de novo nucleotide synthesis. PDH links glycolysis to the TCA cycle by catalyzing the conversion of pyruvate to acetyl-CoA. α-KGDH plays an essential role in the TCA cycle and glutamine metabolism by catalyzing the conversion of alpha-ketoglutarate (α-KG) to succinyl-CoA.
36
Figure 1.5 The role of TPP as an enzyme cofactor. Following intracellular transport and activation TPP serves as a cofactor for TKT, PDH, and αKGDH. TKT is found in the nonoxidative portion of the PPP. Following transport into the mitochondria, by the mitochondrial thiamine pyrophosphate carrier (TPC), TPP serves as a cofactor for PDH and αKGDH.
37
1.2.5.3.3.1.
Transketolase (TKT)
The use of different metabolic pathways is regulated through an intricate balance of cellular mechanisms which regulate substrate availability (Berg, Tymocko et al. 2002).
Intermediate
products of metabolic pathways are used as precursors for small molecules and as a source of metabolic energy.
The generation of precursor molecules and energy occurs through both
catabolic and anabolic reactions. The PPP utilizes glycolytic intermediates to support cellular biosynthesis. The PPP has two pathways; the oxidative and non-oxidative (Wood 1985). The oxidative branch generates NADPH, which is used in reductive biosynthetic reactions such as the synthesis of fatty acids, and 5-carbon sugars such as ribose, which are used to synthesize nucleic acids.
The production of R-5-P is also supported by reversible reactions within the non-
oxidative portion (See Figure 1.7). The reaction mediated by the enzyme TKT represent a rate-limiting step within the nonoxidative portion of the PPP. This enzyme serves a critical role at the intersection of glycolysis and the pentose shunt by linking glycolysis to the PPP. (Novello and McLean 1968, Kauffman 1972). G-6-P enters the PPP and is subsequently converted to R-5-P in the oxidative branch of this pathway. This diversion of glucose carbons away from glycolysis and into the oxidative or non-oxidative portion of the PPP is necessary in order to produce R-5-P (Deberardinis, Sayed et al. 2008). R-5-P can either be used for de novo nucleotide synthesis or converted into F-6-P and G-3-P by TKT. If not utilized for de novo nucleotide synthesis, F-6-P and G-3-P and can then enter the Embden-Meyerhoff pathway to be used in the production of ATP. Excess ribose, or any ribose obtained through diet can subsequently be converted into glycolytic intermediates and used in other reactions (Berg, Tymocko et al. 2002).
38
Figure 1.6. Pentose Phosphate Pathway. Glucose-6-phosphate enters the PPP in the oxidative portion, in which NADPH is produced. Reactions within the non-oxidative portion of the pathway are reversible. Transketolase and transaldolase produce intermediates (F-6-P and G-3P) that are also substrates for glycolysis and thereby link the PPP back to glycolysis. Figure adapted from Missouri State-Mountain Grove.
39
In malignant cells, both the high rate of glycolysis and truncation of cellular metabolism support the shuttling of glycolytic intermediates into different metabolic pathways (DeBerardinis, Lum et al. 2008). The diversion of glucose carbons into the PPP to synthesize high amounts of nucleic acids is essential for rapid cellular proliferation in cancer cells. In H441 lung cancer cells, Boros et al. showed that 98% of ribose molecules is generated from the nonoxidative portion of the PPP (Boros, Torday et al. 2000). This group also showed that in pancreatic adenocarcinoma cells, 85% of ribose RNA came from the non-oxidative portion of the PPP (Boros, Puigjaner et al. 1997). Utilizing alternative pathways such as the PPP allows cancer cells to limit ROS production in hypoxia when cells are under oxidative stress. Oxidative stress in cancer cells suppresses M2PK activity leading to an increase carbon flux through the oxidative portion of the PPP and a decrease in reduced glutathione levels (Anastasiou, Poulogiannis et al. 2011).
NADPH,
generated in the PPP, is essential in the regeneration of glutathione for use in biosynthetic reactions. When human brain cells were exposed to hypoxia a reduction in Transketolase-like protein 1 (TKTL1) resulted in an increase in ROS generation and subsequent cell death (Wanka, Steinbach et al. 2012).
In human HCT116 colon carcinoma cells, knockdown of TKTL1
resulted in a reduction in both NADPH and glutathione levels and an increase in apoptosis due to ROS production (Xu, Zur Hausen et al. 2009). It is currently unclear how TKTL1 activity effects NADPH production, although it has been suggested that TKTL1 activity maintains a continuous flux of glucose carbons into the PPP (Zastre, Sweet et al. 2013) . Although the non-oxidative reactions carried out by TKT are thought to be the result of a single TKT gene there are two additional isoform of TKT; TKTL1 and TKTL2. TKTL1 has a 38 amino acid deletion within the cofactor and catalytic domains. This deletion suggests that this
40
protein is unable to bind to TPP and accomplish the TKT reaction (Mitschke, Parthier et al. 2010, Maslova, Meshalkina et al. 2012). A 38 amino acid deletion, resulting in a pseudo-TKTL1 was used to elucidate the functional role of this isoform.
Schneider et al. used a
spectrophotometric assay that monitored the conversion of known TKT substrates and showed that this TKTΔ38 mutant had TKT-like activity (Schneider, Ludtke et al. 2012). Both circular dichroism and proton nuclear magnetic resonance (1H-NMR) spectroscopy showed no association between the TKTΔ38 and TPP. Additional groups have used this TKTΔ38 mutant and confirmed the lack of TKT-like activity (Meshalkina, Drutsa et al. 2013). TKT exists as a homodimer and therefore it is unclear if the presence of the TKTΔ38 alters dimer formation. The expression of TKTL1 in mammals may influence the activity of TKT through its formation or heterodimers with other TKT isoforms. Although TPP binding to the TKTΔ38 was not observed it does not rule out the possibility of the binding of thiamine derivatives. TPP does not contribute to the catalytic activity of TKT but rather functions as to anchor the cofactor to the apo-enzyme. Gangolf et al. suggested that other derivatives might function in binding to the catalytic site of TKTL1 (Gangolf, Czerniecki et al. 2010). More work is needed in order to fully understand the complex regulation and activity of TKTL1 in mammals. TKTL1 overexpression is observed in a number of malignant tissues including endometrial, breast, ovarian, lung, colonic, urothelial, gastric and laryngeal (Langbein, Zerilli et al. 2006, Staiger, Coy et al. 2006, Foldi, Stickeler et al. 2007, Krockenberger, Honig et al. 2007, Volker, Scheich et al. 2007, Schultz, Kahler et al. 2008, Krockenberger, Engel et al. 2010, Schmidt, Voelker et al. 2010, Diaz-Moralli, Tarrado-Castellarnau et al. 2011). In many of these studies a high expression of TKTL1 showed a direct correlation with both tumor progression and poor patient prognosis (Langbein, Zerilli et al. 2006, Volker, Scheich et al. 2007, Diaz-Moralli,
41
Tarrado-Castellarnau et al. 2011, Schwaab, Horisberger et al. 2011). When TKTL1 expression is silenced, a decrease in cancer cells proliferation and a decrease in the growth of xenograft tumors has been observed (Hu, Yang et al. 2007, Zhang, Yang et al. 2007, Zhang, Yue et al. 2008, Chen, Yue et al. 2009, Xu, Zur Hausen et al. 2009, Yuan, Wu et al. 2010). Overexpression of TKTL1 in head and neck squamous cell carcinoma cells resulted in an increase in cellular proliferation when compared to vector control (Sun, Liu et al. 2010). This data suggests that an increase in the usage of the PPP, and specifically TKT, may be an important pro-survival response in malignant cells. Although HIF is hypothesized to regulate the expression of TKTL2, little is known about the role this thiamine depended enzyme plays in supporting malignant progression (Semenza 2012).
1.2.5.3.3.2.
Pyruvate Dehydrogenase (PDH)
The conversion of pyruvate to acetyl-CoA links glycolysis to the TCA cycle.
Like
glycolysis, the TCA cycle does not directly require molecular oxygen although it is required for NADH to generate NAD+. The oxygen dependent loss of electrons from NADH and FADH2 allow the TCA cycle to continue by donating these electrons to the electron transport chain. The irreversible conversion of pyruvate to acetyl-CoA takes place through a series of reactions that occur within the pyruvate dehydrogenase complex (PDC). This complex, which is located within the mitochondrial matrix, is composed of three enzymes that link glycolysis to the citric acid cycle (Zhou, McCarthy et al. 2001). The three components within the PDC are PDH (E1), dihydrolipoyl transacetylase (E2), and dihydrolipoyl dehydrogenase (E3). As a result of its location at the junction of glycolysis and the citric acid cycle, the PDC is a key regulatory complex for both the metabolism of glucose and the oxidation of fatty acids (Rardin, Wiley et al.
42
2009). The first enzymatic reaction in the PDC involves the enzyme PDH. PDH is a thiamine dependent enzyme that functions to convert pyruvate to hydroxyethyl-TPP. Figure 1.8 illustrates how each of the two active sites in PDH binds TPP and interacts during the conversion of pyruvate (Ciszak, Korotchkina et al. 2003). As is the case with many other tightly regulated biochemical reactions, PDH activity is controlled through reversible phosphorylation reactions (Randle 1986, Patel and Roche 1990). Within the mitochondria both pyruvate dehydrogenase kinases (PDKs) and pyruvate dehydrogenase phosphatases (PDPs) regulate PDH activity.
43
Figure 1.7. Structure of the tetrahedral subunits of the PDC E1 complex. α, red; α′, green; β, yellow; and β′, blue. PP and PP’ domains indicate TPP binding sites. PYR and PYR’ domains are binding sites for the aminopyrimidine ring of TPP. The two TPP cofactor molecules are shown in black. Mg2+ ions at the pyrophosphate terminus of TPP are shown as dark blue spheres. K+ ions are shown as magenta spheres. Ciszak et al. (2003)
44
PDK is a family of four isoenzymes (PDK1-4) that function to inhibit PDH activity through ATP-dependent phorphorylation (Yeaman, Hutcheson et al. 1978, Korotchkina and Patel 2001). Each of the isoenzymes differs in their ability to phosphorylate each of the three potential sites and is tissue specific. Phosphorylation by PDKs can occur at any of three serine residues; Ser-293, Ser-300, and Ser-232 often referred to as site 1, site2, and site 3 respectively (Korotchkina and Patel 1995, Kolobova, Tuganova et al. 2001). Phosphorylation at any of the three sites on PDH leads to inactivation of the complex (Kolobova, Tuganova et al. 2001). The four known PDKs differ in their ability to phosphorylate each of the three serine residues found on PDH. While PDK1 is able to phosphorylate PDH as any of the three phosphorylation sites, PDK 2-4 are only able to phosphorylate Ser-293 and Ser-300 (Korotchkina and Patel 2001). The PDKs also differ in the extent to which they phosphorylate PDH.
PDK2 was shown to
phosphorylate both sites 1 and 3 but to a lesser extent that PDK3 and PDK4. Interestingly they also reported that the binding of TPP to PDH altered the rate at which each of the serine sites could be phosphorylated. The rate at which each of the four PDKs phosphorylate site one decreased as a result of TPP binding. TPP also decreased the amount of phosphate incorporation at both sites 2 and 3 by PDK1. They also indicated that although TPP did not significantly affect phosphate incorporation in site 2 by PDK3 and 4 it leads to a decrease in the rate at which this site was phosphorylated. Therefore, TPP is a significant regulator of phosphorylation by PDKs (Kolobova, Tuganova et al. 2001). Regulation of PDK activity is also mediated through the accumulation of metabolic products such as ATP, NADH and acetyl-CoA, which stimulate activity, while pyruvate and ADP inhibit when in excess [33]. PDK is inhibited by accumulation of the reactions substrates including; TPP, pyruvate, NAD+, and CoA. When bound to PDH, reduces the rate and extent of
45
PDK-mediated phosphorylation [25]. Thus increasing concentrations of TPP through thiamine supplementation may be pro-apoptotic through restoration of PDH activity in cancer cells. This may explain why a reduction in tumor growth was observed with high-dose thiamine supplementation (Comín‐Anduix, Boren et al. 2001). Therefore, the potential of high-dose vitamin B1 to reduce cancer cell growth would be of particular significance and warrants further study. The expression of each of the PDKs differs in tissues throughout the body. PDK1 is expressed mainly in the heart but also in the skeletal muscle, pancreas, and liver. PDK2 is expressed in many tissues throughout the human body. PDK3 is expressed in the testis and also to some extent in the kidney, lung, spleen, heart, and brain. PDK4 is found in the skeletal muscle and heart and also in the kidney, lung, and liver. This inactivation of PDH is reversible through dephosphorylation by the enzyme PDP (Kolobova, Tuganova et al. 2001). Two enzymes, Pyruvate Dehydrogenase Phosphatases (PDP 1-2) are involved in the dephosphorylation PDH (Teague, Pettit et al. 1982, Huang, Gudi et al. 1998). PDPs are able to dephosphorylate any of the phorphorylated sites on PDH (Karpova, Danchuk et al. 2003). The expression of the two PDPs differs as PDP1 is expressed in the brain, heart, and testis and PDP2 is expressed in the kidney, liver, and heart but not in the testis or skeletal muscle (BowkerKinley, Davis et al. 1998, Huang, Wu et al. 2003).
46
Figure 1.8. Regulation of the E1 alpha component of the pyruvate dehydrogenase complex. Pyruvate dehydrogenase kinases (PDK) utilize ATP to phosphorylate the E1 alpha subunit of PDH at any of three serine residues. Phosphorylation at any site leads to inactivation of the enzyme. Phosphorylation is removed by pyruvate dehydrogenase phosphatases (PDP). Figure adapted from Abcam.
47
In normal cells PDH is active, allowing cells to maintain oxidative metabolism to produce ATP and other components necessary for cell survival and proliferation. However, PDH activity is suppressed in cancer due to its down-regulation and the overexpression of PDK isoforms (Koukourakis, Giatromanolaki et al. 2005, Lu, Lin et al. 2011, Baumunk, Reichelt et al. 2013, Hur, Xuan et al. 2013). The truncation of glucose metabolism, highlighted by preferential conversion of pyruvate to lactate, provides cancer cells with a metabolic advantage to maintain rapid proliferation (McFate, Mohyeldin et al. 2008). Interestingly, in tumor-associated stromal tissue, such as fibroblasts and vascular endothelial cells, PDH expression is elevated with a reciprocal decrease in PDK isoform expression (Koukourakis, Giatromanolaki et al. 2005, Koukourakis, Giatromanolaki et al. 2006). The increased PDH activity in surrounding tissues is hypothesized to assist in the detoxification of extracellular lactate produced by cancer cells (Koukourakis, Giatromanolaki et al. 2006). This metabolic symbiosis between cancer cells and stromal tissue may be enhanced through increasing thiamine availability, promoting PDH activity in normal tissue surrounding tumors. In hypoxic microenvironemnts, Hif-1α translocation affects the expression of genes such as PDK1. Kim et al. demonstrated a hypoxia induced increase in the expression of PDK1 in human colon carcinoma. This group suggested that an increase in PDK1 supports not only a cells adaptation to hypoxia but also helps maintain adequate ATP levels and attenuates ROS production in the mitochondria. Interestingly, blocking the Hif-1α mediated stabilization of PDK1 resulted in apoptosis. This study hypothesized that the cause of apoptosis, following PDC activation, was a result of oxygen depletion (Papandreou, Cairns et al. 2006). Additional studies have shown that Hif-1α can also induce the induction of PDK3. This suggests that treatment methods targeted at the PDK family of enzymes present a potential target for therapeutic
48
intervention (Kim, Tchernyshyov et al. 2006). Although hypoxia leads to the stabilization of Hif-1α, alterations in cellular metabolism can also lead to PDK induction. Using a metastatic head and neck squamous carcinoma cells McFate et al. showed that Hif-1α stabilization occurs under both normoxic and hypoxic conditions. They found that the metastatic cell line showed a greater level of PDK1, which increased the phosphorylation of PDH at site 1. Although they found a concentration dependent decrease in PDH-P293 in primary tumor cells, no change was observed in metastatic cells.
Additionally the PDK-1 shRNA
transfected cells metabolized [14C] glucose to [14C] CO2 at twice the rate of cells transfected with control shRNA (McFate, Mohyeldin et al. 2008).
Since PDK induction provides a
metabolic advantage to cancer cells it illustrates a window for potential therapeutic intervention. Restoration of PDH activity in cancer cells has been shown to promote apoptosis and is actively being assessed as a potential therapeutic strategy. A new approach to increasing the activity of the PDC is through the use of Dichloroacetic acid (DCA) (See Figure 1.10). DCA inhibits PDK-mediated phosphorylation of PDH in several cancer types (Michelakis, Webster et al. 2008, Madhok, Yeluri et al. 2010). The re-establishment of glucose oxidation in cancer cells through restored PDH activity results in an increase in mitochondrial ROS and cytochrome C release, ultimately leading to apoptosis (Bonnet, Archer et al. 2007, Xie, Wang et al. 2011). An additional study showed how inhibition of PDK1 activity, by the drug DCA, leads to a decrease in lactate production and pseudohypoxic Hif-1α stabilization. In this study, DCA decreased the level of phosphorylated PDH in primary cells but not in metastatic cells. Their study concluded that there may be other methods for restoring normal metabolism to cancer cells which might include targeting the vitamins and cofactors required for the activity of PDH (McFate, Mohyeldin et al. 2008).
49
Figure 1.9. Malignant Metabolic Alterations. Malignant survival and proliferation is supported through the truncation of glycolytic metabolism at the thiamine-dependent pyruvate dehydrogenase axis. PDKs phosphorylate PDH and inhibit the conversion of pyruvate to acetylCoA. DCA is a pyruvate mimetic which inhibits the inactivation of PDH through its interaction with PDKs. TPP has also been shown to decrease the extent of phosphate incorporation into PDH by PDKS.
50
1.2.5.3.3.3.
Alphaketoglutarate dehydrogenase (α-KGDH)
α-KGDH is located in the mitochondria and catalyzes the conversion of α-KG and NAD+ to succinyl-CoA and NADH. Like the PDC, the α-KGDH complex is composed of three subunits:
a thiamine pyrophosphate-dependent
dehydrogenase (E1), dihydrolipoamide
succinyltransferase (E2), and dihydrolipoamide dehydrogenase (E3) (Koike, Hamada et al. 1974, Koike and Koike 1976). The first two members of this complex, E1 and E2, are unique while the third is identical to the PDC (Perham 1991, Berg and de Kok 1997). The products of the PDC, NADH and CO2 are also similar to the products of the α-KGDH reaction. As is the case with most enzymes, α-KGDH is regulated through feedback inhibition by end products of the reaction (Garland 1964, Smith, Bryla et al. 1974, Lawlis and Roche 1981). In addition to feedback inhibition, α-KGDH is regulated by calcium and ATP/ADP ratio. Denton et al. found that micromolar levels of calcium and ADP lower the Km of α-KGDH while ATP increases the Km (McCormack and Denton 1979, Denton and McCormack 1980). Glutamate derived α-KG provides a carbon backbone structure that is used for the synthesis of nucleotides and amino acids (DeBerardinis, Mancuso et al. 2007). Additionally, αKG can form citrate that can be used in lipid biosynthesis (Metallo, Gameiro et al. 2012, Mullen, Wheaton et al. 2012). A reverse in the flux of carbons into the TCA cycle, as observed in the reductive decarboxylation of α-KG, allows cells to bypass the use of α-KGDH. It has been suggested that hypoxic stress is a trigger in regulating α-KGDH and allowing α-KG to move in reverse (Wise, Ward et al. 2011, Metallo, Gameiro et al. 2012). The TCA cycle plays a key role in supporting the synthesis of proteins, lipids, and nucleic acids, in proliferating cells. Intermediate molecules produced within this cycle support catapleurotic reactions that are necessary to support cell proliferation. For example, citrate can
51
be transported into the cytosol and converted to oxaloacetate (OAA) and acetyl-CoA. Within tumor cells an increase in ATP citrate lyase and fatty acid synthase function to support cell proliferation (Bauer, Hatzivassiliou et al. 2005, Hatzivassiliou, Zhao et al. 2005). Additionally the production of OAA and α -KG supply cells with nonessential amino acids that can be used in the production of both proteins and nucleotides (DeBerardinis, Lum et al. 2008). In the 1950’s Eagle et al. showed that tumors consume a large amount of glutamine (Eagle, Oyama et al. 1956). Glutaminolysis, now considered to be a hallmark of tumor cell metabolism, allows cells to metabolize glutamine in a manner similar to the oxidation of glucose in aerobic metabolism. Metabolism of glutamine, the most abundant amino acids found in mammals, provides proliferating cells with intermediates necessary for bioenergetics and biosynthesis (Eagle, Oyama et al. 1956, Kovacevic and McGivan 1983). Forbes et al. also showed that estrogen stimulation of breast cancer cells induces glutaminolysis (Forbes, Meadows et al. 2006). The subsequent export of malate, a product of the TCA cycle, to the cytoplasm is a major source of NADPH production in tumor cells (DeBerardinis, Mancuso et al. 2007).
1.2.5.4.
Thiamine related alterations observed in malignancy
1.2.5.4.1.
The role of supplementation
In 1974 Basu et al. reported that patients with breast and bronchial carcinomas are often thiamine deficient (Basu, Dickerson et al. 1974). These deficiencies have also been reported in colorectal, uterine, and B-chronic lymphocytic leukemia (Ostrovskii Iu, Trebukhina et al. 1979, Seligmann, Levi et al. 2001, Bruce, Cirocco et al. 2005). It has been hypothesized that the thiamine deficiency associated with cancer is a result of the glycolytic sweet tooth that must be satisfied by the maintenance of enzyme cofactors. As a result of thiamine deficiency, medical
52
professionals often supplement thiamine to patients in order to overcome many of the deleterious side effects associated with this condition. Although no correlation has been shown between thiamine supplementation and incidence of cancer in humans, research has shown that higher doses of thiamine can support tumor growth (Bruce, Furrer et al. 2003). Boros et al. also hypothesized that an excess of thiamine supplementation found in Western diet may correlate with an increase in cancer incidences (Boros 1999).
In Western
countries thiamine is often supplemented in food and as an over-the-counter vitamin. In direct contrast, African and Asian countries consume foods rich in thiaminase which naturally degrades thiamine and results in a reduced level of thiamine exposure (Boros 1999). Thiaiminase I, an enzyme that degrades thiamine, has been shown to inhibit the growth of breast cancer cells in vitro (Daily, Liu et al. 2011). Using MDA-MB-231 cells implanted into mice as a Xenograft, the same group showed a reduction in tumor proliferation when the animals were fed a thiamine free diet. Thiamine deficiency presents a unique problem in cancer treatment, as thiamine plays an important role in neurological function. In 1987 Kaul et al. conducted a study in which they surveyed patients with prostate cancer and found that they consumed less thiamine when compared to individuals without cancer. This observation suggests a negative correlation between thiamine supplementation and cancer risk (Kaul, Heshmat et al. 1987). In 2006, Kabat et al. examined samples from breast, endometrial, ovarian, colorectal, and lung cancer and found no correlation between the intake of B vitamins and cancer risk (Kabat, Miller et al. 2008). Additional studies have suggested that thiamine deficiency plays a role in tumor development (Lee, Yanamandra et al. 2005). Taken together, this data suggests a differential role in malignant maintenance of thiamine homeostasis.
53
Over-the-counter vitamin supplementation is often viewed as harmless and potentially beneficial to one’s health. Unfortunately, supplementation of thiamine to overcome deficiencyrelated complication is done with little understanding of thiamine’s role in malignant progression. In 2001, Comin-Anduix et al. utilized an Ehrlich ascites tumor-mouse model to evaluate the effects of thiamine supplementation. They found a statistically significant increase in tumor growth in mice that were supplemented with thiamine at a level between 12.5 to 37.5 times the Recommended Daily Allowance (RDA). At 25 times the RDA the tumor volume in these mice grew to 250 times that of control mice administered thiamine at the RDA. Interestingly, at values above 75 times the RDA no change in tumor proliferation was observed. When these mice were supplemented with 2,500 times the RDA a decrease in proliferation was observed when compared to control animals (Comin-Anduix, Boren et al. 2001).
These
observations suggest that thiamine supplementation both supports and reduces malignant proliferation based solely upon dose. A 2012 study examined the effects of a high fat diet on thiamine levels using a FVB/NTg(MMTVneu)202Mul/J transgenic breast cancer-tumor mouse model. In this study mice were fed either a diet that consisted of different fat and thiamine levels. Normal-fat (NF) diet, which contained 10% of the calories from fat, or a high-fat (HF) diet, which contained 60% of the calories from fat. Additionally, the low thiamine (LT) diet contained 2 mg of thiamine per 4,057 kcal while the normal thiamine (NT) diet contained 6 mg per 4,057 kcal. Mice fed a NF/LT diet displayed significantly longer (295 days) tumor latency when compared with animals fed a NF/NT diet (225 days).
When NF/LT animals were give a HF diet this observation was
eliminated the delay in tumor latency was eliminated (Daily, Liu et al. 2012).
This data
illustrates a cross-talk between diet and nutrient availability. These studies have established a
54
clear role of thiamine in malignant progression. In cases where patients require thiamine to overcome deficiency, thiamine should be carefully supplemented so as to avoid worsening this disease. As a direct result, the effects of thiamine supplementation on tumor progression require further study. The role of thiamine in cancer progression is further illustrated through the evaluation of the effects of thiamine analogs on tumor proliferation. Oxythiamine, an anti-coenzyme of thiamine, reduces tumor proliferation both in vitro and in vivo (Boros, Puigjaner et al. 1997, Rais, Comin et al. 1999, Ramos-Montoya, Lee et al. 2006). This mimetic inhibits the thiamine dependent enzyme TKT thereby reducing R5P production and subsequent DNA and RNA synthesis. This alteration in nucleotide synthesis resulted in a G1 cell cycle arrest in Ehrlich’s tumor cells (Rais, Comin et al. 1999). Chornyy et al. utilized rat PC-12 cells to show that oxythiamine also induced apoptosis through a caspase-3 signaling pathway (Chornyy, Parkhomenko et al. 2007). Liu et al. continued evaluating the effects of thiamine deficiency on tumor progression by adding thiaminase to cell culture media. This group found a significant decrease in breast cancer cell proliferation following culturing cells under these conditions (Liu, Monks et al. 2010).
Thiamine’s role in supporting bioenergetics with cancer cells was
demonstrated by a reduction in ATP levels in lymphoid leukemia cells cultured in the presence of thiaminase (Daily, Liu et al. 2011). Together these findings suggest a strong connection between thiamine dependent pathways and malignant proliferation.
1.2.5.4.2.
Thiamine status in cancer patients
Basu et al. utilized a whole blood TKT assay to quantify thiamine status in cancer patients (Basu, Dickerson et al. 1974, Basu and Dickerson 1976). This assay measures changes
55
in the activity of TKT after the exogenous addition of TPP. Samples that are thiamine deficient show an increase in TKT activity following the addition of TPP, termed the TPP effect (Chamberlain, Buttery et al. 1996). They found that patients with advanced stages of cancer exhibited a greater TPP effect when compared to control patients. This data suggests a decrease in thiamine status during malignancy. This group suggested that a decrease in thiamine status is a result of an inability to activate thiamine as opposed to an alteration in a patient’s dietary intake. Other groups have gone on to quantify changes in thiamine and thiamine phosphorylated in whole blood. Tsao et al. found that patients with advanced stages of non-small cell lung cancer show a decrease in circulating TPP (Tsao, Yin et al. 2007). Additional studies have gone on to demonstrate the same phenomena in patients with acute myelomonocytic leukemia, Burkett’s lymphoma, and B-chronic lymphocytic leukemia (van Zaanen and van der Lelie 1992, Seligmann, Levi et al. 2001). In each of these studies thiamine status was quantified in whole blood instead of tumor tissue. As a result the reduction in peripheral thiamine may be a consequence of increase uptake and utilization by cancer cells. Using an Ehrlich ascites tumor model, Trebukhina et al. demonstrated a correlation between tumor growth circulating thiamine depletion (Trebukhina, Ostrovsky et al. 1984). Biopsies of colon adenocarcinomas have shown a 2.5 fold increase in thiamine levels when compared to un-invaded tissues (Baker, Frank et al. 1981). Each of these studies suggests that a decrease in peripheral thiamine levels may be a direct result of an accumulation of thiamine in cancer cells and tissues.
1.3. RATIONALE AND GOAL Within cancer cells, alterations in enzymatic activity support malignant progression through the maintenance of bioenergetic and biosysnthetic processes. However, an increase in metabolic
56
activity must be coupled with an adequate supply of nutrient cofactors to support enzyme activity. Thiamine, vitamin B1, is an essential vitamin that provides all cells with a necessary metabolic cofactor. Intracellular supply and activation of thiamine is mediated via thiamine transporters and the thiamine-activating enzyme, TPK. Once activated, TPP, serves as a necessary cofactor for three key enzymes within the glycolytic network. Interestingly, thiamine supplementation has a dichotomous effect on cancer cell growth. This effect is characterized by growth stimulation at low doses and growth suppression at high doses. Unfortunately, how thiamine reduces cancer cell proliferation is currently unknown. Therefore the overall goal of this research is to determine the effects of high dose thiamine on cancer cell proliferation and then evaluate how changes in thiamine homeostasis impact the effectiveness of high dose thiamine supplementation.
1.4. RESEARCH OBJECTIVES 1.4.1. Determine the impact of high dose thiamine supplementation on cancer cell proliferation 1.4.2. Establish the alterations in thiamine homeostasis that occur within breast cancer 1.4.3. Determine the influence of hypoxic tumor microenvironments on the expression and function of the thiamine activating enzyme, TPK1
57
CHAPTER 2 HIGH-DOSE VITAMIN B1 REDUCES PROLIFERATION IN CANCER CELL LINES ANALOGOUS TO DICHLOROACETATE1
_______________________ 1 Bradley S Hanberry, Ryan Berger, and Jason A Zastre. (2014). Cancer Chemother & Pharmacol. 73:585–594. Reprinted here with permission of publisher.
58
2.1. ABSTRACT Purpose: The dichotomous effect of thiamine supplementation on cancer cell growth is characterized by growth stimulation at low doses and growth suppression at high doses. Unfortunately, how thiamine reduces cancer cell proliferation is currently unknown. Recent focuses on metabolic targets for cancer therapy have exploited the altered regulation of the thiamine-dependent enzyme pyruvate dehydrogenase (PDH). Cancer cells inactivate PDH through phosphorylation by overexpression of pyruvate dehydrogenase kinases (PDKs). Inhibition of PDKs by dichloracetate (DCA) exhibits a growth suppressive effect in many cancers. Recently it has been shown that the thiamine co-enzyme, thiamine pyrophosphate reduces PDK mediated phosphorylation of PDH. Therefore, the objective of this study was to determine if high dose thiamine supplementation reduces cell proliferation through a DCA like mechanism.
Methods: Cytotoxicity of thiamine and DCA were assessed in SK-N-BE and Panc-1 cancer cell lines. Comparative effects of high dose thiamine and DCA on PDH phosphorylation were measured by Western blot. The metabolic impact of PDH reactivation was determined by glucose and lactate assays. Changes in the mitochondrial membrane potential, ROS production, and caspase-3 activation were assessed to characterize the mechanism of action.
Results: Thiamine exhibited a lower IC50 value in both cell lines compared to DCA. Both thiamine and DCA reduced the extent of PDH phosphorylation, reduced glucose consumption, lactate production, and mitochondrial membrane potential. High dose thiamine and DCA did not increase ROS but increased caspase-3 activity.
59
Conclusion: Our findings suggest that high dose thiamine reduces cancer cell proliferation by a mechanism similar to that described for dichloroacetate.
Key Words: Metabolism, Vitamin, Thiamine, Pyruvate Dehydrogenase, Dichloroacetate
2.2. INTRODUCTION A high rate of glycolysis and an increase in lactate production have long been considered hallmarks of cancer. This oncogenically driven change in cellular metabolism supports an increase in biomass and ATP generation that is necessary to sustain rapid proliferation. A critical regulatory step supporting the enhanced glycolytic activity in cancer cells is the reduced activity of the vitamin B1 (thiamine) dependent enzyme pyruvate dehydrogenase (PDH), which limits the conversion of pyruvate to acetyl-CoA. The decrease in PDH activity reduces glucose carbon flux into the tricarboxylic acid (TCA) cycle and consequently excess glucose carbons are converted to lactate in order to regenerate NAD+ for continued ATP production. This truncation in glucose metabolism also facilitates the shunting of phospho-metabolites into additional metabolic pathways for biosynthetic reactions (Gatenby and Gillies 2007, Hsu and Sabatini 2008) The activity of PDH is regulated through reversible phosphorylation reactions controlled by pyruvate dehydrogenase kinase (PDK) and pyruvate dehydrogenase phosphatase. PDK is a family of four isoenzymes (PDK1-4) that inactivate PDH through phosphorylation on three serine residues (Ser-293, Ser-300, and Ser-232) (Korotchkina and Patel 2001). PDK1 is the only isoform that has been shown to phosphorylate all three sites on PDH, while PDK2/3/4 primarily phosphorylate Ser-293 and Ser-300
(Kolobova, Tuganova
60
et
al. 2001). Although
phosphorylation at any of the three sites leads to inactivation, Ser-293 is the predominant phosphorylation site (Yeaman, Hutcheson et al. 1978, Sale and Randle 1981). Overexpression of PDK1 has been found in cancers such as breast, head and neck, and lung cancers (Koukourakis, Giatromanolaki et al. 2005, Lin, Hsieh et al. 2005). When PDK1 is knocked down, PDH activity and glucose oxidation are restored resulting in reduced lactate production and suppression of tumor growth (McFate, Mohyeldin et al. 2008). PDK isoforms have also been characterized as direct transcriptional targets for hypoxia inducible factor 1-α (Lu, Lin et al. 2008, Wigfield, Winter et al. 2008). Up-regulation of PDKs in hypoxic tumor microenvironments directly supports the increase in anaerobic glycolytic activity observed in hypoxic cancer cells (Kim and Dang 2006). Overexpression of PDKs is also associated with chemoresistance. Knockdown of PDK1 and PDK3 increased cytotoxicity of the anticancer drugs paclitaxel and cisplatin (Lu, Lin et al. 2008). Thus, inactivation of PDH activity in cancer cells through overexpression of PDKs is an important pro-survival pathway exploited by cancer cells. The inhibition of PDK mediated phosphorylation of PDH has shown considerable promise as a targeted strategy to reduce cancer cell proliferation (Bonnet, Archer et al. 2007). One such compound, dichloroacetate (DCA) is effective at reducing cell growth in a number of malignancies including breast, endometrial, lung, and colorectal (Bonnet, Archer et al. 2007, Madhok, Yeluri et al. 2010, Sun, Fadia et al. 2010). Re-establishment of PDH function normalizes glycolytic activity in cancer cells, directing glucose carbons through mitochondrial oxidative phosphorylation pathways. Cancer cells with defective mitochondrial electron transport chain are unable to cope and as a result increase reactive oxygen species (ROS) generation, cytochrome C release, and ultimately apoptosis (Garber 2006, Papandreou, Goliasova et al. 2011). An advantage to targeting PDK activity is that overexpression of PDKs and extensive
61
phosphorylation of PDH is found in cancer cells and not in normal tissue (Madhok, Yeluri et al. 2010). This may provide for selective targeting towards malignant tissue and avoiding unwanted off target toxicity commonly observed with conventional chemotherapy. PDH activity is also regulated by substrate and end product feedback. The products of the PDH reaction (NADH and acetyl-CoA) stimulate phosphorylation by PDKs, while an excess of substrates (pyruvate and ADP) or cofactor (thiamine pyrophosphate; TPP) inhibits phosphorylation (Roche and Hiromasa 2007). Kolobova et al. found that TPP decreased both the rate and extent of PDH phosphorylation by PDK isoforms (Kolobova, Tuganova et al. 2001). Thus increasing concentrations of TPP through thiamine supplementation may be pro-apoptotic through restoration of PDH activity in cancer cells similar to the mechanism observed with DCA. This may provide a mechanistic understanding as to why thiamine suppressed tumor growth at doses greater than 75 times the recommended daily intake (Comín‐Anduix, Boren et al. 2001). Therefore, the objective of this study was to determine if high dose thiamine supplementation reduces cellular proliferation of cancer cells through a mechanism involving a reduction in PDH phosphorylation.
2.3. MATERIALS AND METHODS Materials: All cell culture reagents including gentamicin and trypsin/EDTA were obtained from Mediatech (Manassas, VA). Custom formulated thiamine-deficient RPMI 1640 was also prepared by Mediatech to allow for the controlled addition of thiamine. Cell culture treated flasks, plates, and dishes were obtained from Greiner Bio-one (Monroe, NC). Fetal bovine serum (FBS), crystal violet, thiamine hydrochloride, and sodium dichloroacetate (DCA) were
62
purchased from Sigma Aldrich (St. Louis, MO).
Actinomycin-D was obtained from.
Cycloheximide was obtained from.
Cell Culture: The cancer cell lines Panc-1 (pancreatic) and SK-N-BE (neuroblastoma) were obtained from ATCC (Manassas, VA). All cell lines were maintained in thiamine-deficient RPMI 1640 supplemented with 30 nM thiamine, 10% FBS, and 0.2% gentamicin (referred to as T30 media). Cells were maintained at 37°C in a humidified atmosphere of 5% CO2, referred to as normoxia. All hypoxia treatments were conducted at 37°C with 5% CO2 and 1% O2 using an incubator outfitted with a ProOX oxygen controller (Biospherix, Lacona, NY) which supplies nitrogen gas. Oxygen levels and calibration were monitored daily using a Bacharach Fyrite Gas Analyzer (Bacharach, Inc., Pittsburgh, PA). All cell culture media for hypoxic treatments and subsequent media changes was pre-equilibrated in the hypoxic environment at least 24 h prior to use.
Cell Proliferation Assays: The effects of thiamine and DCA on cell proliferation were determined using the crystal violet assay as described previously (Journe, Laurent et al. 2008). Briefly, cells were seeded into 96 well plates at a density of 3,000 (Panc-1) or 9,000 (SK-N-BE) cells/cm2 and allowed to attach overnight. Media was than replaced with increasing concentrations of either thiamine or DCA and cells allowed to grow for 5 days at 37°C. After which the media was aspirated and cells washed with phosphate buffered saline (PBS) than fixed with 10% neutral buffered formalin (EMD Millipore, Darmstadt, Germany) for 1 h at 4°C. The fixed cells were gently washed under running distilled water and stained with 0.1% crystal violet for 30 min, than washed again with distilled water and allowed to dry overnight. To quantify the
63
extent of crystal violet staining, cells were de-stained with 200 μL of 1% Triton X-100 and the absorbance measured at 550 nm using a Spectra Max M2e (Molecular Devices, Sunnyvale, CA) microplate reader. The proliferation was calculated as the percent viability comparing treated cells to control cells cultured in T30 media only. The IC50 values were determined using nonlinear regression using GraphPad Prism 6 software.
Western Blotting: The effects of thiamine and DCA on the extent of PDH phosphorylation was assessed by Western blot. Cells were seeded into 60 mm cell culture dishes and upon reaching ~75% confluency were treated with either T30 media, T30 media + 25 mM thiamine, or T30 media + 25 mM DCA for 24 and 48 h at 370C. Following treatment, cells were washed with ice cold PBS and lysed using 50 mM Tris, 250 mM NaCl, 1 mM EDTA, 1% NP-40, 0.5% sodium deoxycholate, 0.1% SDS supplemented with protease inhibitor and phosphatase inhibitor cocktail (EMD Biosciences, La Jolla, CA). Lysates were then centrifuged at 14,000xg and 4°C for 20 min with the supernatant collected. Protein concentration was determined using the Pierce BCA Protein Assay Kit (Thermo Scientific, Rockford, IL). Whole cell lysates (50 μg) were electrophoresed on a 10% SDS-PAGE gel than transferred to a polyvinylidene difluoride membrane (Hybond-P, GE Healthcare, Piscataway, NJ). The membrane was blocked with 3% bovine serum albumin (KSE Scientific, Durham, NC) in Tris-buffered saline tween 20 (TBS-T) for 1 h. The membrane was blotted for either total PDH-E1α (Genetex, Irvine, CA), PDH pSer-293, PDH pSer-300, PDH pSer232 (Calbiochem, La Jolla, CA), or β-Actin (Sigma Aldrich, St. Louis, MO) overnight at concentrations of 1:1000, 1:500 (for all PDH phosphorylation antibodies), and 1:1000, respectively in TBS-T. Blots were washed in TBS-T three times for 10 min each and blotted with either goat anti-mouse
64
horseradish peroxidase (HRP) secondary antibody (Millipore, Billerica, MA) for β-Actin at 1:20,000 or donkey anti-rabbit HRP (Bethyl, Montgomery, TX) for PDH-E1α and PDH pSer293 at 1:15,000 in TBS-T for 1 h. Blots were again washed 3 times for 10 min with TBS-T, visualized using Supersignal West Pico (Thermo Scientific, Rockford, IL), and imaged using a Fluorchem SP digital imager (Alpha Innotech, San Leandro, CA). Densitometry was performed using Fluorchem SP software. The change in PDH phosphorylation is expressed as a ratio of control (Ser-293/PDHE1α) to treated (Ser-293/PDHE1α) cells.
Glucose and Lactate Assay: The effects of thiamine and DCA on glucose consumption and lactate production were assessed using commercially available glucose (Sigma Aldrich, St. Louis, MO) and L-Lactate assay (Eton Biosciences, San Diego, CA) kits. Cells seeded into 60 mm cell culture dishes were allowed to reach ~75% confluency than treated with either T30 media, T30 media + 25 mM thiamine, or T30 media + 25 mM DCA for 24 and 48 h at 37°C. Following treatment, media samples were collected and centrifuged at 14,000xg and 4°C for 5 min to pellet any cell debris. For the quantitation of glucose remaining in the media, 10 μL of media sample or standard was added to a 96-well plate followed by addition of the supplied assay reagent (90 μL). The reaction was allowed to proceed for 15 min at room temperature and the absorbance measured at 340 nm. For lactate, 50 μL of media sample or standard was placed into a 96-well plate followed by addition of 50 μL of the supplied assay reagent. The plate was set at 37°C for 30 min, after which the reaction was stopped by the addition of 50 μL of 0.5 M acetic acid (EMD Millipore, Darmstadt, Germany) and the absorption measured at 490 nm. Results were normalized to total cellular protein using the Pierce BCA Protein Assay Kit (Thermo Scientific, Rockford, IL).
65
Mitochondrial Membrane Potential: The potentiometric dye tetramethylrhodamine methyl ester (TMRM) (Sigma Aldrich, St. Louis, MO) was used to assess changes in mitochondrial membrane potential (MMP). Cells were seeded into 48 well plates and cultured until ~75% confluency. Cells were treated with either T30 media, T30 media + 25 mM thiamine, or T30 media + 25 mM DCA for 48 h. The protonophore FCCP (Sigma Aldrich, St. Louis, MO) was added 3 h prior to TMRM addition to a group of T30 media control cells (25 μM) as a positive control for changes in membrane polarization. TMRM was than added to each well (25 nM) and cells incubated at 37°C for 30 min. The media was then aspirated and wells washed twice with PBS (37°C) to remove extracellular TMRM. An aliquot of PBS (500 μL) was then placed into each well and the fluorescence was measured at EX=550 nm and EM=575 nm using a Spectra Max M2e microplate reader. Data was normalized to total cellular protein, which was quantified using the Pierce BCA Protein Assay Kit (Thermo Scientific, Rockford, IL).
Hydrogen Peroxide (H2O2): Production of H2O2 was determined using the commercially available hydrogen peroxide fluorometric detection kit (Enzo Life Sciences, Farmingdale, NY). Cells were treated with the oxidative phosphorylation inhibitor rotenone (5 μM) (Calbiochem, La Jolla, CA), 25 mM thiamine, or 25 mM DCA for 30 min, 1 h, and 2 h prior to assay. After treatment, the media was removed and wells washed twice with PBS (37°C). 200 μL of supplied reaction mixture (Detection Reagent, Horse Radish Peroxidase, and PBS) was added to each well and the cells were allowed to incubate for 10 min at room temperature. Fluorescence was then measured at EX=550 nm and EM=590 nm. Data was normalized to total cellular protein as determined using the Pierce BCA Protein Assay Kit (Thermo Scientific, Rockford, IL).
66
Caspase-3: Activation of caspase-3 was measured using the commercially available caspase-3 fluorescence assay kit (Cayman Chemical Company, Ann Arbor, MI). Treatment of cells with thiamine and DCA was performed as described above for the TMRM assay. 24 h prior to caspase-3 assay a set of control cells were treated with the topoisomerase I inhibitor (1 μM) SN38 (LKT Laboratories, St. Paul, MN) as a positive control for caspase-3 induction. Following 48 h of thiamine and DCA treatment, the cells were washed with supplied caspase-3 assay buffer. 100 μL of supplied lysis buffer was added to each well and incubated for 30 min at room temperature on an orbital plate shaker. Cell lysates were collected and centrifuged for 10 min at 800xg after which 90 μL of supernatant was transferred to a 96-well plate. 100 μL of the supplied caspase-3 substrate solution was then added to each well and the plates were incubated at 37°C for 30 min. The fluorescence was measured at EX=485 nm and EM=535 nm. Data was normalized to total cellular protein as determined using the Bio-Rad Protein Assay Kit (Hercules, CA) and expressed as the relative fluorescence per mg protein.
Statistical Analysis: All experiments were performed with a minimum of three independent experiments unless otherwise noted. Statistical significance was evaluated using unpaired Students t-test with a significance level of p