Sustainability Issues in European Sensitive Areas SENSOR Project Deliverable Report 6.1.1
SENSOR REPORT SERIES 2007/05
SENSOR Sustainable Impact Assessment: Tools for Environmental, Social and Economic Effects of Multifunctional Land Use in European Regions www.ip-sensor.eu
Title
Sustainability Issues in European Sensitive Areas
Authors
Dilly O, Rogaß C, Doerrie C, Schneider BU, Hüttl RF (BTUC); Hallenbarter D, Kräuchi N (WSL); Imrichová Z, Kenderessy P, Oszlányi J (ILE-SAS); Putzhuber F, Hasenauer H (BOKU); Oja T, Kull A, Mander Ü (UTARTU); Moncada S, Camilleri M (MEPA); Stuczynski T, Korzeniowska R, Siebielec G, Koza P, Lopatka A, Pudelko R, Kowalik M (IUNG)
Date
April 2007
Category
Project Deliverable Report
Deliverable title
D 6.1.1 Set of representative key issues of sustainability for sensitive areas in Europe
Submission date
March 2007
SENSOR Project
The Integrated EU project SENSOR aims to develop ex-ante Sustainability Assessment Tools (SIAT) to support policy making regarding multifunctional land use in European regions. Land use represents a key human activity which drives socio-economic development in rural regions and manipulates structures and processes in the environment. At the European level, policies related to land use intend to support the efficient use of natural resources and to improve socio-economic developments. The project is financed by the EU 6th Framework Programme. Project duration is four years, starting in December 2004. The project is carried out by a consortium of research institutes, led by the Leibniz-Centre for Agricultural Landscape Research (ZALF). This document contributes to the development of a scientific methodology for generating an overview of delineated key issues of sustainability in sensitive areas at European level. The paper contains geo-referenced spatial data for the SIAT validation.
Keywords
Sustainability Impact Assessment Tools, Multifunctional Land Use, sensitive area types, spatial regional reference framework, key sustainability issues, socio-economic indicators, post-industrial regions, social, environmental, economic, sensitivity, post-industrial zones, European mountains, European coasts, European islands, sustainability issues, sustainable development issues, impact assessment
Correct Reference
Dilly O et al. (2007) Baseline scenario storylines. In: Helming K, Wiggering H (eds.): SENSOR Report Series 2007/5, www.sensor-ip.eu, ZALF, Germany
Prepared under contract from the European Commission Contract no 003874 (GOCE) EU FP6 Integrated Project Priority Area 1.1.6.3 "Global Change and Ecosystems" December 2004 - December 2008 This publication has been funded under the EU 6th Framework Programme for Research, Technological Development and Demonstration, Priority 1.1.6.3. Global Change and Ecosystems (European Commission, DG Research, contract 003874 (GOCE)). Its content does not represent the official position of the European Commission and is entirely under the responsibility of the authors. The information in this document is provided as is and no guarantee or warranty is given that the information is fit for any particular purpose. The user thereof uses the information at its sole risk and liability."
SENSOR Report Series 2007/05
Table of Contents Executive Summary
4
1
Introduction and Background
6
2
Objectives
11
3
Materials and Methods
12
3.1 3.2 3.3 3.4 3.5
12 12 14 15 16
4
Steps for location and key issue identification Post-industrial zones Mountains Coasts Islands
Results and Discussion
17
4.1 4.2 4.3 4.5
17 21 23 27
Post-industrial zones Mountains Coasts Overview on key issues in sensitive areas
5
Conclusions
32
6
Perspectives
33
7
References
34
Figures Fig 1 Agricultural DPSIR model (COM 2000) Fig 2 NUTS x cells used for the analysis of coasts Fig 3 Density of post-industrial sites (delineated post-industrial plus dump and extraction sites) in NUTS x grid within Europe based on CLC 2000 Fig 4 Spatial distribution of NUTS 2/3 within 6 types of post-industrial areas Fig 5 Sensitive mountain regions according to the type-classification by UNEP criteria formountain areas and priority areas for Structural Fund Objectives by the EuropeanCommission Fig 6 Clusters analysis of European coasts using economic, social and environmental indicators Fig 7 Percentage Insular Cover of NUTS x regions containing islands Fig 8 Classes of islands based on the clustering of sustainability issues of 28 study islands Fig 9 Geographical location of sensitive areas and sensitive area case studies in Europe Tables Table 1 Impact issues (COM 2005) and the respective indicators selected by SENSOR M2 (Bratislava, April 2006) Table 2 Identification of European mountains according to the criteria ‘altitude’ and ‘slope’ used in Nordregio (2004) Table 3 Type-classification of mountains as defined by UNEP criteria for mountain areas and priority areas for Structural Fund Objectives Table 4 Conflicts between sustainability issues in coasts Table 5 Overview on the 6 types of post-industrial areas within EU-25 Table 6 Indicators with respective impact issues in brackets for the 6 types (T) of postindustrial areas Table 8 Impact issues (COM 2005) and indicators separating sensitive region classes Table 9 Indicators in sensitive NUTS x regions with reference to mean EU-25 Table 10 Contribution of sensitive area types to clusters of the Spatial Regional Reference Framework SRRF
Annex Annex Annex Annex
1 2 3 4
-
Key Key Key Key
issues issues issues issues
in in in in
European European European European
post-industrial zones mountains coasts islands
(48 (43 (93 (83
10 18 21 22 26 28 29 30 34
9 16 17 19 22 24 31 33 35
pages) pages) pages) pages)
3
SENSOR Report Series 2007/05
Sustainability Issues in European Sensitive Areas Oliver Dilly / BTUC (
[email protected])
Executive Summary Key issues of sustainability related to multifunctional land use were identified for spatially delineated sensitive areas in Europe. Four sensitive areas types were considered: postindustrial zones, mountains, coasts and islands. This work contributes to the bottom-up evaluation of the Sustainability Impact Assessment Tools (SIAT) which supports decision making on policy cases. The SIATs respond to information needs at European land use policy level by the interface of information and design with end users. This overview was generated in accordance with the impact assessment guidelines of the European Commission which was released in 2005 and distinguishes economic, social and environmental impact issues. This work here is linked to the ‘Spatial Regional Reference Framework’ (SENSOR Report Series 2006/04 and Deliverable 3.1.3) and ‘Sustainability issues identified in the extensive and intensive social studies’ (SENSOR Deliverable 7.3.1). The analysis was made primarily on NUTS x level which range between NUTS 2 and NUTS 3. The georeferenced information, which was mainly derived from EUROSTAT, but also from other international and national data sources, was complemented by an analysis of existing literature, expert interviews and stakeholder questionnaires, which were used to identify key sustainable development issues. The spatial data was harmonised in an ArcGIS spatial dataset in line with SENSOR Module 5 conventions (SENSOR Report Series 2006/01 and Deliverable 5.1.2) and SIAT requirements. The spatial delineation of the sensitive area types was cross-referenced with the SRRF developed within Module 3, which consists of 30 classes of well defined physio-geographic and socioeconomic characteristics. It is important to emphasize that clustering was used here to define classes of sensitive areas across Europe and was not an alternative to SRRF adopted by SENSOR for distinguishing homogenous landscape units. This European overview of sensitive areas produced a generally applicable list of sustainability issues for each sensitive region type through consultation with key experts. In addition, within these sensitive areas representative sustainability ‘hot-spots’ were identified for more intensive research referred to as ‘Sensitive Area Case Studies’ (SACS). Module 7 in collaboration with Module 6 will engage with regional and local stakeholders to produce finer resolution analyses of sustainability issues in these ‘hot-spots’. The findings of research conducted over the first 18 months of the project are presented in this report, together with some recommendations for SIAT design and the developing focus of the SENSOR project. SENSOR separated approximately 473 NUTS x cells within EU-25 and 560 NUTS x cells for the EU-25+5 from which a high percentage was identified as being sensitive. Post-industrial zones and coasts and also islands were classified on cluster analysis aimed at delineating a number of homogenous areas representing similar environmental and socio-economic pattern. The overview on mountains is founded on objectives of the UNEP and the overview of the islands on expert consultations. Clustering of post-industrial zones and coasts was semi-quantitative or qualitative reflecting specificity of these areas, expert classification of mountains and islands was the only feasible approach since complete data and indicator sets were scarce and did not entirely refer to processes important for maintaining sustainability. The overview used statistical analysis of impact issues reflected by indicators and an expert assessment based on previous research. Post-industrial areas were identified based on the density of earlier industrial sites which was assessed by using the CORINE 2000 land cover layer. The density equal to 0.3 % of the region area within a NUTS x cell was considered as a threshold leading to 167 post-industrial NUTS x cells. Based on the analysis of the socio-economic and environmental status of these post-industrial areas, 6 types were separated: (1) eastern transitional industrial, socially and
4
SENSOR Report Series 2007/05
economically weak, (2) western, economically and socially strong (medium density of postindustrial sites), (3) western, economically and socially strong (high density of post-industrial sites), (4) southern, socially and economically weak, (5) Urban and (6) Western socially weak areas. Types 1 and 4 were classified as sensitive areas. Mainly socio-economic issues and indicators separated the classes. Mountain areas that occur in almost all parts of Europe were classified according to UNEP objectives. Around 50 NUTS cells, home of 22 % of the European population, are determined to have highest priority for policy measures in the period 2000 to 2006. These include high mountain ranges in Spain, in southern Italy (including Sicily), in Greece (including Crete), Bulgaria, Montenegro, Romania and Norway and other mountain areas in Spain, Portugal, Corsica, southern Italy (including Sicily), Greece, Bosnia-Herzegovina, Serbia, Macedonia, Romania, Poland, Czech Republic, Slovenia, Hungary and Norway and finally mountain areas in northern Norway. Mainly economic key issues such as low investment, poor services for businesses & individuals and poor basic infrastructure were identified. Coasts were identified on the basis of shorelines and the multidimensional clustering at NUTS x level. Seven classes were separated using generalisable criteria. Improved results were obtained on the NUTS 2 level clustering with 15 indicators characteristic for economic, social and environmental issues and with 6 classes. A coast class with 23 NUTS 2 areas and 5 islands has been identified particularly as sensitive with rapidly growing economy combined with relatively high but decreasing unemployment, low but increasing income, low R&D investment rate, low share of arable land but high share of rural population, moderate coast line length with the highest share of coast exposed to coastal erosion and highly variable environmental protection. A total of 5,116 islands were identified occupying 6.8 % of EU-25+5. Island areas are found in 136 NUTS x units, 25 of which are entirely insular. In order to identify key sustainability issues, 28 study islands were identified and 26 expert interviews were carried out for these islands. On this basis, 12 key island issues were identified, for which 16 sustainability indicators were developed, drawing also on the SENSOR indicators. A spatial dataset was constructed, and statistical spatial cluster analysis was performed to determine areas experiencing greater pressure. This resulted in 2 classes, Northern Islands and Southern Islands. This overview points out that the resolution for reliable information and data gathering essentially need to be higher than NUTS 2 to NUTS 3 level which will be further explored in SACS. In addition, more attention must be given to harmonize data, particularly indicators, at European, national and regional level which is complicated due to the European federalist nature. In conclusion, the sensitive post-industrial zones, mountains, coasts and islands were localised in Europe and key issues determined at NUTS 2 and NUTS x level based on some consistent data sets and expert knowledge. The key issues in sensitive areas differed from regular European regions. Cluster analysis helped identifying and classifying post-industrial zones and coasts and UNEP objectives aided the mountain cell selection. European islands do mainly refer to smaller scales for which a data base needs to be continuously developed.
5
SENSOR Report Series 2007/05
1
Introduction and Background
The European Union contains 25 member states in 2006 and covers 38 % of Europe. The Union is set to expand to include the two candidate states of Bulgaria and Romania in the near future. Each country has its specific history and culture and national governments range from centralised to federalist political structures. SENSOR works at EU-25+5 which includes Iceland, Norway and Switzerland additionally. The physiographic European Union includes gradients from arctic to Mediterranean, maritime to continental climatic factors and altitudes from sea level to mountains of about 4000 m above sea. In 2004, the population density was 118 people per km2 in the European Union (EUROSTAT 2004) and 96 people per km2 in entire Europe and thus high in comparison to 30 people per km2 in the U.S.A. The European population mainly resides in urban areas. Higher population densities occur in China and India with 136 and 304 people per km2 respectively. Under such high population pressures, Europe’s land areas necessarily need to be used for a number of functions, e.g. for agriculture, forestry, nature conservation, energy, transport, infrastructure, and tourism. These land use types are considered to become even more important due to limited natural resources and increasing population and are therefore addressed in the EU Integrated Project ‘Sustainability Impact Assessment: Tools for Environmental, Social and Economic Effects of Multifunctional Land Use in European Regions – acronym SENSOR’. The European Commission has launched its impact assessment guideline in 2005 in order to support the thorough evaluation of any policy action regarding its efficiency for a range of economic, social and environmental issues (COM 2005). The guidelines identify 5 key analytical steps: (1) Identify the problem, (2) Define the objectives, (3) Develop main policy options, (4) Analyse their impacts, (5) Compare the options and (6) Outline policy monitoring and evaluation. SENSOR works from step 4 to 6 on the identification of policy options and policy cases. This impact assessment guidelines lists 11 economic (ECON), 9 social (SOC) and 12 environmental (ENV) issues and in addition one ‘other’ for each issue type (Table 1). The impact assessment guidelines are based on the DPSIR (Driver / Pressure + Benefits / State / Impact / Response) approach which is standard in European Environmental Agency (EEA) work and has become popular in EU-funded research (EEA; Fig. 1). The allocation of issues varies with the question posed. ‘Drivers’ are general economic behaviour, ‘pressures’ are land use changes, ‘state’ is e.g. expressed by social, economic and environmental parameters, ‘Impacts’ are all impact issues and the ‘responses’ are the policy decisions, which are transferred into driving force scenarios in our system. The approach in turn is based on an earlier scheme which the OECD uses for environmental assessment studies, called PSR (OECD 1993). The PSR scheme was intended to be a basis for formulating indicators of pressures causing environmental stress (P), of the state of the environment (S), and of actions being taken (R). However, the application of the DPSIR approach requires that impact issues need to be allocated according to the identified problems of the impact assessment.
6
SENSOR Report Series 2007/05
Table 1 Impact issues (COM 2005) and the respective indicators selected by SENSOR (Bratislava, April 2006) Impact issue
Indicators
Real effective exchange rate - Gross fixed capital formation by the private sector - Capital account of the balance of payments ECON1: Competitiveness, trade and investment flows - Net trade flows, overall; net trade flows for agricultural products - Energy, tourism & wood ECON2: Competition in the internal market
Price convergence between member states
ECON3: Operating costs and conduct of business
Labour cost - Energy price
ECON4: Administrative costs on business
Qualitative
ECON5: Property rights
Qualitative
ECON6: Innovation and research
Number of researchers per 1000 employed persons - Number of patent applications per 1000 inhabitants - Labour productivity per hour worked
ECON7: Consumers and households
Consumer Price Index - Structure of consumption
ECON8: Specific regions or sectors
Gross value added per sector - Sectoral shares in GDP
ECON9:Third countries and international relations
Proportion of agricultural support measures
ECON10: Public authorities
Government expenditure as % of GDP? - Government investment as % of total expenditure? - Government debt as % of GDP - Budget balance as % of GDP
ECON11: The macroeconomic environment
Growth rate of real GDP per capita
SOC1: Employment and labour markets
Unemployment rate - Employment by sector
SOC2: Standards and rights related to job quality
n/a
SOC3: Social inclusion and protection of particular groups
Change in Gini coefficient - deviation of regional income from national mean - Early school leavers? - Regional cohesion?
SOC4: Equality of treatment and opportunities, nondiscrimination
Gender impact of income distribution - Ethnic impact of income distribution change
SOC5: Private and family life, personal data
n/a
SOC6: Governance, participation, good administration, access to justice and media
E-government, on-line use of ethics - Voter turnout Participation rate in community activities
SOC7: Public health and safety
Healthy life expectancy - Index of consumption of chemicals by toxicity class - Number of serious accidents at work
SOC8: Crime, terrorism and security
Self-sufficiency index for food and energy
SOC9: Access to and effects on social protection, health and educational systems. SOC9+: Tourism pressure
Number of high-season tourists in relation to local population number of tourists & residents per km2 of recreational space
SOC9++: Landscape identity
Continuity of traditional land-use pattern - Forests by category of naturalness - Settlement patterns
ENV1: Air quality
NH3 – NOX
ENV2: Water quality and resources
N surplus - P surplus - Pesticide pollution - Water abstraction rate (ground and surface)
ENV3: Soil quality and resources
Soil erosion - Soil sealing
ENV4: The climate
CO2 - CH4 - Carbon storage (biomass and soil carbon content)
ENV5: Renewable or non-renewable resources
Renewable energy consumption as % of total E.C. (CSI30) Production of renewable energy by source (IRENA27)
ENV6: Biodiversity, flora, fauna and landscapes
Proportion of habitat affected by eutrophication - Farmland & woodland birds - Deadwood volume - High-nature-value farmland? - Landscape cohesion?- Landscape diversity (IRENA35)
ENV7: Land use
% change of land cover per class per NUTS x
ENV8: Waste production / generation / recycling
Waste water & solid waste
ENV9: The likelihood or scale of environmental risks
Forest fire risk
ENV10: Mobility (transport modes) and the use of energy
Energy used by transport - Energy used for heating and electricity
ENV11:The environmental consequences of firms’ activities
n/a
ENV12: Animal and plant health, food and feed safety n/a
7
SENSOR Report Series 2007/05
Fig 1 Agricultural DPSIR model (COM 2000)
To operationalise the list of impact issues from the EU guidelines for the SENSOR project, indicators need to be selected. An indicator is e.g. organic carbon storage for the impact issues in ENV3 and ENV4. The indicator selection carried out in SENSOR (M2, M5) is shown in Table 1. SENSOR (M6) spatially identifies four area types that are particularly sensitive to significant changes in terms of key economic, social and economic issues. This identification highlights the need for careful prioritization when applying policy options. In the absence of this type of assessment, the vulnerability of these sensitive areas may be significantly increased as shown by drastic changes in important environmental, social and economic properties. In specific small-scale sensitive area case studies (SACS), SENSOR (M6, M7) will compare the impact of different options in order to validate the SIAT on the ground. These data feed into SIAT (‘Sustainability Impact Assessment Tools’) for the ex-ante evaluation of European policies referring to multifunctional land use. SENSOR (M6) looks at areas that seem specifically sensitive to changes effecting environmental, social and economic issues in specific small-scale sensitive area case studies (SACS), and compares (M6, M7) the impact of different policy options on land use. To be able to carry out impact assessment of policy options at a European level, regional assessment is essential. The EU-25+5 states tackled in SENSOR can not be handled either as one unit or as national units. The member states should be further divided at a feasible regional level. The Nomenclature of Territorial Units for Statistics (NUTS) is a geocode standard for referencing the administrative division of countries for statistical purposes. The standard was developed by the European Union, and thus only covers the member states of the EU in detail. NUTS 0 refers to the entire country; sub-divisions are not consistent in all member states.
8
SENSOR Report Series 2007/05
The NUTS 1 level refers to the next sub-division of states or group of states and NUTS 2 to NUTS 3 to regions, provinces and counties. SENSOR focuses on the NUTS 2 to NUTS 3 levels in order to spatially refer to regional scale for addressing both policy options and key issues. SENSOR Module 3 has distinguished approximately 560 NUTS x cells for the EU-25 that are based on the reference grid of EEA and the European Geo-Portal INSPIRE standards (eu-geoportal.jrc.it). Some European regions may be considered as sensitive in terms of environmental, social and economic issues (Table 1). Examples for environmental issues are ‘ENV3 soil quality’, e.g., the degradation of soil organic matter after converting peatlands in agricultural land, ‘ENV5 renewable or non-renewable energy’ with the production of renewable energy as percentage of total energy consumption and ‘ENV6 biodiversity’ referring to plants and animals both above and below ground in their spatial extent at sandy sites and peatlands. Social issues refer to ‘SOC1 employment and unemployment rate’ and ‘SOC 9++ the landscape identity’ referring to traditional land use patterns. The SOC9++ was identified (M7) and is now included in SENSOR Deliverable 2.1.2. The economic issues range from ‘ECON3 operating costs’ to ‘ECON11 the macroeconomic environment’. According to numerous economic, social and environmental problems in post-industrial zones, mountains, coasts and islands, these types were pre-defined as sensitive area types to be addressed in SENSOR (M6). An overview of the geographical location preferentially at NUTS x level and a set of representative key issues of sustainability for sensitive areas in Europe comprising intra- and cross-regional effects of policy impacts should be given here. This overview should help to select the representative SACS. In order to facilitate the profiling of European regions on the basis of common landscape and socio-economic features, SENSOR (M3) has prepared a Spatial Regional Reference Framework (SRRF) (SENSOR Report Series 2006/04 and Deliverable 3.1.3). Each class can be seen as a group of similar regions gathered closely together and this approach attempts to stratify relatively homogeneous regions (Zhou & Robson 2001; Carey et al. 2005), integrating biophysical, socio-economic and regional policy here. The SRRF combines the identified 25 physiographic primary landscape structures (PLS) and the 20 socioeconomic secondary landscape structures (SLS). However, it remains unclear whether these 30 SRRF classes indeed represent unique socioenvironmental entities of which each has a specialised set of threshold rules to be defined, and whether the parameters describing these units would allow experts to define such thresholds. This concern underlines the need to include in-depth case studies in sensitive areas in the validation of the SIAT. Similar to this Europe-wide spatial regional reference framework, potentially sensitive areas in post-industrial zones, coasts, mountains and islands in Europe should be geographically identified and then arranged into classes (categories or types) according to generalisable and specific economic, social and environmental issues. Since SENSOR is dealing with regionalised policy options and policy cases, the regions identified should be administrative areas at the regional level of governance preferably at SENSOR’s standard NUTS x level. For the identification of sensitive areas emphasis should be laid on new member states of the EU. Sensitive areas differ from regular European NUTS x cells due to socio-economic disadvantages and vulnerability of environmental resources. The SENSOR project will carry out research into sustainability issues in so-called ‘sensitive areas’, made up of Europe’s post-industrial zones, mountains, coasts and islands. This research will be carried out at two spatial resolutions. Firstly, through consultation with key experts SENSOR (M6) will carry out an extensive pan-European survey of sensitive areas to produce a generalisable list of sustainability issues for each zone. Secondly, from within these sensitive areas, representative sustainability ‘hot-spots’ have been identified for more intensive research. These ‘hot-spots’ are the object of ‘Sensitive Area Case Studies’ (SACS).
9
SENSOR Report Series 2007/05
SENSOR (M7, M6) will engage with regional and local stakeholders to produce finer resolution analyses of sustainability issues in these ‘hot-spots’. The findings of research conducted over the first 18 months of the project are presented in the deliverable report, together with some recommendations for SIAT design and the developing focus of the SENSOR project. The most serious problem encountered in this study has been to locate information at the required SENSOR NUTS x level. EUROSTAT and CORINE Land Cover data were mainly used. For scales smaller than NUTS 2 the data need to be disaggregated. The development of appropriate dis-aggregation procedures is a task of all SENSOR Modules. Finally it is important not only to refer to interactions between policy cases and environmental, social and economic issues for specific NUTS x cells, but it is also necessary to check for cross-regional effects between NUTS x cells. E.g., precipitation in mountains (ENV4 – climate) and related work on roads and river beds (ECON3 - Operating costs and conduct of business) is relevant for NUTS x cells in lowlands since it may induce more floods. Thus, policy cases to promote economic development in one cell by improving the transport system may be risky for the environment in other NUTS x cells. A beneficial crossregional effect is the coal mining in open casts in Lusatia that favours the water supply in distant cities such as Berlin.
10
SENSOR Report Series 2007/05
2 Objectives The geographic location of hot-spots and sensitive areas in the European Union and in particular in new member states, which are susceptible to policy impacts and most likely are subjected to high spatial and temporal changeability with reference to environmental, social and economic issues, should be surveyed. This overview is essential for the understanding of the vulnerability of these areas and drivers controlling land use changes as well as the regional balance of social, economic and environmental sustainability. The overview is crucial for testing the robustness and relevance of the Sustainability Impact Assessment Tools (SIAT) since it is to be expected that policy measures have a potentially stronger impact on sensitive areas than on regular European areas. Post-industrial zones, mountains, coasts and islands were focussed as sensitive area types, and steps towards the development of a methodology on the identification of key environmental, social and economic sustainability issues were surveyed according to the impact assessment guidelines of the European Commission. This overview is based on 564 NUTS x cells for EU-25+5. Data are also presented in order to link with work on the Spatial Regional Reference Framework (SENSOR Report Series 2006/04 and Deliverable 3.1.3). In addition, this research draws on the sustainability issues identified in particular sensitive areas (Deliverable 7.3.1). This overview with the classification of sensitive areas in Europe will support the selection of representative sensitive area case studies (SACS) and for the in-depth analysis at local to regional levels. The exploration and evaluation of existing data, information and expert knowledge, results from ongoing and targeted research, the generation of complementary information on social, economic, and environmental issues were gathered in an iterative way.
11
SENSOR Report Series 2007/05
3 Materials and Methods 3.1 Steps for location and key issue identification The following general protocol with 11 points for the generation of the overview of sensitive areas in Europe was developed: (1) Geographical identification of Europe’s potentially sensitive post-industrial zones, mountains, coasts and islands, preferentially at the SENSOR NUTS x spatial level (2) Literature review to identify sustainability issues and data sources, e.g. based on CORINE land cover, EUROSTAT and EEA reports, (3) Assessment of secondary data availability and the evaluation of the necessity of primary data, (4) Data collection on key issues in sensitive areas, based on the impact issues identified by the European Impact Assessment Guidelines, (5) Consultation with relevant stakeholders with regard to their view on sustainability issues in sensitive areas throughout Europe, (6) Simple web-based questionnaire to collect qualitative and (semi)quantitative assessment of key sustainability issues, (7) Statistical analysis and clustering of sensitive areas based on available indicators to create classes of post-industrial zones, mountains, coasts and islands with similar environmental, social and economic characteristics, (8) Generation and interpretation of maps with key issues of sensitive areas, (9) Drafting of four sub-surveys, and (10) Compilation of sub-surveys into a final report for the 4 sensitive areas types in SENSOR. (11) Integrated and comparative analysis of key sustainability issues across sensitive area types and against a standard, e.g. European average. 3.2 Post-industrial zones The density of industrial sites within a single NUTS x cell for EU-25 and the 2 candidate countries (Bulgaria and Romania) based on the CORINE 2000 land cover layer was used to separate post-industrial areas. Three classes of industry were separated: (1) combined industrial and commercial sites, (2) dump sites and (3) mineral extraction sites. The combined commercial and industrial site did not allow for a precise delineation of typical industrial or post-industrial zones and distinguishing between industrial and post-industrial sites. Proxy identification of post-industrial sites was extracted from CORINE land cover 2000 by using a 5 x 5 km moving window. Extraction of post-industrial areas from industrial and commercial classes was based on the assumption that historical sites were often surrounded by dump and excavation sites. In fact, industrial activities until the seventies of the 20th century generated large amounts of wastes which resulted in a relatively large number of dump sites scattered within industrial zones. Technically, each 100 x 100 m pixel of commercial/industrial class was classified as post-industrial if accompanied by at least one pixel of dump site or mineral extraction class, when being in the 5 x 5 km window. Finally, delineated post-industrial objects were combined with dump sites and mineral extraction sites into ‘post-industrial sites’ and expressed as percent of the total area of each NUTS x cell for the EU-25. NUTS x regions with at least 0.3 % coverage of the total territory were defined as post-industrial. These regions were subjected to further analysis of key sustainability issues. EUROSTAT provides data grouped into various social, economic and environmental catalogues. It provides complete data sets for about 20 independent indicators at NUTS 2/3 level. Biophysical conditions such as length of vegetation period, precipitation, and average temperatures were obtained from the Intergovernmental Panel on Climate Change (IPCC). Dump sites density was calculated for each class based on the CORINE land cover dataset from 2002 and expressed as area of these sites per class area. Density of dump sites might potentially be an indicator of pressure of former industrial or urban activities on the environment and population or to characterize development of waste management systems.
12
SENSOR Report Series 2007/05
Emission data was obtained from the European Pollutant Emission Register (EPER). The database contains facilities responsible for 90% of the emissions in Europe. The database is divided into contaminant (metals, organic compounds and gaseous compounds) and activity categories (e.g. smelting, refineries, combustions, etc.). The database is limited to EU-15 countries. Emissions generated by all facilities within a region were summed and expressed in tonnes/km2 as total metal, organic and gaseous emission from a region. Finally, a questionnaire has been developed to collect additional expert knowledge on sustainability issues in post-industrial areas. Issues addressed in this questionnaire were identified based on existing reports and EEA data, i.e. Clarinet and Caracas reports. A web based tool was prepared to conduct the survey among representatives of local and regional administrations, the research community, NGOs and industry. The employment of an ARC IMS server and a user interface will give more detailed survey results of post-industrial sites at the regional and the local level. However this information is not included in this deliverable. Cluster analysis was performed to recognize relatively homogenous groups of areas with similar environmental, socioeconomic, agricultural and geographical profile within the EU-25. Cluster analysis was performed by K-means for NUTS 2/3 EUROSTAT data for 2001 or 2002 across the EU-25. The variables to be used for cluster analysis were selected to cover key social, environmental and economic issues and ensure the distinction of various sub-areas of test areas in terms of social, environmental and economic conditions. Correlation analysis between preliminary sets of input variables was performed to exclude less important variables which were inter-correlated with key indicators. Variables used to distinguish classes were (1) Density of post-industrial sites (% of total area), (2) Length of vegetative period (days), (3) Mean precipitation in vegetative period IV-X (mm), (4) Unemployment rate (%), (5) Gross domestic product (GDP) (Euro per inhabitant), (6) Population density (inhabitants/km2), (7) Economically active population (% total population), (8) Crude birth rate (nr/1000 inhabitants), (9) Crude death rate (nr/1000 inhabitants) and (10) Employment in industry (% economically active population). Land use change analysis was based on the CORINE layer of changes obtained from EEA – this was the 2005 version of revised data characterizing land use conversions between 1990 and 2000. The CORINE land cover database provides information on land use types grouped into artificial areas, agricultural areas, forests and semi-natural areas, wetlands and water bodies which are the first level of classification, further sub-divided into two sub-levels. One-way land use transitions and net transitions between classes were considered. One-way land transition is the total transfer from one class to another without considering the reverse direction; e.g. agricultural land use into forest without return. Trend analysis was performed within the classes to assess changes in population density, GDP, natural population growth and employment structure within these homogenous areas throughout Europe. The timeframe for this analysis was depending on available statistics in EUROSTAT database. The analysis of relationships was performed using Statistica 6.0 software. Pearson’s correlation coefficients were calculated to evaluate significance of relationships between land use changes and biophysical and socioeconomic variables. Stepwise regression models were generated to find indicators which explain trends in land use transition between various land cover classes. Identification of sensitive areas was based on comparison of key socioeconomic and environmental indicators between types and EU-25 average as well as their temporal trends.
13
SENSOR Report Series 2007/05
3.3 Mountains There exist a number of definitions of mountain areas that are unanimously recognised and systematically applied and each definition highlights one or more specific aspects. Firstly, mountains are identified according to the altitude against sea level and to the principle that rough topography increases as the altitude decreases (Table 2). Table 2 Identification of European mountains according to criteria ‘altitude’ and ‘slope’ (Nordregio 2004) Class [elevation in m] > 2500 1500 - 2499 1000 - 1499 300 - 1499 local elevation range 0 - 299
Additional criteria -->2° slope within 3 km radius >5° slope within 3 km radius and/or local elevation range > 300 m within 7 km radius > 300 m within 7 km radius standard deviation > 50 m for cardinal points
The sensitivity of the mountains was classified according to UNEP criteria (Table 3) and priority areas for Structural Fund Objectives (Council Regulation 1999). This regulation aims to reduce disparities in development and promote economic and social cohesion in the EU. In this way, the effectiveness of the Community's structural assistance is improved by concentrating the assistance, and simplifying its allocation by reducing the number of priority objectives. Structural interventions of the Commission comprise expenditures for objectives 1 to 3. The 3 priorities of the Structural Funds are: (Objective 1) Promoting the development and structural adjustment of the regions whose development is lagging behind. All these regions have a number of economic signals or indicators ‘in red’. They indicate low level of investment, a higher than average unemployment rate, lack of services for businesses and individuals, poor basic infrastructure. (Objective 2) Revitalizing regions with structural difficulties, whether industrial, rural, urban or fishery-dependent. Such areas are faced with socio-economic difficulties that are often the source of high unemployment though situated in regions whose development level is close to the Community average. These include: the evolution of industrial or service sectors; a decline in traditional activities in rural areas; a crisis situation in urban areas; difficulties affecting fisheries activity. (Objective 3) Supporting the adaptation and modernization of policies and systems of education, training and employment. A summary type-classification of mountain areas can be obtained by cross-referencing natural factors with socio-economic indicators (Table 3). This type of classification seems approximate and this deliverable explores it in more detail. Table 3 Type-classification of mountains as defined by UNEP criteria for mountain areas and priority areas for Structural Fund Objectives1 Objective 1
Objective 2
Not eligible
Areas where altitude creates very difficult climatic conditions (minimum altitude between 600 and 800 m)
High mountain ranges in Spain, Certain areas High mountain ranges in the in southern Italy (including Sicily) in the Alps of Alps (Austria, Switzerland, and in Greece (including Crete), Austria, France and Italy), Andorra, Bulgaria, Montenegro, Romania Switzerland Spain and southern Italy and Norway and Italy Other mountain areas in Spain, Certain areas Areas at a lower altitu- Portugal, Corsica, southern Italy Other mountain areas in in Austria, de and/or with a steep (including Sicily), Greece, Bosnia- Austria, Switzerland, Germany, average slope (usually Herzegovina, Serbia, Macedonia, Germany, France, Italy, Switzerland, more than 20%) Romania, Poland, Czech Republic, Spain and Norway Lichtenstein Slovenia, Hungary and Norway and Italy Other areas north of the 62nd parallel and Mountain areas in northern Norway certain adjacent areas http://ec.europa.eu/regional_policy/intro/working4_en.htm 14
SENSOR Report Series 2007/05
3.4 Coasts The analysis was started based on NUTS x regions having a shoreline. In addition, those NUTS x regions, located not more than 10 km from the shoreline and having access to the sea via a river (Antwerpen, Oost-Vlaanderen, Comunidad Foral de Navarra) were included (Fig. 2).
Fig 2 NUTS x cells used for the analysis of coasts
Data and indicator values were taken for NUTS 2 level from EUROSTAT and for NUTS 3 level from national statistics. In addition, maps of CORINE Land Cover (CLC) from 1990 and 2000 were used since changes in CLC may indicate endangered regions that may partly be sensitive. CORINE Biotopes layers were also analysed. Information on environmental sensitivity of coasts of the 2 European R&D projects LACOAST and EUROSION in the 10 km strip along almost the whole coast of EU was also used. The data available at the EEA site (http://www.eea.eu.int/main_html) forms the background for analysis of changes after 1990. Human Development Indicators were used from the UNDP (http://hdr.undp.org/statistics/data/). The sensitivity analysis of coasts was done by combining indicators. Data available for NUTS x cells was used preferentially. When NUTS 3 data were not available, NUTS 2 data were considered. The indicator values were calculated for all NUTS x cells having a coastal border and maps were produced employing ArcGIS 9.1 using the ETRS89 - Lambert Azimuthal Equal Area projection. The following conflicts between different major factors were addressed during the analysis (Table 4).
15
SENSOR Report Series 2007/05
Table 4 Conflicts between sustainability issues in coasts Natural hazards
Nature conservation Development
Nature conservation
o
Development
++
++
Restoration
+
o
+
Traditional economic use
+
o
++
Restoration
+
Abbreviation: Strong ++. Intermediate +. Weak to none o.
Similarly to the post-industrial zones, clustering with k-means and Statistica 7 was used to classify environmental, social and economic issues and their combinations. To determine clusters of similar NUTS x areas two procedures of cluster analysis were provided using indicators characterising different aspects of sustainability. Cluster analysis was done with 187 NUTS x cells. Isle of Man, Gibraltar, Faroe Islands and Monaco were not included since data were not available. 3.5 Islands The starting point was the European NUTS 0 map without ‘overseas territories’. Since the Norwegian archipelago of Svalbard had not been included in the NUTS 0 map it was added to the list of EU-25+5 islands. Due to the lack of existing studies the methodological approach to identify key sustainability issues across European islands was to select a representative sample of study islands and carry out expert interviews. A set of 28 islands and archipelagos was selected for detailed investigation, based on the 1994 ‘Portrait of the Islands’ study, which, however, only covered EU-12. The states of Malta and Cyprus were included since these small island states experience island sustainability issues to an even higher degree than other islands due to lack of particularly economic support from a ‘mainland’. The set of 28 study islands was drawn up on the basis of the following criteria: (1) For each of the EU-25+2 countries that have islands, at least one major island or island group was included; (2) The major (in terms of population and size, and political importance such as a high degree of political autonomy) European islands or island groups were included (e.g. Sicily and the Aland Islands); (2) A selection of both large islands and archipelagos were included (e.g. the Balearic and the Aland Islands as well as larger islands such as Sardinia and Crete); (3) Islands from both northern and southern Europe were included, as well as those in the Atlantic, in order to ensure a balanced geographical distribution of islands. (4) Islands that are close to the mainland (such as the Tuscan archipelago), as well as ones far from the mainland (such as the Shetland Islands and Pantelleria). Experts were identified by literature and specialised networks (e.g. the UN partnerships SUSTIS, the (European) Islands Commission, the Global Islands Network and the Eurisles project). The questions concerned sustainability issues and indicators, the influence of existing or pipeline EU polices, and how the EU might best (and least) help the islands under discussion to promote sustainability. A total of 26 experts were interviewed, some representing more than one island. A list of 143 indicators was identified based on the standard SENSOR list of indicators and on expert interviews. The list was reduced to 16, on the basis of four criteria: (1) Is the indicator an M2 indicator? (2) How closely does it describe the island’ sustainability issue(s)? (3) Is data available for this indicator? (4) Does it have an accepted EEA, IRENA or other internationally recognized methodology for computation (Appendix 2)? The next step was to quantify the indicators. Major difficulties were encountered here as comparable statistics across the islands (Planistat 2002 and Eurisles 2002) were not available. It was decided to use comparable data even if the coverage of the data was smaller, rather than build up datasets from statistics of individual islands. A spatial dataset based on these sustainability indicators was developed and used to organize the set of islands into distinct geographical classes. Cluster analysis was performed by K-means and correlation analysis between input variables was performed to exclude those less important variables that were intercorrelated with key indicators.
16
SENSOR Report Series 2007/05
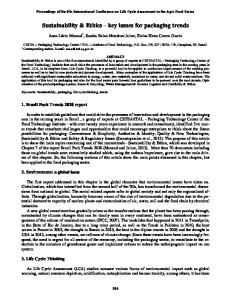
4 Results and Discussion 4.1 Post-industrial zones The post-industrial zones delineated within NUTS x was approximately 8 % of the EU-25+2 (Fig. 3). However, the density of post-industrial areas was below 0.3 % of their surface area in 306 NUTS x cells which corresponded to 65 % of the EU-25 NUTS x cells. Thus, 0.3 % was considered as a threshold leading to 167 NUTS x cells considered as post-industrial areas (Fig. 3). These cells cover 25 % of the territory of EU-25. The value of 0.3 % is consistent with studies by Oliver et al. (www.cabernet.org.uk) for brown fields in western countries at 0.2 to 0.4 %.
Fig 3
Density of post-industrial sites (delineated post-industrial plus dump and extraction sites) in NUTS x grid within Europe based on CLC 2000.
Approximately 50 % of EU-25 population lives in areas determined as post-industrial. This population may face social, economic and environmental problems related to post-industrial areas. The post-industrial NUTS x cells were separated into geographically and economically similar types based on socio-economic consistent EUROSTAT data (Table 5).
17
SENSOR Report Series 2007/05
Table 5 Overview on the 6 types of post-industrial areas within EU-25 Area type
NUTS x number
Area of EU
Description
1
31
4,50%
Eastern transitional industrial, socially and economically weak (identified as sensitive)
2
18
3,94%
Western, economically and socially strong (medium density of postindustrial sites)
3
52
7,00%
Western, economically and socially strong (high density of postindustrial sites)
4
15
4,20%
Southern, socially ad economically weak (identified as sensitive)
5
14
0,20%
Urban
6
34
5,30%
Western socially weak
Spatial distribution of the 6 types of post-industrial areas is shown on the map (Fig. 4).
Fig 4 Spatial distribution of NUTS-2/3 within 6 types of post-industrial areas
Based on the comparison of indicators 2 out of 6 types of post-industrial areas (type 1 and type 4) were classified as sensitive post-industrial areas. Type 1 (Eastern transitional industrial, socially and economically weak) covers 4.5% of total EU-25 area comprising 31 NUTS x – mostly Czech, Hungarian, and Polish and single regions from Slovakia, Lithuania and Estonia. Over 5% of total EU-25 population living in these regions meet social and economic problems. This region faces serious unemployment – the mean of the total unemployment rate was 13.7 % and 28.1 % for population under 25. The increase of unemployment was observed up to 2001 however it has been stable since that date. Population density is the lowest among all types and well below mean for non post-industrial areas. The population decreased over the last years in the region. This is the only type with a clearly negative value of mean natural population growth (-1.5/1000 inhabitants in 2002) – it has been negative since 1995. Interestingly, natural population growth decreases with the increase of employment in industry (correlation coefficient r=-0.49).
18
SENSOR Report Series 2007/05
The Mean Gross domestic product (GDP) is dramatically lower than for other types – it is equal to ¼ of the overall EU-25 mean. The relative GDP growth is relatively high – 9.5 % but the real difference (expressed in EUR) to other groups is increasing. Type 4 (Southern, socially and economically weak), besides climatic conditions, this type was delineated basically by a high unemployment rate and a low share of economically active population. This type covers 4.2 % of the total EU-25 area consisting of 15 regions located in the southern part of Europe – mostly Spanish and Greek regions and single regions from Italy, France, Portugal and Germany. Regions of this type face strong social problems. The mean total unemployment rate was in 2001 the highest of all types – 14.8%. However, it has been significantly decreasing since 1999 – the weighted unemployment rate was in 2004 significantly lower than in type 1. There is a drastic difference between unemployment rates for males and females - 10.5% and 21.7%, respectively. A serious social problem is unemployment within young generation – rate 32.6%. The share of economically active population is the lowest compared to other types. The population density is lower than the mean for EU-25 (281 vs. 371 inhabitants per square km) but it has been exponentially increasing over the last decade. This trend is partly related to the rate of natural population growth – since 1995 the weighted value is constantly above 1 with strong increase since 1999. The mean GDP (16350 EUR) is significantly lower than the mean for EU-25. Most regions within this group are within the range of 13000 to 15000 EUR/inhabitant but the groups overall mean is elevated by regions with urban agglomerations such as Madrid and Lisbon. The EU candidate countries Bulgaria and Romania were not included in the post-industrial type classification. However all post-industrial areas of these two countries were defined as sensitive as their GDP was twice lower than that of Eastern EU post-industrial units. The contribution of post-industrial sensitive areas to the 30 Spatial Regional Reference Framework units is presented in Table 10. Sensitive post-industrial areas cover all area of small SRRF-11 combining 2 Greek and Spanish NUTS x regions but also significant parts of larger clusters SRRF-02, SRRF-06, SRRF-15 and SRRF-16. Ten variables have been selected as potential indicators of sensitivity of post-industrial areas from available EUROSTAT indicators. Additional environmental indicators have been selected from the CORINE and EPER databases. These variables are presented in Table 6 as attributed to sustainability issues according to European Commission Impact Assessment Guidelines.
19
SENSOR Report Series 2007/05
Table 6 Indicators with respective impact issues in brackets for the 6 types (T) of postindustrial areas Indicator
T1
T2
T3
T4
GDP [ECON7, ECON11]
X
X
Unemployment rate [SOC1]
X
X
Unemployment under 25 [SOC1]
X
X
Female unemployment [SOC3]
T5
X
Population density decline [SOC+]
X
Negative natural population growth [SOC+]
X
X
Low share of active population [SOC1]
X No data
Metal emissions [ENV11]
No data
Organic compounds emissions [ENV11]
No data
X
X
X
Landscape biodiversity [ENV6]
X
X
Gaseous emissions [ENV1]
Dump sites density [ENV8]
T6
X X
X
X
X
It is evident that eastern post-industrial areas can be characterized as socially and economically weak, exhibiting high unemployment rates, low GDP, negative population growth and strong environmental pressures, represented by a high density of dump sites. A positive trend in this region is a fast growth of GDP, which is attracting investment and creating new jobs. Similarly, southern post-industrial areas demonstrate social instability related to ageing population, unequal opportunities for some social groups, such as women, and a serious risk of marginalisation among the younger generation, which does not have adequate access to employment. Most of the western EU post-industrial areas have successfully recovered and moved into new economic areas as shown by most of the indicators. In urban post-industrial zones, however, emission sources of pollutants seem to remain a major issue, not necessarily in terms of exceeding thresholds, but through a remarkable difference in the amount of pollutants produced relative to other areas. Land use change in post-industrial areas, and in particular agricultural land consumption is mainly driven by population density and growth, GDP and employment structure – this conversion can be satisfactorily explained within the types, by multiple regression models, accounting for the major part of the observed variability. These can be useful inputs to land use change models reflecting the behaviour of land use change drivers. Limited data exist for an in-depth assessment of sustainability and perception of key issues by stakeholders and interest groups – to fill this gap an internet based facility was established for a regional assessment of issues as well as spatially explicit survey for the assessment of specific georeferenced sites throughout the EU-25 (www.gis.iung.pulawy.pl). Results of this survey make it evident that post-industrial areas, regardless of their weaknesses, have a substantial growth potential reflected in the GDP which is higher than in the surrounding non-industrial areas and in general even much higher than that of the EU. Areas of concern for social and environmental reasons are regions in eastern and southern Europe. These require more attention and specific policies facilitating their recovery and better social and economic coherence.
20
SENSOR Report Series 2007/05
4.2 Mountains Mountains occur in almost all parts of Europe, and most of Europe’s countries have at least some mountains. They cover 1,900 thousand km2 (40.6 % of the total land area of the countries concerned) with 94.3 million people (19.1 % of the total population), (EEA 1999). Mountain Areas vary significantly throughout Europe. They can be isolated, but often stretch to huge mountain massifs over hundreds of kilometres, and provide an ecological backbone for Europe. Key issues addressed in detail in Annex 2 are (1) tourism and recreation, (2) water reservoir, (3) population out-migration and ageing, (4) natural hazards, (5) transport, (6) global change, (7) natural and cultural heritage and (8) soil degradation. The topographical delineation of mountain areas in Europe was taken from UNEP (Table 3), using a digital elevation model which records the elevation of every square kilometre of the Earth’s land surface (Table 2). Around 50 regions, home of 22 % of the population, are covered by ‘objective 1’ regions in the period 2000 to 2006 with high mountain ranges in Spain, in southern Italy (including Sicily) and in Greece (including Crete), Bulgaria, Montenegro, Romania and Norway or other mountain areas in Spain, Portugal, Corsica, southern Italy (including Sicily), Greece, Bosnia-Herzegovina, Serbia, Macedonia, Romania, Poland, Czech Republic, Slovenia, Hungary and Norway and finally mountain areas in northern Norway (Fig. 5). Characteristic for these regions are low level of investment, a higher than average unemployment rate, lack of services for businesses and individuals and a poor basic infrastructure. The Structural Funds will support the takeoff of economic activities in these regions by providing them with the basic infrastructure they lack, whilst adapting and raising the level of trained human resources and encouraging investments in businesses. For objective 1 mountain regions, sustainability issues are mainly economic. However for objective 2 regions, social and ecological issues also arise. Therefore along with the High Tatras case that is an objective 1 region, the objective 2 regions of Valais and Eisenwurzen have also been chosen as study cases. This is important because those sensitive area types considered objective 1 regions today may in future be confronted with social and environmental issues similar to those being experienced in objective 2 regions.
21
SENSOR Report Series 2007/05
Fig. 5
Sensitive mountain regions according to the type-classification by UNEP criteria for mountain areas and priority areas for Structural Fund Objectives by the European Commission
22
SENSOR Report Series 2007/05
4.3 Coasts The geographical identification of sensitive coasts lead to 187 NUTS x cells leaving out Isle of Man, Gibraltar, Faroe Islands and Monaco where most of the required data was not available. To identify high priority sensitive coasts, clustering on the basis of k-means and NUTS x cells showed high variability between 3 clustering attempts and the distinguished classes were not informative for the selection of most sensitive cells. More details are given in Annex 3. Therefore, clustering using the same k-means clustering option was made using data on NUTS 2 level. Table 7 Key sustainability indicators with average values in each class Population density [n per km²] Unemployment 2004 [%]
Class 1 Class 2
Class 3
Class 4
Class 5 Class 6
183
161
128
280
183
207
6.3
13.6
12.1
5.3
10.1
9.5
d GDP '95 to '02 [%]
44
52
59
56
76
Relative GDP in 2002 [% of EU-25]
110
77
83
142
69
GDP per inh '95 to 02 [% of EU-25]
-2.40
-2.50
6.86
9.13
6.14
-3.72
GDP per inh.
24015
15635
15072
34007
10837
22009
Agriculture in 2003 [%]
36
57
37
40
32
58
Forestry in 2003 [%]
32
18
40
25
26
18
RAMSAR sites [n per cell]
5.60
1.90
2.71
8.38
2.04
3.17
RAMSAR sites [n per km²l]
0.50
0.09
0.10
0.68
Urban population [%]
77
67
76
78
58
78
Ecologically valuable areas [%]
7.1
8.0
8.0
9.4
4.7
15.1
R&D in 2004 [mEUR]
10000
14769
8946
6320
818
40495
Coastal length [km]
968
688
679
1882
723
640
51
167
80
153
174
151
Coastline exposed to erosion [km]
0.13
31 97
0.20
The following 6 sensitive coast classes were identified (Table 7, Fig. 6): (1) economically and socially strong; the development rate is moderate but GDP is above EU-25 average; high share of urban population combined with low unemployment; high environmental awareness, (2) stable, relatively slowly developing economy with high share of agricultural activities; high share of rural population and relatively low GDP; this causes also a high rate of unemployment; environmental awareness is marginal, (3) moderately developing economy which is slightly influenced by a high unemployment rate, partly caused by a high share of urban population; GDP remains slightly below EU-25 average, (4) economically and socially very strong; high share of urban population combined with high population density; low unemployment; long coastline; well developed environmental awareness, (5) rapidly growing economy combined with relatively high but decreasing unemployment, low but increasing income; R&D investment rate low; low share of arable land and high share of rural population; in spite of moderate coastal length the highest share of coast exposed to coastal erosion; environmental protection has high variability within the classes (from 14% to 2% of area for designated areas); however, in the Baltic Sea coasts of this cluster environmental and nature protection issues are of high importance and (6) traditionally strong and stable economy with high share of agricultural activities; population density is high and most of population is living in urban areas; in spite of high living standards, high R&D expenditure is needed to avoid economical stagnation.
23
SENSOR Report Series 2007/05
Fig. 6 Clusters analysis of European coasts using economic, social and environmental indicators
Class 5 of coasts is considered as most sensitive since it seems to pose a risk for conflicts between development and nature conservation (Table 4). The most sensitive coast cells are characterised by a rapidly growing economy combined with relatively high but decreasing unemployment, low but increasing income, low R&D investment rate, low share of arable land but high share of rural population, moderate coast line length with the highest share of coast exposed to coastal erosion and highly variable environmental protection. Class 5 encompasses 23 NUTS 2 coastal areas plus 5 islands.
24
SENSOR Report Series 2007/05
4.4 Islands A total of 4,966 islands were identified, and occupying 265500 km2 or 5.6 % of the land area of EU-25+5. The Norwegian archipelago of Svalbard was added to this list. The Figures including the 150 Svalbard Islands are 5,116 European islands, occupying a land area of 328021 km2 or 6.8 % of the area of EU25+5. In terms of all the countries of Europe (including those not in the EU), islands occupy 2.7 % of the land area, or 3.3 % if Svalbard is included. Islands are found in 136 NUTS x cells, and 24 of these are entirely made up of islands. These are 25 (actually 23 islands/archipelagos since both Corsica and the Canaries are made up of two NUTS x units): Balearic Islands, Canary Islands, Gotland, Bornholm, Balearic Islands, Corsica, Aland, Bjornoya (the southern most island of the Svalbard archipelago), Channel Islands, Cyprus, Faeroe Islands, Gibraltar, Ionian, North Aegean, South Aegean, Crete, Isle of Man, Iceland, Sicily, Sardinia, Jan Mayen Islands, Malta, the Azores, and Madeira. The rest of the NUTS x units are occupied by islands to varying degrees - 63 of these NUTS x regions have less than 1% island territory; another 38 have less than 10% island territory; and 10 regions have between 11 % and 36 % island territory.
Fig. 7 Percentage Insular Cover of NUTS x regions containing islands
In terms of the Module 3 Spatial Regional Reference Framework (SRRF), a number of anomalies arise when the islands are spatially analysed by the 30 SRRF categories. A total of 12 islands or archipelagos have not been provided with an SRRF category. A total of 20 SRRF categories contain islands but some to a much greater extent – for example the Boreal categories 27 and 30 contain approximately 1,500 islands each (albeit with only 0.3 and 5.5 insular land cover respectively). The SRRF category that has the highest amount of insular land is the category for Malta, Category 14 (MEDISL). The next highest SRRF category in terms of insular land coverage is category 6 (MEDAGR). It is likely that northern and Atlantic islands do not feature strongly in these findings since many of them were not assigned SRRF categories.
25
SENSOR Report Series 2007/05
The dataset from the 26 expert interviews in the 28 study islands some experts in Greece and the UK doubled for a number of archipelagos) identified the following 12 key sustainable development issues, which reflect the island ‘backwardness’ issues identified elsewhere (Planistat 2002; Eurisles 2002): (1) Extreme population dynamics, (2) Low potential for economic diversification, (3) Negative impact of land development, (4) Marine Water Quality, (5) Water quantitative Status, (6) Waste management challenges due to small size and remoteness, (7) Tourism pressures, (8) Insularity and peripherality, (9) Declining agriculture and fisheries, (10) Degradation of natural resources and loss of biodiversity, (11) High cost and impact of energy use and (12) Low levels of education and training. On the basis of these issues, the following sustainability indicators were identified, selected through the process noted above from indicators suggested by interviewees, and SENSOR’s Module 2 indicators that relate to the EU impact issues (CEC 2005). The indicators identified for European islands are (1) Population density, (2) % of population above 65 years, (3) Employment by sector, (4) Unemployment rate, (5) GDP per capita (EURO/National currency), (6) % land built up (proxy: % urban area of total [CORINE]), (7) Compliance with Bathing Water Directive, (8) Water abstraction rate (ground and surface) (Proxy: ag. water abstraction rate [IRENA]), (9) Precipitation rate, (10) Municipal waste generation per capita, (11) Daily tourist population per square kilometre, (12) Virtual distance from centre of Europe (Eurisles study), (13) % agricultural land use change, (14) % of land covered by Natura 2000 sites (proxy: % land with protective designation), (15) Energy consumption per resident population and (16) % of researchers in relation to active population.
Fig. 8 Classes of islands based on the clustering of sustainability issues of 28 study islands
On the basis of a cluster analysis performed spatially on these variables two classes were identified: Northern Islands and Southern Islands (Fig. 8). The island state of Malta, which occupies a central position in the Southern Islands Cluster, is suggested as the SACS for the Islands sensitive area. This SACS refers additionally to NUTS 0 which facilitates data collection.
26
SENSOR Report Series 2007/05
4.5 Overview on key issues in sensitive areas EUROSTAT was the principal data source that could be used consistently for the clustering based on socio-economic data. Environmental indicators were also addressed to be consistent with the three pillars of SENSOR impact assessment referring to environmental, social and economic issues (Table 8). In-depth analysis of specific impact issues is covered in Annexes. Table 8 Impact issues (COM 2005) and indicators separating sensitive region classes Impact issue
Post-industrial
ECON1: Competitiveness, trade and investment flows
GDP
Mountains
Coasts GDP
Islands GDP
ECON2: Competition in the internal market ECON3: Operating costs and conduct of business
Energy, labour force
ECON4: Administrative costs on businesses ECON5: Property rights R&D expense
ECON6: Innovation and research ECON7: Consumers and households
GDP
GDP
GDP
GDP
GDP
GDP
ECON8: Specific regions or sectors ECON9: Third countries and international relations ECON10: Public authorities ECON11: The macroeconomic environment
Diversification in the economy
OTHER economic issues
SOC1: Employment and labour markets
Unemployment rate; Unemployment under 25; Low share of economically active population
Unemployment rate
Unemployment rate
SOC2: Standards and rights related to job quality SOC3: Social inclusion and protection of parti- Female unemcular groups ployment SOC4: Equality of treatment and opportunities, non – discrimination SOC5: Private and family life, personal data
Ageing
SOC6: Governance, participation, good administration, access to justice, media and ethics SOC7: Public health and safety SOC8: Crime terrorism and Security SOC9: Access to and effects on social protection, health and educational systems OTHER social issues
Negative natural population growth
27
SENSOR Report Series 2007/05
Impact issue ENV1: Air quality
Post-industrial Mountains Gaseous emissions
ENV2: Water quality and resources
Water storage
ENV3: Soil quality or resources
Soil erosion
Coasts
Islands
Water availability
ENV4: The Climate ENV5: Renewable or non-renewable resources ENV6: Biodiversity, flora, fauna and landscapes
Landscape Extend metrics / biodiof tourism versity
ENV7: Land use ENV8: Waste production / generation / recy- Dump sites cling density ENV9: The likelihood or scale of environmental risks ENV10: Mobility (transport modes) and the use of energy Metal emissiENV11: The environmental consequences of ons; Organic firms´ activities compounds emissions ENV12: Animal and plant health, food and feed safety OTHER environmental issues
Loss in RAMSAR natural sites; ecoloresources gically valuand biodiable sites versity Agriculture; Land use Forestry planning Waste production
Transport
Table 9 summarizes socio-economic conditions for the 4 sensitive area types with reference to EU-25. Values presented here are means characterizing an average NUTS x unit within a given type of sensitive areas. The first overview identified more than 50 % of the NUTS x cells of the EU-25 as sensitive. This was mainly because mountains and coasts came to more than 100 NUTS x regions without prioritisation. The clustering addressing only the highly active and high priority areas led to significant reduction referring to UNEP standards and rapid and most likely unsustainable changes for the mountains and coasts respectively. Sensitive areas have land use pattern differing relative to that of the EU-25. E.g. agricultural area was substantially smaller particularly in coasts and post-industrial zones with 9 % and 24 % respectively versus 52 % for the EU-25. This indicates a competition of agricultural land use with other functions. There was also a fundamental structural difference between farms operating within these sensitive areas and those of the EU-25 with smaller holdings, of the area less than 5 ha. These areas are still less populated compared to the EU-25. However for islands data may not be representative as available statistics often concern major NUTS x regions of which islands represents a minor part. On the contrary extreme population dynamics and overdevelopment in islands are observed occasionally. From the social perspective, coastal and post-industrial sensitive areas face significantly higher unemployment compared to the EU-25 average. The unemployment here particularly marginalizes females reaching 16% of the active population. Associated to high unemployment for post-industrial zones and coasts, the natural population growth was negative, also for the mountains, and substantially lower than within the EU-25. The economic performance measured by GDP per inhabitant was less than 50 % of the EU-25 in coasts and post-industrial zones.
28
SENSOR Report Series 2007/05
Table 9 Indicators in sensitive NUTS x regions with reference to mean EU-25
Area of the region (km2)
Postindustrial Mountains Coasts Islands zones 8207 6682 9086 11267 12146
Agricultural area (% of total)
52,0
23,7
34,1
8,6
30,4
Annual average population (1000 inh.)
959
1018
1103
1017
832
Population density (inh./km ) Economically active population (% of total population) Crude birth rate (births/1000inh.)
372
308
247
294
182
46
45
47
46
44
10,5
9,4
9,7
9,5
10,6
Crude death rate (deaths/1000inh.)
10,2
11,2
10,9
10,8
9,9
0,4
-1,8
-1,2
-1,3
0,6
9
14
10
13
8
8
13
8
11
6
11
16
12
16
11
87
73
79
78
84
7
11
7
13
8
Variable
EU-25
2
Natural population growth (pers./1000inh.) Total unemployment rate (% of total economically active) Unemployment rate - Males (% of males economically active) Unemployment rate - Females (% of females economically active) Total employment (% of total economically active) Employment in agriculture, hunting, forestry and fishing (% of total economically active) Employment in industry (% of total economically active) GDP (EUR/inh)
24
23
23
22
18
18627
7059
16313
8556
18132
Total number of farms
37794 56553
34129
19304
50276
Farms 50ha (% of total number)
21
5
17
0
13
The location of sensitive areas is shown in Fig 9 and a summary of their contribution to the 30 SRRF clusters in Table 10.
29
SENSOR Report Series 2007/05
Fig 9
Geographical location of sensitive areas and sensitive area case studies in Europe. In case of overlapping sensitive area types and case study, only one type (the highest layer) is shown.
Data shown in Table 10 indicate that mountain sensitive areas, relative to the total EU area, cover the largest territory with 14 %, whereas the contribution of post-industrial zones, islands and coasts was 8 %, 6 % and 6.8 % respectively. Any discrepancies in the classification of overlapping areas regarding environmental, social and economic weakness or strength will be smoothed out in the next phase by reviewing the indicators, thresholds and delineation of the areas.
30
SENSOR Report Series 2007/05
Table 10 Contribution of sensitive area types to clusters of the Spatial Regional Reference Framework SRRF Cluster area
Post-industrial
Coasts
Mountains
Islands*
[km2]
[km2]
[%]**
[km2]
[%]
[km2]
[%]
[km2]
[%]
145955
3001
2
23275
16
28900
20
-
-
SRRF#02
74107
36717
50
-
-
63377
86
-
-
SRRF#03
224858
51842
23
64784
29
29019
13
34632
15
SRRF#04
412900
28826
7
33368
8 157254
38
291 0
SRRF#05
460949
-
-
-
-
-
-
-
-
SRRF#06
76498
25728
34
-
-
28471
37
181
0
SRRF#07
13777
-
-
-
-
-
-
-
SRRF#08
182117
31138
17
65586
36 106490
58
17070
9
SRRF#09
137853
-
-
-
-
-
-
SRRF#01
-
-
SRRF#10
2120
-
-
-
-
-
-
-
-
SRRF#11
11839
11839
100
3811
32
7994
68
-
-
SRRF#12
98663
4502
5
-
-
8705
9
3133
3
SRRF#13
213601
10801
5
-
-
65735
31
-
-
SRRF#14
316
-
-
-
-
-
-
316
100
SRRF#15
499723
131558
26
47954
10
11413
2
-
-
SRRF#16
252562
63505
25
-
-
9054
4
-
-
SRRF#17
40482
4702
12
-
-
-
-
-
-
SRRF#18
193024
-
-
-
-
-
-
87
0
SRRF#19
145021
-
-
-
-
-
-
-
-
SRRF#20
110638
-
-
-
-
-
-
191
0
SRRF#21
185341
-
-
21284
11
12080
7
162
0
SRRF#22
10387
-
-
-
-
-
-
-
-
SRRF#23
26429
-
-
-
-
-
-
-
-
SRRF#24
123492
-
-
-
-
-
-
589
0
SRRF#25
154879
-
-
-
-
-
-
4977
3
SRRF#26
135499
4339
3
33079
24
-
-
5163
4
SRRF#27
623606
3910
1
3910
1
-
-
-
-
SRRF#28
58397
-
-
13612
23
-
-
-
-
SRRF#29
47238
8540
18
4812
10
-
-
-
-
2
-
- 163506
39
3042
1
8*** 315476
6 691998
14 193567
4
SRRF#30 Sum *
** ***
417553
-
5079825
420948
Azores, Canary Islands, Iceland, Faroe Islands, Channel Islands and Cyprus were classified as sensitive but not included in SRRF clusters. The full list of islands left out of the SRRF is: Balearic Islands, Canary Islands, Bjornoya (Bear Island, Norway – which is the only Svalbard island in the NUTS x map), Channel Islands, Cyprus, Faeroe Islands, Gibraltar, Isle of Man, Iceland, Jan Mayen Islands, The Azores, and Madeira. Percent of cluster area Percent of EU-25+2 plus Switzerland and Norway
31
SENSOR Report Series 2007/05
5 Conclusions 1.
2.
3.
4. 5.
6.
7. 8.
9.
Based on EUROSTAT data, which was the most consistently available across our 564 NUTS x cells for EU-25+5, and together with complementary data, it has been possible to identify sensitive post-industrial, mountain, coastal and island areas across Europe at NUTS x scale. Some dis-aggregation and aggregation procedures were used in the bottom-up approach. Key sustainability issues were also identified for these sensitive areas, and these have been consolidated into one list of sustainability issues for all EU25+5 sensitive areas. It emerges that there is a geographical divide between sensitive areas located in the southern, western and eastern EU25+5 area, which face specific environmental, social and economic problems such as low GDP, low natural population growth, high unemployment rate, small farms size and high pressure on valuable biotopes related to lobal markets and political change. Forty-six post-industrial NUTS x cells of EU-25 were classified as sensitive based on analysis of their socioeconomic and environmental profile. Eastern and southern groups of post-industrial areas were defined as sensitive. Sensitivity is mainly driven by high unemployment, low GDP and demographic indicators such as population decline or low share of active population. The sensitive mountain NUTS x cells are identified according the objective 1 of the UNEP approach. About 50 NUTS x cells were referred to as sensitive across Europe. The NUTS 2 level separated 28 sensitive coast cells which was not possible at the NUTS x scale. Main conflicts in these regions are caused by rapidly growing economy combined with relatively high but decreasing unemployment, low but increasing income, a low rate of R&D investment, and high ecological value of ecosystems under pressure. Island regions are found in 136 NUTS x units, and 24 of these are entirely made up of islands. There was a lack of statistical data on sustainability issues for European islands mainly due to the fact that they are often classified at lower than NUTS 2. Peripherality and insularity should be added to the list of impact issues as published by the EU Commission and should be taken into consideration when EU policies and instruments are developed. In total, about 31% of the area of EU-25+2 plus Switzerland and Norway can be defined as sensitive. There is a minimal overlap between 2 or more sensitive area types, not exceeding 2% of total area. Sensitive area types with reference to post-industrial zones, mountains, coasts and islands are distributed throughout a wide range of SRRF clusters which indicates that sensitive areas represent different environmental, social and economic profiles and the pre-selection of one area type affected the identified classes. In depth analysis in these areas will be explored in 7 SACS. Our study showed unique pattern of socio-economic and environmental characteristics in the sensitive area types, which differed from regular European areas. Thus, the land use will change differently in response to policies and SIAT should be tested within sensitive areas to assess its robustness in sensitive areas which cover a substantial portion of the European territory.
32
SENSOR Report Series 2007/05
6 Perspectives The objective of this deliverable was the identification of (i) the location of sensitive areas in Europe and (ii) the identification of a set of representative key issues and (iii) to provide a solid information base within the SIAT. The sensitive areas cover a range of nationalities, languages, cultures, governance systems, refer to a list of environmental, social and economical issues and contrast in natural environmental conditions from North to South and East to West. More detailed knowledge on specific structures and problems of the different areas is generally needed. Earlier overviews on environmental, social and economic issues were drawn at national regulations or EU criterions. Regional demands e.g. of the population were not necessarily taken into account. The SIAT attempts a more inclusive approach to include regional perspectives and identifies an urgent demand for interactive communication with the stakeholders, policy makers and the scientific community on a regional and inter- and supra-regional level. These analyses will be carried out in more detail in sensitive area case studies recognised (SACS). The SACS for islands is extraordinary since Malta has very extreme conditions and produced its own SRRF cluster 14 (compare SENSOR Deliverable 3.1.3). The information contained herein will identify areas according to location (longitude and latitude) and will indicate priority areas (i) to be used for testing the SIAT and (ii) to check thoroughly different scenario outputs on the basis of the available data basis within the SIAT. Based on this overview we recommend to select 7 SACS with priority to their location in new member states but to consider also some in older member states since SACS in new member states may be confronted with similar problems as SACS in older member states some years ago; ‘we should learn from the experience in the application and evaluation of policy options’. ‘Silesia’ vs. ‘Lusatia’ were selected as SACS for post-industrial zones, ‘High Tatras’ vs. ‘Eisenwurzen’ and ‘Valais’ for mountains, ‘Estonia for coasts’ and ‘Malta’ for islands. The work in these areas represents a participatory multi-criteria evaluation which should help to explicitly account for the often widely varying environmental, social and economic impacts of policy measures (Madlener and Stagl 2005).
33
SENSOR Report Series 2007/05
7 References Council Regulation (1999) EC No 1260/99 of 21 June 1999 laying down general provisions on the Structural Funds. http://europa.eu/scadplus/leg/en/lvb/l60014.htm COM (2000) Indicators for the integration of environmental concerns into the common agricultural policy, 20 final (Brussels), 26 pages COM (2005) Impact assessment guidelines. SEC 791 (Brussels), 48 pages Carey PD, Preston CD, Hill MO, Usher MB, Wright SM (1995) An environmentally defined biogeographical zonation of Scotland designed to reflect species distributions. Journal of Ecology 83, 833-845. EEA (1999) Environment in the European Union at the turn of the century. Environmental Assessment Report 2, Official Publications of the European Communities, Luxembourg Eurisles (2002) Off the Coast of Europe: European construction and the problem of the islands. Study undertaken by Eurisles on the initiative of the Islands Commission of CPMR, (Conference of the Peripheral and Maritime Regions), available at www.eurisles.org. Madlener R, Stagl S, (2005) Sustainability-guided promotion of renewable electricity generation. Ecological Economics 53, 147-167 Planistat Europe (2002) Analyse des régions insulaires de l’Union européenne (Survey of insular regions of the EU). Interreg project, DG Regio Zhou Q, Roson M (2001) Automated rangeland vegetation cover and density estimation using ground digital images and the spectral-contextual classifier. International Journal of Remote Sensing 22, 3457-3470. Detailed references are in the Annexes.
34
Main partners involved in this publications are: The Brandenburg University of Technology Cottbus, DE The Swiss Federal Insistute of Forest, Snow and Landscape Research, CH The Institute of Landscape Ecology ILE-SAS, SK The Institute of Soil Science and of Forest Growth Research, AT The University Tartu, EE The Plan Making and Policy Development Unit MEPA, MA The Institute of Soil Science and Plant Cultivation, PL This report was edited by the Leibniz-Centre for Agricultural Landscape Research Contact:
[email protected]