Supply & Demand Concepts (Powerpoint Notes) Glencoe Economics – Today and Tomorrow Textbook Readings • Chapter 7 – pp. 169-199 Supply & Demand Notes Market • Any place where individuals can buy and sell goods. • Where a buyers and sellers meet. o at home o by telephone o in a store o by mail (online) • Market Economies decisions are based on actions of buyers and sellers. • Market Economies will produce anything that people are willing and able to buy and that will bring a profit to the sellers. • All markets have some common economic principles. • Markets play a role in setting a price. Price • • • • • •
Price is one indication of the scarcity of an item. If something is really short in supply, meaning that a lot of people want it – the price will be high. Price can act as both an ENCOURAGEMENT or a DISCOURAGEMENT. Price is an obstacle. The higher the obstacle, the less of the product that will be bought. “Sales” at stores is evidence of this.
Demand • Is the amount or quantity of goods and services consumers are willing and able to buy at various prices. (Buyers-side of the market) • Generally, the higher the price the less consumers will by of an item, AND the lower the price, the more consumers will buy. • LAW OF DEMAND • Consumers will generally buy less of an item at a high price than at a lower price. • Consumption is subject to DIMINISHING MARGINAL UTILITY; less satisfaction; successive units yield less satisfaction unless price is reduced. • Income effect, lower price increases purchasing power. • DEMAND SCHEDULE Price $1.50 $1.80 $2.50 $4.70 $8.00
• •
Jars of Peanut Butter Per Month 5 4 3 2 1
Draw demand curve w/ the horizontal axis labeled as quantity, and the vertical axis as price. Change in Demand • The demand curve actually shifts; moves to the left or to the right. Change in Quantity Demanded • Movement along the demand curve. Change in price results in a change in quantity.
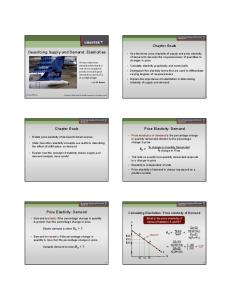
Price Elasticity of Demand • Elasticity – amount of change in quantity is greater than change in price. ΔQ > ΔP • Inelasticity – amount of change in quantity is less than change in price. ΔQ < ΔP • Draw three graphs w/ demand curves across the board at different angles to illustrate how a price change effects the quantity demanded in each graph. • Perfectly Elastic o more horizontal; perfectly horizontal for it to be perfectly elastic. o at one price individuals will buy as much as they can o characteristics: many substitutes expensive (requires higher percentage of budget) luxury items • Perfectly Inelastic o graph tends to be more vertical. o The change in price has NO effect on change in quantity. o characteristics Few substitutes if any Inexpensive (requires small percentage of income) necessity – must buy now o Examples – established smokers and insulin. Table Salt
Ice Cream
Sports Car
Gasoline
Insulin
Braces on Teeth
Are there good substitutes? NO YES YES NO NO NO yes = elastic no = inelastic What proportion of income SMALL SMALL LARGE SMALL SMALL LARGE does it use? yes = elastic no = inelastic Is it a necessity or a luxury? NECESSSITY LUXURY LUXURY NECESSITY NECESSITY LUXURY yes = elastic no = inelastic Conclusion INELASTIC ELASTIC ELASTIC INELASTIC INELASTIC ELASTIC
Determinants of Demand 1. Expectations (Tastes & Preferences) 2. Income 3. Substitutes and Complements 4. Population (Number of Buyers) • These are often referred to price shifters. Expectations • Tastes and Preferences • Change in styles, tastes, and habits • Diminishing Marginal Utility • Utility refers to the usefulness or satisfaction of something. • In any specific time period, each buyer of a product will derive less satisfaction from each successive unit of the good consumed. • Yielding less and less satisfaction, consumers will only buy additional units if the price is reduced. Income (Y) • Desire must be backed up by the ability to pay. • Increases in income allows people to purchase more of some commodities. • Commodities (steaks, sunscreen, stereos, etc.) whose demand varies directly with income are called normal goods. Substitutes & Compliments • A substitute good is one that can be used in place of another good. o Ex. Nikes & Reeboks, sweaters & jackets, Toyotas & Hondas, Coke & Pepsi • A complimentary good is one used together with another good. o Ex. Ham & Eggs, tuition & textbooks, movies & popcorn, cameras & film, TVs & VCRs, CDs & CD player Population (Number of Buyers) • An increase in the number of consumers in a market increases demand. • A decrease in the number of consumers in a market decreases demand. Supply • The amount or quantity of goods and services that producers will provide at various prices. (Sellersside of the market) • Producers must receive a price for their goods and services that will cover their costs and provide a profit in order to stay in business. • LAW OF SUPPLY • The higher the price, the more producers will supply; the lower the price, the less they will supply. • Change in Supply • The supply curve actually shifts; moves to the left or to the right. • Change in Quantity Supplied • Movement along the supply curve. Change in price results in a change in quantity.
Determinants of Demand 1. Technology 2. Price of Inputs 3. Taxes & Subsidies 4. Price of Related Goods 5. Number of Sellers Technology • Normally advancement in technology will cause costs to fall. • With advancement in technology supply curve will move to the right reducing price and increasing quantity. Price of Inputs • Cost of land, labor, and capital resources. • Price of inputs increase, supply decreases (moves to left) • Price of inputs decrease, supply increases (moves to right) Taxes & Subsidies • Decrease in taxes results in a decrease in costs of production, thus supply increases • Increase in taxes results in an increase in costs of production, thus supply decreases • Subsidy – paying someone to do something; payments from the government • If there is a subsidy, the government is giving you money to produce, so supply moves to the right and increases. The result, greater quantity at a lower price. o Government approach is that if you want more of something, subsidize; if you want less of something, then tax it. Price of Related Goods • Is there an opportunity cost to production. • Work on the assumption that the manufacturer can producer either Good A or Good B. If the manufacturer sees that they can get a higher price for Good A, then they produce more of Good A by moving along the supply curve. The result of this will be that the supply curve for Good B will decrease – move to the left because the manufacturer will take resources allocated to Good A and transfer them to Good B. Number of Sellers • If the number of sellers increases, then the supply will increase. • If the number of sellers decreases, then the supply will decrease. Equilibrium • The point where supply and demand meet; the amount of a product supplied equals the amount demanded. Also known as the market-clearing price. • Results in equilibrium price and equilibrium quantity. Price • The amount of money given or asked for when goods or services are bought or sold.
Surplus • An oversupply of goods or services that occurs when supply is greater than demand. • Price Floor – a government or group-imposed limit on how low a price can be charged for a product. o Price is set above equilibrium price. Example is minimum wage.
Shortage • An undersupply of an item at a particular price. • Price Ceiling – a government-imposed limit on the price charged for a product. Intended to protect consumers from conditions that could make necessary commodities unattainable. Problem is it takes away incentive produce and sell at the imposed price. End result can be a shortage and the creation of an underground economy. Example is rent control.