Study on The Efficacy of Nitrogen Utilization by Rice Genotypes Part 1: Clustering and Selection for Rice Genotypes Darjanto1), Didik Indradewa2), Bostang Radjagukguk2), and Taryono2) 1)
Agrotecnology Study Program, Faculty of Agriculture Unsoed, Indonesia Jl. dr. Soeparno Purwokerto 2) Faculty of Agriculture UGM, Indonesia Email:
[email protected]
Diterima Januari 2011 disetujui untuk diterbitkan Mei 2011
Abstract This experiment was carried out in a greenhouse as, the first part of four consecutive experiments. Sixty rice genotypes comprising 30 national and 30 local genotypes were evaluated for their responses and efficacy to nitrogen (N, urea) fertilizer application. Two levels of N fertilizer, i.e., 0 (N1) and 120 (N2) kg of N per hectare were applied. Randomized Block Design (RBD) with three replications was used as the experimental design. The observed parameters were grain yield per pot and grain yield index (GI). Based on average of grain yield of N1, average of grain yield of N2, and grain yield index (GI), the 60 evaluated genotypes were classified into four clusters. These clusters consisted of 26 efficient and responsive (ER) genotypes, 7 efficient and non-responsive (ENR) genotypes, 6 non-efficient and responsive (NER) genotypes, and non-efficient and non-responsive (NENR) genotypes. Replacement of cultivars in rice cultivation, from non efficient (NE)-genotype to efficient (E)-genotype has a potential of yield increase of 90.83%, replacement of non-responsive (NR) with responsive (R) genotype has a potential yield increase of 59.57%, replacement of local genotypes with national genotypes has a potential to increase yield 8.66% only. Of the 26 ERs, genotypes with the highest efficiency were Singkil, IR-66, Indragiri, Sintanur, and Widas. Genotypes with the highest response were Ciliwung, IR-66, Ciherang, Sintanur, and Cisadane. These genotypes can be used to increase rice production, to reduce production costs and to reduce environmental pollution. The ER, ENR and NER genotypes can be used as parents in breeding for high yielding and N efficient rice genotypes. Key words: rice genotypes, efficacy, response, nitrogen nutrition
Abstrak Penelitian ini dilakukan di rumah kaca sebagai bagian pertama dari empat percobaan berturutturut. Enam puluh genotipe padi terdiri dari 30 genotipe nasional dan 30 genotipe lokal dievaluasi untuk respon mereka dan kemanjuran dengan Nitrogen (N, urea) aplikasi pupuk. Dua tingkat pemupukan N, yaitu 0 (N1) dan 120 (N2) kg N per hektar diberikan. Rancangan Acak Kelompok (RAK) dengan tiga ulangan digunakan sebagai rancangan eksperimental. Parameter yang diamati adalah hasil gabah per pot dan biji-bijian hasil indeks (GI). Berdasarkan rata-rata hasil gabah dari N1, rata-rata hasil gabah dari N2, dan biji-bijian hasil indeks (GI), dengan 60 genotipe dievaluasi diklasifikasikan ke dalam empat cluster. Kelompok ini terdiri dari 26 efisien dan responsif (ER) genotipe, 7 efisien dan tidak responsif (ENR) genotipe, 6 non-efisien dan responsif (APM) genotipe, dan non-efisien dan tidak responsif (NENR) genotipe. Penggantian kultivar dalam budidaya padi, dari non efisien genotipe-(TL) untuk efisien genotipe-(e) memiliki potensi peningkatan hasil dari 90,83%, penggantian non-responsif (NR) dengan responsif (R) genotipe memiliki potensi hasil peningkatan 59,57%, penggantian lokal genotipe dengan genotipe nasional memiliki potensi untuk meningkatkan hasil 8,66% saja. Dari 26 ERs, genotipe dengan efisiensi tertinggi adalah Singkil, IR-66, Indragiri, Sintanur, dan Widas. Genotipe dengan respon tertinggi adalah Ciliwung, IR-66, Ciherang, Sintanur, dan Cisadane. Genotip ini dapat digunakan untuk meningkatkan produksi beras, untuk mengurangi biaya produksi dan mengurangi pencemaran lingkungan. Genotipe ER, ENR dan APM dapat digunakan sebagai tetua dalam pemuliaan untuk menghasilkan tinggi dan N genotipe padi efisien. Kata kunci: padi, genotipe, khasiat, respon, nutrisi, nitrogen
Introduction Effort to increase rice production is absolutely necessary if Indonesia does not want to continue to be a rice importing country, or if Indonesia wants to be rice
exporting country. The main input in the process of rice production is Nitrogen (N)Urea (CONH2)2 fertilizer. However, many studies have shown that N fertilizer efficiency is only 20-40%, while a large number of the
Darjanto dkk., Studi on The Efficacy of Nitrogen Utilization by Rice Genotypes Part 1 : 62-69
rest (60-80%) is lost to the environment. This is not only wasting but also results in environmental pollution. While the easiest and cheapest solution of such problem is planting high yielding rice genotypes that are efficient nutrient N, such genotypes are not available. Therefore, clustering and selection for rice genotypes efficient in N utilization, and studies of N nutrient in the rice fields are important preliminary efforts for development of superior genotypes with high yielding potential and efficient nutrient N. Efforts to increase utilization efficiency of N fertilizer have been done through management of soil, fertilizer and rice cultivation system, but efforts through manipulation of plant traits have not been done because N efficient rice properties have not been much studied. The later, according to Peng and Senadhira (2000), was because people have assumed that low efficiency in N absorption is a problem of soil N deficiency that can simply be solved by N fertilizer application. In Indonesia, there are rice germplasm with various levels of nutrient efficiency. From the available rice germplasm, clustering and selection can be carried out to obtain genotype that has high yielding potential, efficient in N utilization, and responsive to N fertilizer. Genotypes with such characteristics can be used for minimizing the use of inorganic N fertilizer, for cultivation of rice field with depleted N, to reduce the effect of N pollution to the environment, and to be used as parental genotypes in breeding for high yielding and N efficient rice cultivars. Realizing N as a limiting factor in rice production, cultivation of N-efficient rice cultivars is inevitable to cope with higher price of N fertilizer and increasingly limited supply of N fertilizer in the market. This corresponds to Shenoy et al. (2001) that the efficiency of nutrient N absorption from soil and N utilization efficiency in rice plants is a major potential in increasing rice yield. Increased efficiency will reduce N fertilizer needs. Ray et al. (2003) also noted that efforts to maximize photosynthetic carbon fixation, growth rate, and high production capabilities in low N input conditions are very relevant in the economic development of rice cultivation. According to Good et al. (2004), crop experts have long claimed the necessary development of plant genotypes
63
that can absorb and use nutrients more efficiently. Cassaman et al. (1998) predicted that consumption of urea fertilizer for rice crop in 2025 will reach 20 million tons for 70 million hectares of land area with only fertilizer uptake efficiency of 33%. This means that 67% of the cost of fertilizer will be lost uselessly and result in greater environmental pollution. Eagle et al. (2000) noted that reduction in N fertilizer loss will increase the efficiency of N fertilizer utilization and decrease the cost for saving the environment from pollution caused by N fertilizer application in rice cultivation. Today the world spends more than 45 billion U.S. dollars every year to produce N fertilizer (Ladha and Reddy, 2003). Increased N utilization efficiency of 1% on cereal crops would mean a saving of 234,658,462 U.S. dollars, and increased efficiency of 20% can save 4.7 billion dollars per year (Round and Johnson, 1999).
Materials and Methods This study was a part of serial studies conducted since the beginning of 2007 until the end of 2009. The study was conducted in a greenhouse at the Faculty of Agriculture, Jenderal Soedirman University, Purwokerto. Growth media were coastal regosol soil, that based on soil analysis, is deficient in N. The experimental factors were level of N-urea fertilizers and rice genotypes. The N levels were 0 kg N / ha (N1) and 120 kg N / ha or 1.2 g urea / pot (N2). The rice genotypes included 30 national superior genotypes and 30 local genotypes. Most seeds of these genotypes were kindly provided by Rice Research Institute at Sukamandi, West Java, and partly by local farmers of Central Java, Indonesia. Approximately 8.48 kg of ground and 5-mm-sieved air-dried soil (a weight of 20x20x20 cm3 volume of regosol soil) was used to prepare growth media. This soil was put into a 10 kg capacity pot. Soil mudding in pots was performed seven days before seedling transplant. TSP and KCl fertilizers were applied to the mudded soil just before planting, with a rate of 60 kg / ha or equals to 0.24 g / pot for TSP, and 100 kg / ha or equals to 0.4 g / pot for KCl. Three twenty-one day old seedlings were transplanted into a pot. Each experimental unit consisted of two pots.
64
Biosfera 29 (1) Mei 2011
Flooding was maintained as high as 10 cm above the mud surface up to 7 days before harvest. N fertilizer was applied gradually and equally in three consecutive times, i.e.: at the time of transplant, 25 days after transplant, and at flower primordial. Harvesting was carried out at physiological maturity. Grain yield per hill was measured at 14% moisture content. The experimental design was Randomized Block Design (RBD) with three replications. Based on filled-grain weight per hill, grain yield index (GI) was calculated following Fageria and Baligar (1993), where GI = (Grain yield under optimal condition with N fertilizer - Grain yield under condition without N fertilizer) : (Optimal level of N fertilizer – 0 kg of N fertilizer) kg -1. Based on average grain yield without fertilizer, average grain yield with fertilizer, and GI value, all the tested genotypes are grouped into four categories, namely efficient and responsive genotype (ER), efficient but non-responsive genotype (ENR), non-efficient but responsive genotype (NER), and nonefficient and non-responsive genotype (NENR).
Results and Discussion Nutrient-efficient genotypes are reflected by its ability to provide high yield in limited circumstances of one or more nutrients (Marschner, 1995). In rice, efficient plants are capable of producing high grain by using least fertilizer (De Datta and Broadbent, 1988). Blair (1993), and Fageria and Baligar (1993) have grouped plants into 4 classes based their responses to a nutrient availability. The four classes include: (i) Efficient and responsive (ER) - a group of plants capable of producing high product at a low level of nutrients and responsive to increased levels of nutrients, (ii) Efficient but non-responsive (ENR) - a group of plants that is able to produce high at low nutrient levels but not responsive to increased levels of nutrients, (iii) Non-efficient but responsive (NER) - a group of plants which produce low in low nutrient level but responsive to increased levels of nutrients, and (iv) nonefficient and non-responsive (NENR) - a group of plants which produce low in low nutrient levels and not responsive to increased levels of nutrients. The results of clustering of all
evaluated rice genotypes are listed in Table 1 and Table 2. Levels of N efficiency level and N response varied among genotypes, and also between national superior genotypes and local genotypes. ER national genotypes comprised of 25.0%, local ER 18.3%, ENR national genotypes 10.0%, local ENR 1.7%, NER national genotypes 5.0%, local NER 3.3 %, NENR national genotypes 8.3%, local NENR 26.7%. Genotypes that fall into ER class were mostly national genotypes, while those classified into NENR are mostly local genotypes (Table 2). The above results proved that Indonesian rice germplasm has all classes of N efficient/responsive rice as grouped by Blair (1993) and Fageria and Baligar (1993). Baligar and Fageria (1997) reported that there are differences in the nature of response to environmental factors within and between species, including the response to changes in the N level. As with N nutrient, Karno (2009) in a study of P utilization efficiency in rice plants using red yellow podzolic soil also obtained four categories of efficiency/responsiveness to P. Phosphor efficient and responsive genotypes represented by IR-64, P responsive but nonefficient represented by Silugonggo, inefficient and responsive to P was represented by Leah, inefficient and nonresponsive to P was represented by Mount David. Shi et al. (2010) found that the rate of absorption of ammonium N-efficient rice cultivars was much higher than the cultivars that are non-efficient, the absorption of nitrate N-inefficient cultivars is greater than the efficient cultivars. Table 2 presents genotypes with the highest efficiency and genotypes with the highest response to N. Genotypes that efficient in N nutrient such as Singkil, IR-66, Indragiri, Sintanur, Widas, Tukad Belian, and the rest can be cultivated in N depleted rice field, or can be suggested to be grown by farmers with lower capability to afford N fertilizer cost. Nitrogen responsive genotypes such as Ciliwung, IR-66, Ciherang, Sintanur, Cisadane, Barry, Ranggong, Digul and others can be cultivated in N-rich rice field, or suggested to wealthier farmer who can cope with N fertilizer cost. Clustering rice genotypes based on their efficiencies and responsiveness to N are useful for selection of genotypes to be used as parents in
Darjanto dkk., Studi on The Efficacy of Nitrogen Utilization by Rice Genotypes Part 1 : 62-69
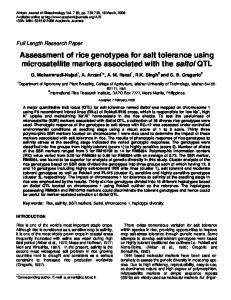
development of high yielding genotypes with better efficiency in N utilization and responsive to N fertilizer application. Figure 1 illustrates the differences in efficiencies and responsiveness to N fertilizer application of eight genotypes with regard to their grain yield. Each of national
65
(Nt) and local (Lc) genotypes represents a certain grouping category. These eight genotypes were Ciliwung (ER-Nt), Barry (ER-Lc), Ciapus (ENR-Nt), Solo (ENR-Lc), IR-42 (NER-Nt), Arias B (NER-Lc), Tukad Petanu (NENR-Nt), and Dusel (NENR-Lc).
Table 1. Genotype clustering based on responsiveness to N fertilizer. No. 1
Genotype
Grain yield N1 & criteria Weight (g)
E or NE
Increased yield (ΔY in g)
Grain yield index (GI) & criteria GI (Kg / Kg)
R or NR
Criteria of efficancy and responsiveness NENR
Dusel Bengawan Solo
1.10
NE
11.30
23.54
NR
2
1.40
NE
19.90
41.46
R
NER
3
Lems
1.40
NE
10.23
21.31
NR
NENR
4
Padi Halus
1.60
NE
4.97
10.35
NR
NENR
5
Bawi
1.67
NE
6.60
13.75
NR
NENR
6
Banda
1.73
NE
12.37
25.77
NR
NENR
7
Tokong
1.73
NE
10.24
21.33
NR
NENR
8
Mayor
1.90
NE
12.47
25.98
NR
NENR
9
Rojo Lele
1.90
NE
14.87
30.98
NR
NENR
10 Tukad Petanu 11 IR 42
1.93
NE
11.74
24.46
NR
NENR
2.00
NE
23.77
49.52
R
NER
12 Omas 13 Baluyan
2.03
NE
11.74
24.46
NR
NENR
2.10
NE
11.60
24.17
NR
NENR
14 Sirantau 15 Diah Suci
2.20
NE
13.30
27.71
NR
NENR
2.20
NE
10.50
21.88
NR
NENR
16 Gilirang 17 Luk Ulo
2.23
NE
14.30
29.79
NR
NENR
2.23
NE
16.74
34.88
NR
NENR
18 Cisanggarung 19 Cibogo
2.30
NE
17.00
35.42
NR
NENR
2.33
NE
21.27
44.31
R
NER
20 Brandi 21 Satelika
2.37
NE
14.16
29.50
NR
NENR
2.37
NE
14.00
29.17
NR
NENR
22 Silanting 23 Asemmandi
2.40
NE
14.70
30.63
NR
NENR
2.40
NE
15.07
31.40
NR
NENR
24 Batanghari 25 Arias B
2.47
NE
21.43
44.65
R
NER
2.60
NE
21.07
43.90
R
NER
26 Utari 27 Hawarabunar
2.60
NE
14.37
29.94
NR
NENR
2.67
NE
19.86
41.38
R
NER
28 Anak Daro 29 Luwung
2.83
E
19.57
40.77
R
ER
2.83
E
20.74
43.21
R
ER
30 Cisadane 31 Aromatik Palu
2.93
E
22.17
46.19
R
ER
3.03
E
20.64
43.00
R
ER
32 Lumbuk 33 Basmati
3.07
E
18.26
38.04
R
ER
3.07
E
19.83
41.31
R
ER
34 Solo 35 Gundil Tambunan
3.07
E
17.13
35.69
NR
ENR
3.07
E
18.50
38.54
R
ER
36 Fatmawati 37 Menthik Wangi 38 Genjah Anak
3.10
E
11.40
23.75
NR
ENR
3.13
E
18.50
38.54
R
ER
3.20
E
18.47
38.48
R
ER
39 Banjar Kuning 40 IR-36
3.20
E
19.63
40.90
R
ER
3.30
E
18.87
39.31
R
ER
41 Digul 42 Cihujung
3.37
E
21.36
44.50
R
ER
3.43
E
18.37
38.27
R
ER
43 Cimelati 44 Ranggong
3.53
E
19.14
39.88
R
ER
3.63
E
21.90
45.63
R
ER
45 Mayangsari 46 Cipunegara
3.67
E
22.06
45.96
R
ER
3.67
E
14.76
30.75
NR
ENR
47 IR-64 48 Angke
3.67
E
21.16
44.08
R
ER
3.73
E
18.44
38.42
R
ER
49 Ciliwung
3.73
E
30.00
62.50
R
ER
50 Membramo 51 Ciherang 52 Batanggadis
3.80
E
16.90
35.21
NR
ENR
3.87
E
25.63
53.40
R
ER
3.87
E
11.76
24.50
NR
ENR
66
Biosfera 29 (1) Mei 2011
Weight (g)
E or NE
Increased yield (ΔY in g)
53 Mekongga 54 Tukad Belian
3.93
E
4.00
E
55 Ciapus 56 Widas
4.13
57 IR-66 58 Indragiri
GI (Kg / Kg)
R or NR
Criteria of efficancy and responsiveness
15.84
33.00
NR
ENR
20.47
42.65
R
ER
E
17.70
36.88
NR
ENR
4.30
E
20.07
41.81
R
ER
4.33
E
26.80
55.83
R
ER
4.33
E
21.27
44.31
R
ER
59 Sintanur
4.33
E
22.57
47.02
R
ER
60 Singkil
4.37
E
21.20
44.17
R
ER
No.
Genotype
Grain yield N1 & criteria
Grain yield index (GI) & criteria
Description: E = Efficient, R = Responsive, NE = Non Efficient, NR = Non Responsive Table 2. Genotypes of ER (efficient and responsive), ENR (efficient non-responsive), NER (nonefficient and responsive) and NENR (non-efficient and non-responsive) The order of the level of efficiency
Criteria
Level of efficacy
ER (Efficient and responsive)
ENR (Efficient and nonresponsive)
Genotype
The order of the level of responsiveness Nt or Lc
Level of responsivity
Genotype
Nt or Lc
1
4.37
Singkil
Nt
62.5
Ciliwung
Nt
2
4.33
IR-66
Nt
55.83
IR-66
Nt
3
4.33
Indragiri
Nt
53.4
Ciherang
Nt
4
4.33
Sintanur
Nt
47.02
Sintanur
Nt
5
4.3
Widas
Nt
46.19
Cisadane
Nt
6
4.0
Tukad Belian
Nt
45.96
Mayangsari
Lc
7
3.87
Ciherang
Nt
45.63
Ranggong
Lc
8
3.73
Angke
Nt
44.5
Digul
Nt
9
3.73
Ciliwung
Nt
44.31
Indragiri
Nt
10
3.67
Mayangsari
Lc
44.17
Singkil
Nt
11
3.67
IR-64
Nt
44.08
IR-64
Nt
12
3.63
Ranggong
Lc
43.21
Luwung
Lc
13
3.53
Cimelati
Nt
43.0
Aromatik Palu
Lc
14
3.43
Cihujung
Nt
42.65
Tukad Belian
Nt
15
3.37
Digul
Nt
41.81
Widas
Nt
16
3.3
IR-36
Nt
41.31
Basmati
Lc
17
3.2
Genjah Anak
Lc
40.9
Banjar Kuning
Lc
18
3.2
Banjar Kuning
Lc
40.77
Anak Daro
Lc
19
3.13
Menthik Wangi
Lc
39.88
Cimelati
Nt
20
3.07
Lumbuk
Lc
39.31
IR-36
Nt
21
3.07
Basmati
Lc
38.54
Gundil Tambunan Lc
22
3.07
Gundil Tambunan Lc
38.54
Menthik Wangi
Lc
23
3.03
Aromatik Palu
Lc
38.48
Genjah Anak
Lc
24
2.93
Cisadane
Nt
38.42
Angke
Nt
25
2.83
Anak Daro
Lc
38.27
Cihujung
Nt
26
2.83
Luwung
Lc
38.04
Lumbuk
Lc
1
4.13
Ciapus
Nt
36.88
Ciapus
Nt
2
3.93
Mekongga
Nt
35.69
Solo
Lc
3
3.87
Batanggadis
Nt
35.21
Membramo
Nt
4
3.8
Membramo
Nt
33.0
Mekongga
Nt
5
3.67
Cipunegara
Nt
30.75
Cipunegara
Nt
6
3.1
Fatmawati
Nt
24.5
Batanggadis
Nt
7
3.07
Solo
Lc
23.75
Fatmawati
Nt
67
Darjanto dkk., Studi on The Efficacy of Nitrogen Utilization by Rice Genotypes Part 1 : 62-69
The order of the level of efficiency
Criteria
Level of efficacy
NER (Non-efficient and responsive)
NENR (Non-efficient and nonresponsive)
1
2.67
Genotype
The order of the level of responsiveness Nt or Lc
Level of responsivity
Genotype
Nt or Lc
Hawarabunar
Lc
49.52
IR-42
Nt
44.65
Batanghari
Nt
2
2.6
Arias B
Lc
3
2.47
Batanghari
Nt
44.31
Cibogo
Nt
4
2.33
Cibogo
Nt
43.9
Arias B
Lc
5
2.0
IR 42
Nt
41.46
Bengawan Solo
Nt
6
1.4
Bengawan Solo
Nt
41.38
Hawarabunar
Lc
1
2.6
Utari
Lc
35.42
Cisanggarung
Nt
2
2.4
Silanting
Lc
34.88
Luk Ulo
Nt
3
2.4
Asemmandi
Lc
31.4
Asemmandi
Lc
4
2.37
Brandi
Lc
30.98
Rojo Lele
Lc
5
2.37
Satelika
Lc
30.63
Silanting
Lc
6
2.3
Cisanggarung
Nt
29.94
Utari
Lc
7
2.23
Gilirang
Nt
29.79
Gilirang
Nt
8
2.23
Luk Ulo
Nt
29.5
Brandi
Lc
9
2.2
Sirantau
Lc
29.17
Satelika
Lc
10
2.2
Diah Suci
Nt
27.71
Sirantau
Lc
11
2.1
Baluyan
Lc
25.98
Mayor
Lc
12
2.03
Omas
Lc
25.77
Banda
Lc
13
1.93
Tukad Petanu
Nt
24.46
Tukad Petanu
Nt
14
1.9
Mayor
Lc
24.46
Omas
Lc
15
1.9
Rojo Lele
Lc
24.17
Baluyan
Lc
16
1.73
Banda
Lc
23.54
Dusel
Lc
17
1.73
Tokong
Lc
21.88
Diah Suci
Nt
18
1.67
Bawi
Lc
21.33
Tokong
Lc
19
1.6
Padi Halus
Lc
21.31
Lems
Lc
20
1.4
Lems
Lc
13.75
Bawi
Lc
21
1.1
Dusel
Lc
10.35
Padi Halus
Lc
Description: Nt = national genotype; Lc = local genotype
Based on grain yield per pot, among the national genotypes, replacement of NE genotypes (average of 1.97 g) with E genotype (average of 3.9 g) results in a potential yield increase of 99.49%, replacement of NR genotypes (average of 17.75 g) with genotype R (average of 29.75 g) results in a potential yield increase of 67.61%. Among local genotypes, replacement of NE genotype (average of 1.85 g) with E genotype (average of 3.37 g) results in a potential yield increase of 82.16%, replacement of NR genotype (an average of 16, 3 g) with R genotype (average
of 24.7 g) results in a potential yield increase of 51.53%. Percentage of yield increase among national genotype is greater than potential yield increase among local genotypes. However, percentage yield increase due to replacement of E genotype with NE genotype was much greater than that due to replacement of R genotype with NR genotype. Therefore, efforts to increase rice production by utilization of N efficient genotypes would be much more effective than those by utilization of N responsive genotypes.
68
Biosfera 29 (1) Mei 2011
35
33,73
Efficient's Cluster
Non Efficient's Cluster
30
25,77
Grain yield per pot (g)
25,73
23,67
25
21,83 20,2
20
13,67
15
12,4
10
5
3,73
3,67
4,13
3,07
2
2,6
1,93
1,1
0
Ciliwung (ER-Nt)
Mayangsari (ER-Lc)
Ciapus (ENR-Nt)
Solo (ENR-Lc)
IR-42 (NER-Nt)
Arias B (NER-Lc)
Tukad Petanu (NENR-Nt)
Dusel (NENR-Lc)
Genotype N1 (0 kg N/ha)
N2 (120 kg N/ha)
Figure 1. Grain yield per pot of all selected genotypes representing all categories There are more rice cultivars or genotypes in Indonesia of which their characteristics, especially their nutrient utilization efficacy, have not been studied yet. Such a grouping of rice cultivars and genotypes is useful for farmers to improve their rice productivity, minimize fertilizer cost, and reduce the risk of environmental pollution. In addition, cultivation of nutrient efficient rice genotypes will help government to improve rice production for self-sufficiency in rice production.
Conclusion The 60 evaluated rice genotypes can be grouped into 43.33% ER genotype (25.0% national superior genotypes; 18.3% of local genotype), 11.7% ENR genotype (10.0% national superior genotypes; 1.7% local genotype), 8.3% NER genotype (5.0% of national superior genotypes; 3.3% local genotype), and 35.0% NENR genotype (8.3% of national superior genotypes; 26.7% of local genotypes). Replacement of rice cultivars of NE genotype with E genotype
results in a potential yield increase of 90.83%, while replacement R genotype with NR genotype results in a potential yield increase of 59.57%. Replacement of local genotypes with national superior genotypes has a potential yield increase of 5.05 8.66%. ER genotypes can be used as cultivars in the effort of increasing rice production to reduce the cost of N and decrease environmental pollution. ER, ENR, and NER genotypes can be used as parental genotypes in an effort to develop high yielding cultivars with high efficiency and responsiveness to N.
Recommendation ER genotypes can be suggested to be used momentarily in a program for increasing rice production until multi-location trials to test ER genotypes are completed and the result is confirmed. Clustering and selection of other rice genotypes are necessary to avoid loss of farming investment and to reduce the risk of environmental pollution.
Darjanto dkk., Studi on The Efficacy of Nitrogen Utilization by Rice Genotypes Part 1 : 62-69
References Baligar, V.C. and N.K. Fageria. 1997. Nutrient use efficiency in acid soil: nutrient management and plant use efficiency. Brazilian Soil Sci. Soc. 75-95. Blair, G. 1993. Nutrient efficiency-what do We really mean. In Genetic Aspects of Plant Mineral Nutrition. Eds. PJ Randall, E. Delhaize, RA Richards and R. Muns. Pp 205-213. Kluwer Academics Publishers, Dordrecht, The Netherlands. Cassaman, K.G., Peng S., Olk D.C., Ladha J.K., Reichardt W., Dobermann, A., and Singh U. 1998. Opportunities for Increased nitrogen-use efficiency from improved resource management in irrigated rice systems. Field Crop Research 56: 7-39. De Datta, S.K. and Broadbent, F.E. 1988. Methodology for Evaluating nitrogen utilization efficiency by rice genotypes. Agron. J. 80: 793-798. Eagle, A.J., J.A. Bird, W.R. Howarth, B.A. Linquist, S.M. Brouder, J.E. Hill, and C.V. Kessel. 2000. Rice yield and nitrogen use efficiency under straw management practices. Agron. J. 92:1096-1103. Fageria, N.K. and V.C. Baligar 1993. Sreening crop genotypes for mineral stresses. In: Adaptation of Plants for Soil Stress. Eds. J.W. Maranville, V.C. Baligar, R.R. Duncan and J.M. Yohe. Pp 152-159. Univ. Nebraska, INTSORMIL-USAID, Lincoln, NE. Good, A.G., A.K. Shrawat, and D.G. Muench. 2004. Can less yield more? Is reducing nutrient input into the environment compatible with maintaining crop production?
69
Riview. Trends Plant Sci. 9 (12): 597-605. Karno. 2009. Study paddy efficient phosphorus and nitrogen fertilization in red-yellow podzolic soil. Dissertation. Graduate Program, Gadjah Mada University, Yogyakarta. Ladha, J.K. and P.M. Reddy. 2003. Nitrogen fixation in rice systems: state of knowledge and future prospects. Plant and Soil 252: 151167. Marschener, H., 1995. Mineral nutrition of higher plants. Academic Press. New York. Peng, S. and D. Senadhira, 2000. Genetic enhancement of rice yield. Proceeding of a workshop on rice yield potential in favorable environments. IRRI, Los Banos. Round, W.R. and G.V. Johnson, 1999. Improving Nitrogen Use Efficiency for Cereal Production. Agron. J. 91: 357-363. Ray, D., M.S.S. Yee, K. Mukhopadhyay, H. Bindumadhava, T.G. Prasad and M.U. Kumar. 2003. High nitrogen use efficiency in rice genotypes is associated with higher net photosynthetic rate at lower Rubisco content. Plantarum Biologia 46 (2): 251-256. Shenoy, V.V., G.M. Kalagudi, and B.V. Gurudatta. 2001. Towards nitrogen autotrophic rice. Current Science 81 (5): 451-457. Shi, W.M., F.X. Wei, M.L. Su, and Q.D. Gang, 2010. Response of two rice cultivars differing in seedling-stage nitrogen use efficiency to growth under low-nitrogen conditions. Plant and Soil 326: 291-302.