Annals of Botany 89: 55±65, 2002 doi:10.1093/aob.2002.mcf005, available online at www.aob.oupjournals.org
Structure and Function of Shisham Forests in Central Himalaya, India: Nutrient Dynamics N E E L U LO D H I Y A L 1 , L . S . LO D H I Y A L 2 , * and Y . P . S . P A N G T E Y 1 1 Department of Botany, D.S.B. Campus, Kumaun University, Nainital-263002, Uttaranchal, India and 2 Department of Forestry, Kumaun University Campus, Almora, Pin-263601, Uttaranchal, India Received: 6 February 2001 Returned for revision: 3 April 2001 Accepted: 14 September 2001
The structure and function of Shisham (Dalbergia sissoo Roxb.) forests were investigated in relation to nutrient dynamics in 5- to 15-year-old stands growing in central Himalaya. Nutrient concentrations and storage in different layers of vegetation were in the order: tree > shrub > herb. Forest soil, litter and vegetation accounted for 80´1±91´9, 1´0±1´5 and 7´0±18´4 %, respectively, of the total nutrients in the system. There were considerable reductions (trees 32´8±43´1; shrubs 26´2±32´4; and herbs 18´8±22´2 %) in nutrient concentrations of leaves during senescence. Nutrient uptake by the vegetation as a whole and also by the different components, with and without adjustment for internal recycling, was investigated. Annual transfer of litter nutrients to the soil from vegetation was 74´8±108´4 kg ha±1 year±1 N, 5´6±8´4 kg ha±1 year±1 P and 38´7±46´9 kg ha±1 year±1 K. Turnover rate and time for different nutrients ranged between 56 and 66 % year±1 and 1´5 and 1´8 years, respectively. The turnover rate of litter indicates that over 50 % of nutrients in litter on the forest ¯oor are released, which ultimately enhances the productivity of the forest stand. The nutrient use ef®ciency in Shisham forests ranged from 136 to 143 kg ha±1 year±1 for N, 1441 to 1570 kg ha±1 year±1 for P and 305 to 311 kg ha±1 year±1 for K. Compared with natural oak forest (265 kg ha±1 year±1) and an exotic eucalypt plantation (18 kg ha±1 year±1), a higher proportion of nutrients was retranslocated in Shisham forests, largely because of higher leaf tissue nutrient concentrations. This indicates a lower nutrient use ef®ciency of Shisham compared with eucalypt and oak. Compartment models for nutrient dynamics have been developed to represent the distribution of nutrients pools and net annual ¯uxes within the system. ã 2002 Annals of Botany Company Key words: Dalbergia sissoo Roxb., nutrient concentration, retranslocation, net uptake, nutrient use ef®ciency, nutrient pool, nutrient ¯uxes, central Himalaya.
INTRODUCTION Dry matter accumulation and productivity of forests are in¯uenced by the presence of nutrients in soils and their recycling. Nutrient elements therefore limit forest productivity. Recycling of nutrients is one of the principal processes that supports organic matter production of forests. Thus, the functioning of a forest ecosystem in relation to dry matter production depends not only on the availability of nutrients but also on the pattern and rate of nutrient uptake by species occurring in the forest. According to Lodhiyal and Lodhiyal (1997), survival of tree species and the rate of nutrient uptake depend upon the availability of water. They pointed out that trees take up large quantities of nutrients from the soil system and, although much of the nutrient uptake is returned to the soil through litter fall, large amount of nutrients are also removed when trees are harvested. Thus, from the point of view of sustainability, studies on nutrient dynamics in Shisham forests which are harvested following short rotations are important for management of plantation forestry. * For correspondence. Fax (91) 05942-35576, e-mail lslodhiyal@ yahoo.com * Present address: c/o Sri P. S. Rautela, M. P. Niwas, Stoneleigh Compound, Tallital, Nainital-263002, Uttaranchal, India.
Nutrient accumulation and the pattern of distribution in different plants are affected by climate (Bazilevick and Rodin, 1966), and by the type and age of the species (Ovington, 1968). Lodhiyal et al. (1994) pointed out that the major macronutrients limiting the production of a forest crop are N, P and K. According to Chapin and Kedrowski (1983), nutrient availability is a major factor in¯uencing the distribution of plant species. Most plants from low nutrient sites have a low nutrient requirement (Clarkson, 1967; Robinson, 1968; Grime, 1977; Chapin, 1980). Stachurski and Zimka (1975) and Tilton (1977) suggested that plants growing on nutritionally de®cient sites minimize nutrient loss by retranslocating a greater fraction of N and P from senescing leaves. Uptake of nutrients was found to be much greater in deciduous plantations than in evergreen plantations (Lodhiyal and Lodhiyal, 1997). On the basis of aboveground biomass production relative to N uptake, deciduous forests have a lower nutrient use ef®ciency (NUE) than evergreen forests (Waring and Schlesinger, 1985). However, NUE did not differ with forest type across local N mineralization gradients in mixed-species sequences (Nadelhoffer et al., 1985), and was poorly correlated with foliar life span across diverse ecosystems (Reich et al., 1992). According to Lodhiyal and Lodhiyal (1997), the high NUE is largely the result of: (a) higher soil nutrient availability, and (b) increased nutrient concentrations and ã 2002 Annals of Botany Company
56
Lodhiyal et al. Ð Nutrient Dynamics of Shisham Forests
TA B L E 1. Concentration of nutrients (% 6 s.e.) in different components of trees, shrubs and herbs, and in soils of Tarai Shisham forests in central Himalaya Age of Shisham forests (years) Components Tree layer Bole wood Bole bark Branch* Twig² Leaf Reproductive parts Stump root³ Lateral roots¶ Fine roots§ Shrub layer Lantana camara Stem Foliage Roots Murraya koenighii Stem Foliage Roots Clerodendron viscosum Stem Foliage Roots Pogostemone benghalense Stem Foliage
Nutrient
5
10
15
N P K N P K N P K N P K N P K N P K N P K N P K N P K
0´365 0´042 0´202 1´410 0´089 0´588 0´980 0´095 0´200 1´658 0´099 0´588 2´750 0´188 0´780 3´254 0´340 0´925 0´570 0´042 0´378 0´610 0´068 0´550 1´012 0´198 0´610
6 6 6 6 6 6 6 6 6 6 6 6 6 6 6 6 6 6 6 6 6 6 6 6 6 6 6
0´012 0´015 0´017 0´020 0´024 0´026 0´034 0´028 0´025 0´031 0´038 0´034 0´055 0´059 0´062 0´048 0´043 0´040 0´040 0´039 0´034 0´034 0´040 0´041 0´055 0´059 0´059
0´340 0´039 0´198 1´390 0´088 0´582 0´962 0´088 0´198 1´625 0´096 0´582 2´680 0´175 0´762 3´225 0´320 0´915 0´592 0´038 0´375 0´698 0´062 0´520 0´998 0´598 0´598
6 6 6 6 6 6 6 6 6 6 6 6 6 6 6 6 6 6 6 6 6 6 6 6 6 6 6
0´020 0´027 0´024 0´025 0´020 0´020 0´041 0´038 0´039 0´042 0´044 0´038 0´035 0´039 0´041 0´050 0´058 0´052 0´030 0´024 0´025 0´034 0´032 0´028 0´042 0´050 0´050
0´328 0´038 0´195 1´380 0´085 0´562 0´940 0´071 0´195 1´580 0´094 0´570 2´640 0´170 0´740 3´118 0´312 0´908 0´550 0´035 0´370 0´595 0´058 0´480 0´995 0´188 0´589
6 6 6 6 6 6 6 6 6 6 6 6 6 6 6 6 6 6 6 6 6 6 6 6 6 6 6
0´014 0´018 0´010 0´025 0´020 0´024 0´052 0´012 0´014 0´025 0´020 0´025 0´40 0´034 0´030 0´020 0´019 0´012 0´014 0´015 0´012 0´024 0´021 0´022 0´030 0´026 0´020
N P K N P K N P K
0´705 0´079 0´510 2´348 0´155 0´738 0´780 0´077 0´546
6 6 6 6 6 6 6 6 6
0´052 0´034 0´025 0´040 0´015 0´021 0´058 0´028 0´036
0´702 0´078 0´508 2´345 0´152 0´735 0´778 0´075 0´540
6 6 6 6 6 6 6 6 6
0´184 0´098 0´075 0´094 0´084 0´070 0´062 0´048 0´042
0´701 0´076 0´504 2´340 0´150 0´730 0´770 0´072 0´540
6 6 6 6 6 6 6 6 6
0´095 0´047 0´059 0´052 0´038 0´044 0´074 0´046 0´070
N P K N P K N P K
0´675 0´047 0´350 1´252 0´118 0´750 0´758 0´049 0´412
6 6 6 6 6 6 6 6 6
0´069 0´022 0´062 0´042 0´048 0´018 0´018 0´027 0´044
0´674 0´045 0´348 1´250 0´118 0´750 0´755 0´046 0´410
6 6 6 6 6 6 6 6 6
0´084 0´046 0´078 0´043 0´034 0´048 0´024 0´057 0´054
0´670 0´044 0´340 1´246 0´118 0´746 0´752 0´045 0´408
6 6 6 6 6 6 6 6 6
0´053 0´058 0´063 0´047 0´064 0´072 0´034 0´094 0´050
N P K N P K N P K
0´642 0.051 0´335 1´158 0´130 0´678 0´670 0´055 0´358
6 6 6 6 6 6 6 6 6
0´075 0´081 0´048 0´054 0´029 0´052 0´035 0´024 0´054
0´640 0´050 0´332 1´150 0´128 0´675 0´667 0´052 0´352
6 6 6 6 6 6 6 6 6
0´046 0´054 0´070 0´028 0´038 0´056 0´037 0´042 0´042
0´638 0´050 0´350 1´152 0´127 0´673 0´664 0´051 0´350
6 6 6 6 6 6 6 6 6
0´029 0´039 0´066 0´045 0´050 0´043 0´032 0´047 0´052
N P K N P K
0´681 0´054 0´342 1´180 0´139 0´684
6 6 6 6 6 6
0´082 0´050 0´042 0´053 0´042 0´038
0´680 0´050 0´340 1´178 0´136 0´682
6 6 6 6 6 6
0´094 0´045 0´072 0´057 0´028 0´065
0.675 0.046 0.334 1´175 0´135 0´677
6 6 6 6 6 6
0.074 0.058 0.073 0´046 0´034 0´054
Lodhiyal et al. Ð Nutrient Dynamics of Shisham Forests
57
TA B L E 1. Continued Age of Shisham forests (years) Components Roots Herb layer Above-ground Below-ground Soil (0±30 cm depth)
Nutrient
5
10
15
N P K
0´750 6 0´042 0´055 6 0´034 0´480 6 0´026
0´740 6 0´069 0´054 6 0´047 0´479 6 0´046
0´730 6 0´063 0´052 6 0´050 0´475 6 0´042
N P K N P K N P K
1´572 0´084 1´342 1´221 0´065 1´142 0´159 0´013 0´065
1´540 0´082 1´314 1´202 0´062 1´135 0´156 0´013 0´061
1´475 0´078 1´304 1´165 0´060 1´124 0´151 0´012 0´056
6 6 6 6 6 6 6 6 6
0´068 0´049 0´063 0´063 0´025 0´052 0´30 0´26 0´38
6 6 6 6 6 6 6 6 6
0´076 0´056 0´074 0´058 0´042 0´063 0´32 0´26 0´30
6 6 6 6 6 6 6 6 6
0´082 0´044 0´064 0´078 0´036 0´050 0´39 0´39 0´40
* Large woody shoots with leaves. Current shoots bearing leaves. ³ Main root with tap roots and parts of stem (stump bearing roots). ¶ Lateral branches of main roots with diameter > 5 mm. § Roots of diameter < 5 mm and associated mycorrhizae. ²
amount of litter nutrient returned through litter fall to the soil. Unscienti®c thinning and harvesting of trees not only degrades forest soils but also removes nutrients from the ecosystem. Many studies have been carried out into nutrient storage and cycling in forests and plantations (Kan et al., 1965; Johri, 1977; Singh and Misra, 1978; Seth et al., 1983; Chaturvedi and Singh, 1987a, b; Rawat and Singh, 1988; Lodhiyal, 1990; Bargali et al., 1992; Jha, 1995; Lodhiyal et al., 1995b; Lodhiyal and Lodhiyal, 1997; Pacholi, 1997). The amounts of nutrients taken up depend on the demands of the plant species and on the availability of nutrients in the soil to supply that demand. Thus, dry matter production is generally based on the fertility of the soil and on extra inputs provided by management. Increasingly, indigenous leguminous trees are being planted in India because of their high biomass per unit area, their survival on nutrient poor sites and for their nutrient conservation ef®ciency. The pressures of a growing population and adverse ecological changes in the natural Shisham forests necessitate investigations into their sustainability. Little is known about the nutrient cycling and nutrient use ef®ciency of Dalbergia sissoo which enable it to occupy Tarai (nutrient-rich sites) belts in central Himalaya. The present investigation aims to provide detailed information on the structure and functioning of Shisham forests growing in moist plains of central Himalayan mountains in India, with regards to nutrient cycling and the pattern of nutrient use. The major objectives of this study were to describe: (a) the various aspects of nutrient cycling, such as nutrient uptake and nutrient retranslocation in different vegetation layers; (b) nutrient return to soils through litter (i.e. by trees, shrubs and herbs); (c) nutrient use ef®ciency in relation to dry matter production and net nutrient uptake; and (d) to compare estimates of nutrients in Shisham forests with those in exotic plantations and natural forests.
MATERIALS AND METHODS Nutrient dynamics were investigated in 5-, 10- and 15-yearold Shisham forest stands in Tarai belts of central Himalaya; dry matter dynamics of these forests have been reported previously (Lodhiyal et al., 2002). Sal forest (mixed broad leaved species) was the original vegetation in the Tarai area (Champion and Seth, 1968). According to Lodhiyal et al. (1995a), most of this region was converted into arable land during the 1960s, and since the 1970s has been used for exotic tree plantations. Details of the study site (i.e. topography, geology, soils, meteorological data and vegetation types) and methods of sampling tree, shrub and herb components are described by Lodhiyal et al. (2002). Samples of different tree components, i.e. bole wood, bole bark, branch, twig, leaf, reproductive parts, coarse roots (stump root + lateral roots) and ®ne roots were collected from 12 harvested trees [three trees from each subplot, one from each dbh (diameter at breast height) class; see Lodhiyal et al. (2002)] for nutrient analysis (nutrient concentration and nutrient content) in each Shisham forest stand. Tree and shrub components were sampled during September 1996, and herbs (above- and below-ground parts) were collected in each season, i.e. summer, winter and the rainy season. Composite samples (samples of each component taken from the lower, middle and upper plant parts and mixed) for each of the tree, shrub and herb components were taken separately to the laboratory and oven-dried at 60 °C to constant weight. Oven-dried samples were mill-ground for nutrient analysis. Litter samples were collected using litter traps at monthly intervals in all forest stands. The composite litter samples (litter samples collected from each dbh class of tree and mixed to form a composite, separately for each component)
58
Lodhiyal et al. Ð Nutrient Dynamics of Shisham Forests
for each litter component, i.e. leaf, wood, reproductive litter and other litter, were ground separately and analysed for nitrogen, phosphorus and potassium. Five replicates of dry plant material (0´5 g each) were analysed for total nitrogen after digestion by 10 ml concentrated sulfuric acid using 5 g of a catalyst mixture (potassium sulfate and cupric sulfate in a 9 : 1 ratio) in a quick digestion unit. Total nitrogen was determined by the micro-Kjeldahl technique (Peach and Tracy, 1956; Misra, 1968; Lodhiyal et al., 1995b). Phosphorus and potassium were extracted by wet ashing 0´5 g plant material in an acid mixture consisting of 10 ml H2SO4 + 3 ml HNO3 + 1 ml HClO4, following the method of Jackson (1958). Phosphorus was determined by absorption spectrophotometry and potassium by ¯ame photometry (Jackson, 1958). The standing state of nutrients in trees, shrubs and herbs was computed separately by multiplying the dry weight of each component by the respective nutrient concentration. Nutrient values in trees, shrubs and herbs were summed to obtain the total standing state of nutrients in the vegetation. The amount of nutrients (N, P and K) in the soil was determined by the micro-Kjeldahl technique for N (Peach and Tracy, 1956), absorption spectrophotometry for P and ¯ame photometry for K (Jackson, 1958). The amount of nutrients in the top 30 cm of soil was calculated by summing values for 0±10, 10±20 and 20±30 cm soil depths in each forest stand. Soil volume multiplied by the respective average bulk density gave the weight of the soil, which was in turn multiplied by the corresponding nutrient concentration to obtain the amount of soil nutrients (N, P and K). The mean nutrient concentration was multiplied by the weight of annual litter fall, i.e. leaf, wood, reproductive parts of trees, and leaves of shrubs and herbs to give the amount of nutrients transferred to the forest ¯oor in vegetation in stands of different ages. The turnover rate (K) for each nutrient on the forest ¯oor was estimated following Chaturvedi and Singh (1987b) and Lodhiyal and Lodhiyal (1997) as: K = A/(A + F) where A is the amount of nutrients added to the forest ¯oor by litter fall and F is the nutrient content of the lowest value of standing crop of litter in the annual cycle. Turnover time (t) for nutrients was calculated as for standing litter biomass. Turnover time is the reciprocal of turnover rate (K). Nutrient uptake by components of vegetation in stands of different age was calculated by multiplying the net primary productivity (NPP) of different components by their nutrient concentration. The values of nutrient uptake by trees, shrubs and herbs were summed to estimate the total annual uptake by the forest vegetation. Some retranslocation of nutrients (N, P and K) occurred during senescence of foliage. This was assessed following Ralhan and Singh (1987), Rawat and Singh (1988), Lodhiyal et al. (1995b) and Lodhiyal and Lodhiyal (1997), i.e. R = (X ± Y)/X 3 100 where R is nutrient retranslocation (%), X is the nutrient mass in mature green leaves, and Y is the nutrient mass in
senesced leaves. X and Y were calculated on the basis of nutrient per unit weight of mature green and senesced leaf, respectively, multiplied by total amount of leaf litter fall. To estimate nutrient retranslocation, 120 mature green and freshly fallen senesced leaves were collected in September (peak month of leaf maturity) and December (leaf senescing period) 1997, respectively. Since rainfall is negligible in the region when leaves senesce (December), leaching is likely to have only a minimal effect on nutrient loss from the leaves (Ralhan and Singh, 1987). The nutrient use ef®ciency (E) per unit area of Shisham forests was calculated by: E = P/U where P is NPP and U is the net nutrient uptake in kg ha±1 year±1 by the trees. RESULTS AND DISCUSSION Nutrient concentration
Table 1 summarizes N, P and K concentrations in the different components of vegetation (i.e. trees, shrubs and herbs) of Shisham forests growing in Tarai belts of the central Himalayan mountains in India. The concentration of nutrients in tree components was in the order: reproductive parts > leaf > twig > bole bark > branch > bole wood in above-ground parts, and ®ne roots > lateral roots > stump root in below-ground parts. The nutrient concentrations in different components of Shisham trees were higher in 5-year-old stands than in 15-year-old stands. Thus, as trees age the percentage of nutrients (N, P and K) in the different components decreases. Similar trends in different components of fast-growing poplar and eucalypt trees were reported by Lodhiyal et al. (1995b), Lodhiyal and Lodhiyal (1997), and Bargali et al. (1992) in adjacent areas of central Himalaya. The nutrient concentration of Shisham leaves was markedly higher than that reported for poplar (2´25± 2´35 %; Lodhiyal et al., 1995b) and eucalypt plantations (1´21 %; Bargali and Singh, 1991) and natural oak forests of central Himalaya (1´89±2´11 % N, 0´078±0´097 % P and 0´46±0´66 % K; Singh and Singh, 1987; Rawat and Singh, 1988). Leaf to wood concentration ratios for N (7´5±8´0), P (4´5) and K (3´8±3´9) were similar to those found in natural forests of central Himalaya and fall within the range for N (11±12) and P (6±7) reported for poplar trees (Lodhiyal et al., 1995b) but are much lower than values reported for temperate forests (Whittaker, 1975). Leaf nutrient concentrations are higher than in Populus deltoides plantations (Lodhiyal et al., 1995b) and Eucalyptus hybrid plantation (Bargali et al., 1992). Soil nutrient concentration decreased with increasing forest age (Table 1; details of soils are given in Lodhiyal et al., 2002), possibly as a consequence of uptake and leaching of nutrients by the Shisham forests. Similar ®ndings were also reported for Tarai poplar plantations in nearby areas (Lodhiyal et al., 1995b). However, loss of nutrients can be considerable during initial site preparation,
Lodhiyal et al. Ð Nutrient Dynamics of Shisham Forests TA B L E 2. Nutrient content (kg ha±1) in different vegetation layers of Shisham forests
TA B L E 3. Magnitude of retranslocation of nutrient (%) in leaves of different vegetations layers of Shisham forests
Age of Shisham forests (years) Components Nitrogen Tree layer % Allocation in bole* branch² leaf reproductive parts coarse roots³ ®ne roots Shrub layer Herb layer Total vegetation Soil (0±30 cm depth) Phosphorus Tree layer % Allocation in bole* branch² leaf reproductive parts coarse roots³ ®ne roots Shrub layer Herb layer Total vegetation Soil (0±30 cm depth) Potassium Tree layer % Allocation in bole* branch² leaf reproductive parts coarse roots³ ®ne roots Shrub layer Herb layer Total vegetation Soil (0±30 cm depth)
5
10
15
402´1 (82´3)
692´2 (85´5)
877´3 (87´5)
43´4 17´0 22´1 4´3 11´3 1´9 44´4(9´1) 41´9 (8´6) 488´4 (100) 4834´6
45´3 18´7 18´1 4´4 11´3 2´2 79´8 (9´8) 38´1 (4´7) 810´1(100) 4945´4
45´0 20´3 15´5 5´5 11´2 2´5 91´3 (9´1) 33´6 (3´4) 1002´2 (100) 5026´0
43´7 (87´8)
64´5 (88´3)
72´5 (88´7)
37´1 12´6 13´9 24´3 8´7 3´4 3´9 (7´8) 2´2 (4´4) 49´8 (100) 405´7
44´8 15´5 12´7 4´7 9´6 12´7 6´6(9´0) 2´0 (2´7) 73´1 (100) 412´6
48´6 16´8 12´0 6´6 10´2 5´8 7´4 (9´1) 1´8 (2´2) 81´7 (100) 388´9
172´6 (73´6)
289´6 (79´0)
390´9 (83´1)
50´0 10´7 14´6 2´8 19´2 2´7 25´6(10´9) 36´4 (15´5) 234´6 (100) 1968´4
55´4 6´4 12´3 3´0 19´8 3´1 43´7 (11´9) 33´2 (9´1) 366´5 (100) 1934´6
51´9 12´6 9´7 3´6 18´8 3´4 49´5 (10´5) 30´3 (6´4) 470´7 (100) 1872´1
Values in parentheses represent percentage contribution. * Bole wood + bole bark, which accounted for 11´0±19´8 % of the values (N, P and K). ² Branch + twig (new shoots bearing leaves), which accounted for 1´7± 9´3 % of the values (N, P and K). ³ Stump root (main root) + lateral roots (lateral branches of main roots, which accounted for 3´2±7´9 % of the values (N, P and K).
which involves burning ground vegetation and litter and, as a result of soil disturbance which accompanies planting, especially when vegetation cover is sparse (Bormann and Likens, 1979). Standing state of nutrients
The standing state of nutrients increased with forest age due to increased dry matter storage (Table 2). Bole (wood + bark) had the greatest concentration of nutrients in the trees. The relative contribution to the standing state of nutrients in different above-ground parts was generally in the order:
59
Age of Shisham forests (years) Vegetation
Nutrient
5
10
15
Tree layer
N P K N P K N P K
35´2 30´3 43´1 32´4 30´7 30´2 22´2 17´2 19´8
33´6 28´8 41´5 30´3 25´0 28´7 21´6 16´8 19´4
32´8 28´1 40´3 28´8 25´0 26´2 20´8 16´9 18´8
Shrub layer Herb layer
TA B L E 4. Nutrient uptake (kg ha±1 year±1) by different vegetation layers of Shisham forests Age of Shisham forests (years) Components Nitrogen Tree layer % Allocation in bole* branch² leaf reproductive parts coarse roots³ ®ne roots Shrub layer Herb layer Total vegetation Phosphorus Tree layer % Allocation in bole* branch² leaf reproductive parts coarse roots³ ®ne roots Shrub layer Herb layer Total vegetation Potassium Tree layer % Allocation in bole* branch² leaf reproductive parts coarse roots³ ®ne roots Shrub layer Herb layer Total vegetation
5
10
15
67´1(63´7)
96´9 (91´5)
122´9 (117´1)
45´1 17´7 14´4 3´0 11´7 8´1 5´4 (4´9) 41´9 (34´3) 114´4 (102´9)
41´3 17´1 16´5 7´7 9´2 8´2 9´3 (8´6) 38´1 (31´4) 144´3 (131´5)
40´4 18´3 14´4 6´6 12´2 8´1 10´2 (9´4) 33´6 (28´0) 166´7 (154´5)
6´4 (6´2)
8´9 (8´7)
10´9 (10´6)
44´1 14´9 10´4 3´3 10´5 16´8 1´4 (1´3) 2´2 (1´9) 10´0 (9´4)
41´2 14´2 11´6 8´2 7´4 17´4 0´75 (0´7) 2´0 (1´7) 11´7 (11´1)
40´3 14´0 10´4 7´4 10´9 17´0 0´8 (0´7) 1´8 (1´5) 13´5 (12´8)
30´5 (29´3)
42´8 (40´9)
56.1 (54´0)
49´0 10´5 9´0 2´0 18´7 10´8 3´1 (2´9) 36´4 (30´5) 70´0 (62´7)
47´9 10´6 10´6 4´9 14´8 11´2 5´1(4´7) 33´1 (28´0) 81´0 (73´6)
45´6 11´1 8´8 4´2 19´8 10´5 5´5 (5´2) 30´3 (25´8) 91´9 (85´1)
Values in parentheses represent nutrient uptake (kg ha±1 year±1) after adjustment for retranslocation. * Bole wood + bole bark, which accounted for 11´9±19´6 % of the nutrient values (N, P and K). ² Branch + twig (new shoots bearing leaves, which accounted for 4´9± 8´3 % of the nutrient values (N, P and K). ³ Stump root (main root) + lateral roots (lateral branches of main root, which accounted for 2´2±10´3 % of the nutrient values (N, P and K).
60
Lodhiyal et al. Ð Nutrient Dynamics of Shisham Forests TA B L E 5. Comparison of nutrient uptake (kg ha±1 year±1) in different vegetation around the world Nutrient (kg ha±1 year±1)
Vegetation
Location
Age (years)
Nitrogen
Phosphorus
Potassium
Shorea robusta Alnus sibirica Betula sp. Mixed broad-leaved forest Pinus khasia Temperate deciduous forest Eucalyptus grandis Cedrus deodara Tectona grandis
India Korea Finland Japan India
± 2 40 ± ± ± ± 35 30
India India India India India India India Ranchi, Bihar (India) Ranchi, Bihar (India) Ranchi, Bihar (India) Tarai (Uttaranchal) India
12 >100 24 ± 2±8 5±8 1±4 8
7´5 12´0 10´9 9´7 25´0 5´6 45´0 ± 15´8 (13´3) 2´9 10´3 6´0 12´5 5´7±9´2 19´2±22´4 19´8±29´7 11´8 (11´0)
± 70´0 47´8 76´5 72´4 50´7 66´7 ± ±
Pinus patula Oak forest Dalbergia sissoo Lantana camara Eucalyptus hybrid Populus deltoids Populus deltoids Dalbergia sissoo
105´5 120´0 109´6 108´2 103´9 75´0 100´4 152´0 107´73 (88´9) 50´8 231´9 106´0 230´8 89´7±127´1 230´9±273´5 234´4±284´5 277´8 (256´5)
22´4 75´8 33´0 ± 48´2±97´3 121´8±125´9 129´4±176´8 61´0 (54´6)
Bhartari (1986) Rawat and Singh (1988) Sharma et al. (1988) Bhatt (1989) Bargali et al. (1992) Lodhiyal et al. (1995b) Lodhiyal and Lodhiyal (1997) Pacholi (1997)
8
180´0 (159´1)
11´2 (10´5)
50´5 (45´1)
Pacholi (1997)
8
106´4 (99´2)
5´22 (4´92)
56´50 (54´0)
Pacholi (1997)
5, 10 and 15
102´9±154´5
9´4±12´9
62´8±85´0
Present study
Cassia siamea Gmelina arborea Dalbergia sissoo forests (net uptake of vegetation)
Australia India Tarai (India)
References Singh (1974) Mun et al. (1977) Malkonen (1977) Katagiri et al. (1978) Das (1980) Cole and Rapp (1980) Turner and Lambert (1983) Ramam (1984) Jha (1995)
Values in parentheses are tree layer nutrients.
bole > leaf > branch > reproductive parts, and that in belowground parts was: stump root > lateral roots > ®ne roots. Similar trends have been reported for eucalypt (Feller, 1980; Bargali et al., 1992) and poplar plantations (Lodhiyal et al., 1995b; Lodhiyal and Lodhiyal, 1997). The different nutrients in the total vegetation (trees + shrub + herbs) was in the order: N (488±1002 kg ha±1 year±1) > K (235±471 kg ha±1 year±1) > P (50±82 kg ha±1 year±1). Nutrient storage by shrubs accounted for 8±12 % of storage by the vegetation as a whole and increased with forest age, while nutrient storage by herbs (2±15 %) decreased with stand age (Table 2). Similar trends were also reported for fast-growing poplar plantations (Lodhiyal et al., 1995b). This is because the tree canopy affects the growth of herbs and also reduces the amount of light available and thus photosynthetic ef®ciency. Nutrient retranslocation
The retranslocation of nutrients from senesced leaves was in the order: K (40±43 %) > N (33±35 %) > P (28±30 %) (Table 3). These estimates of nutrient retranslocation are markedly higher than those reported for fast-growing exotic eucalypt plantations (18±25 %; Bargali et al., 1992). However, the present estimates are lower than values reported for Tarai poplar plantations (42±64 %; Lodhiyal et al., 1995b), for Larix laricina, Alnus crispa and Betula papyrifera (44±81 %; Chapin and Kedrowski, 1983), for
Populus tremuloides (42±65 %; Verry and Timmons, 1976) and Populus deltoides (74±89 %; Baker and Blackman, 1977). However, our estimates are close to the 23±39 % reported for Quercus rubra (Grizzard et al., 1976) and 38± 49 % for Betula alleghaniensis (Hoyle, 1965). The estimate of N retranslocation was 33 % in mixed northern hardwood species (Bormann et al., 1977), which is similar to the present N estimate. Thus, on the basis of correlation between proportional nutrient retranslocation from senesced leaves and tree leaf nutrient concentrations, our ®ndings are consistent with those of Chapin and Kedrowski (1983). According to Lodhiyal and Lodhiyal (1997), the nutrient requirement of vegetation not only depends on stand age and soil nutrient level, but also on the nutrient concentration of foliage. They noted that the greater the leaf tissue nutrient level, the higher the nutrient retranslocation capacity of forest trees would be. Nutrient uptake
The present estimates of gross nutrient uptake (kg ha±1 year±1) by vegetation ranged from 114 (5-year-old stand) to 167 (15-year-old stand) for N, 10 (5-year-old stand) to 14 (15-year-old stand) for P, and 70 (5-year-old stand) to 92 (15-year-old stand) for K. Of this, the tree layer accounted for 59±74 % N, 64±81 % P and 44±61 % K; the shrub layer for 5±6 % N, 6±14 % P and 4±6 % K; and the herb layer for 20±37 % N, 13±22 % P and 33±52 % K (Table 4).
Lodhiyal et al. Ð Nutrient Dynamics of Shisham Forests TA B L E 6. Mean nutrient concentration (% 6 s.e.) in different litter components of vegetation of Shisham forests in Tarai of central Himalaya Age of Shisham forests (years) Components Nitrogen Trees Leaf Wood Reproductive parts Shrubs* Herbs² Phosphorus Tree Leaf Wood Reproductive parts Shrubs* Herbs² Potassium Trees Leaf Wood Reproductive parts Shrubs* Herbs²
5
10
TA B L E 7. Amount of nutrients (kg ha±1 year±1) returned through different litter components of vegetation Age of Shisham forests (years) Components
15
1´783 6 0´088 1´011 6 0´050 1´952 6 0´068
1´779 6 0´084 0´982 6 0´052 1´935 6 0´078
1´774 6 0´085 0´954 6 0´051 1´870 6 0´080
1´003 6 0´092 1´572 6 0´068
1´032 6 0´090 1´540 6 0´076
1´055 6 0´088 1´475 6 0´082
0´131 6 0´042 0´070 6 0´048 0´221 6 0´068
0´124 6 0´040 0´067 6 0´046 0´208 6 0´062
0´122 6 0´045 0´066 6 0´044 0´203 6 0´064
0´093 6 0´068 0´084 6 0´049
0´099 6 0´066 0´082 6 0´060
0´099 6 0´067 0´078 6 0´044
0´443 6 0´062 0´395 6 0´070 0´509 6 0´070
0´445 6 0´056 0´390 6 0´062 0´503 6 0´068
0´440 6 0´054 0´382 6 0´066 0´499 6 0´066
0´497 6 0´058 1´342 6 0´063
0´506 6 0´054 1´314 6 0´074
0´521 6 0´056 1´304 6 0´064
* This includes the composite mean nutrient concentrations (%) of leaves, twigs and reproductive parts of shrubs. ² This includes the (%) nutrient concentration of leaves of herbs.
The net uptake of nutrients by Shisham trees (after adjustment for retranslocation of nutrients from senescing leaves) was 64±117 kg ha±1 year±1 N, 6±11 kg ha±1 year±1 P and 29±54 kg ha±1 year±1 K. These values fall within the range reported for low density Populus deltoides plantations growing in an adjacent area (101±124, 11±14 and 55±66 kg ha±1 year±1 N, P and K, respectively; Lodhiyal et al., 1995b), are lower than those reported for high density poplar plantations (102±176, 12±19 and 49±94 kg ha±1 year±1 N, P and K, respectively; Lodhiyal and Lodhiyal, 1997), are higher than those reported for Eucalyptus hybrid plantations (Bargali et al., 1992) and are close to those of central Himalayan forests (Singh and Singh, 1992). Thus, the uptake of nutrients depends on the demand of the plant and the availability of nutrients in the soil to supply that demand. According to Lodhiyal and Lodhiyal (1997), the retention value (i.e. net nutrient uptake and return of litter nutrients) in¯uences the nutrient cycling of vegetation. The higher the retention value the greater the nutrient availability to the plant. A comparative study of nutrient uptake by different vegetation types is given in Table 5. Nutrient return through litter fall
Nutrient concentrations in the litter are given in Table 6 and the nutrient return through above-ground litter fall is given in Table 7. Of the net annual uptake of nutrients by
61
Nitrogen Trees % Allocation in tree component Leaf Wood Reproductive parts Roots Shrubs Herbs Total vegetation Phosphorus Trees % Allocation in tree component Leaf Wood Reproductive parts Roots Shrubs Herbs Total vegetation Potassium Trees % Allocation in tree component Leaf Wood Reproductive parts Roots Shrubs Herbs Total vegetation
5
10
15
41´9 (56´0)
64´1 (65´6)
74´9 (69´0)
48´6 1´2 0´7
55´4 2´1 1´9
56´2 3´2 3´2
5´6 5´8 (7´8) 27´0 (36´2) 74´8 (100)
6´2 9´1 (9´3) 24´5 (25´1) 97´6 (100)
6´3 12´3 (11´3) 21´3 (19´6) 108´4 (100)
3´6 (63´3)
5´3 (70´1)
6´1 (72´4)
46´9 1´1 1´1
50´1 1´8 2´5
49´8 2´9 4´4
14´2 0´5 (9´5) 1´5 (27´2) 5´6 (100)
15´7 0´9 (11´6) 1´4 (18´3) 7´5 (100)
15´3 1´1 (13´6) 1´2 (14´0) 8´4 (100)
12´0 (31´0)
18´5 (41´5)
21´5 (45´9)
23´3 0´9 0´4
30´4 1´9 1´0
32´4 3´0 1´9
6´4 2´9 (7´5) 23´8 (61´5) 8´7 (100)
8´2 4´4 (10´0) 21´5 (48´5) 44´5 (100)
8´6 6´0 (13´0) 19´3 (41´1) 46´9 (100)
Values in parentheses are the percent contribution of the total vegetation.
trees, 56±69 % N, 63±72 % P and 31±46 % K is returned to the ground through litter fall (Table 7). The total inputs of nutrients to the forest ¯oor via tree litter fall and litter fall from the total vegetation were similar to those of a eucalypt plantation (56 % N, 51 % P and 47 % K; Bargali and Singh, 1991) and lower than those reported for Populus deltoides plantations (Lodhiyal et al., 1995b) in an adjacent area in the central Himalayan mountains. Turnover of nutrients on the forest ¯oor
The turnover time of nutrients on the forest ¯oor was longer (Table 8) than that of tropical dry deciduous forests (0´3±0´5 year; Pandey, 1980), eucalypt plantations (1´1± 1´3 year; Bargali et al., 1992) and Populus deltoides plantations (1´1±1´4 year; Lodhiyal et al., 1995b). This indicates that a small part of the forest ¯oor litter biomass remained in steady state but this amount was less than in other deciduous forests. According to Lodhiyal and Lodhiyal (1997), a long turnover time shows that the forest ¯oor litter biomass is in
62
Lodhiyal et al. Ð Nutrient Dynamics of Shisham Forests
TA B L E 8. Turnover rate (K, year±1) and turnover time (t, years) of nutrients on the forests ¯oor
TA B L E 9. Nutrient use ef®ciency (kg ha±1 year±1) of Tarai Shisham forests in central Himalaya
Age of Shisham forests (years) Nutrient N P K
K t K t K t
Age of Shisham forests (years)
5
10
15
0´65 1´54 0´62 1´61 0´64 1´56
0´66 1´51 0´65 1´54 0´66 1´52
0´63 1´59 0´56 1´79 0´61 1´64
Nutrient N P K
5
10
15
143 (113) 1484 (1177) 311 (247)
137 (111) 1441 (1170) 305 (240)
143 (112) 1570 (1228) 309 (242)
NUE = NPP/net nutrient uptake. Values in parentheses are above-ground NUE.
Lodhiyal et al. Ð Nutrient Dynamics of Shisham Forests steady state because the annual decomposition rate of litter is low compared with the rate of litter input. Nutrient use ef®ciency
The nutrient use ef®ciency (NUE = NPP /net nutrient
63
uptake) of Shisham trees ranged from 137±143 kg ha±1 year±1 for N, 1441±1570 kg ha±1 year±1 for P and 305±311 kg ha±1 year±1 for K (Table 9). According to Lodhiyal et al. (1995b), as stems and branches become larger the nutrient concentration of woody tissues declines, resulting in higher nutrient use ef®ciency. The availability of soil nutrients in
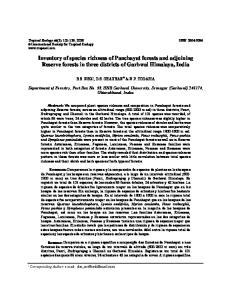
F I G . 1. Compartment models of a 5-year-old (A) and a 15-year-old (B) Shisham (Dalbergia sissoo Roxb.) forest showing the distribution and cycling of nitrogen (N), phosphorus (P) and potassium (K) in the tree, shrub and herb layers. Rectangles represent a pool for standing state of nutrients from one compartment to next. The values in the pools represent the average nutrient contents. Net annual ¯uxes of nutrients (N, P and K) between pools are shown on the arrows. Units are kg ha±1 for pools and kg ha±1 year±1 for ¯uxes between pools. Values in parentheses indicate adjustment for internal cycling. Recycling rates between leaf and twig for trees, foliage and stem for shrubs and above-ground and below-ground parts for herbs are shown by broken lines.
64
Lodhiyal et al. Ð Nutrient Dynamics of Shisham Forests
the Shisham forests studied was found to be similar to that in nearby high and low density Populus deltoides plantations (Lodhiyal et al., 1994). This may be due to higher nutrient concentrations in tissues and increased amounts of nutrients returned through litter in Shisham forests. Nitrogen NUE for N was lower in Shisham forests than in a nearby poplar plantation (Lodhiyal et al., 1994) while NUE for P and K was similar in both sites. However, the NUE for N was higher than the value reported for an 8-yearold eucalypt stand (215 kg ha±1 year±1; Bargali and Singh, 1991) and 189±209 kg ha±1 year±1 for central Himalayan natural Sal (Shorea robusta), oak (Quercus leucotrichophora) and chir (Pinus roxburghii) forests (Singh and Singh, 1987). This indicates that Shisham trees are preferable from the standpoint of NUE and their fast growth rate. Despite a proportional increase in nutrient retranslocation, Shisham forests have a similar NUE to eucalypt stands, largely because of higher tissue nutrient concentrations. The soil nutrient extraction ef®ciency (nutrient uptake per unit nutrient present in soil) of the Shisham forests studied was 1´3±2´2 for N, 1´5±2´7 for P and 1´5±2´9 for K, and falls within the range reported for Populus deltoides plantations (1´8±3´4; Lodhiyal et al., 1994). On the basis of the nutrient parameters above, Dalbergia sisoo is the most important species because it not only produces a higher amount of dry matter but also because it requires only small amounts of nutrients compared with exotic tree plantations and indigenous forest species in adjacent areas. Thus, it is more suitable than other species not only for Tarai regions but also for plantations in areas of low nutrient status. Thus, it is concluded that growing Shisham forests in the Tarai belt is advisable because of their relatively higher productivity, even in poor sites, than any other natural forest growing in adjacent areas. In addition, the species removes only small amounts of nutrients compared with the exotic fast-growing trees (poplar and eucalypt). Therefore, trees can be harvested in a shorter rotation period with higher wood biomass in this moist plain of central Himalaya. Nutrient dynamics
Compartment models of nutrient dynamics (pools and ¯uxes) for 5- and 15-year-old Shisham forests are presented in Fig. 1. Nutrients present in the soil to a depth of 30 cm are considered a source, while those associated with decomposition are released into the soil for re-use. The direction of nutrient ¯ux from soil to foliage indicates a one-way movement, although it is realised that the nutrients are utilized by the leaf in organic matter synthesis and that they are redistributed among different components at varying rates giving rise to internal recycling. The amount of nutrients (N, P and K) stored in the vegetation was greater in 15-year-old than in 5-year-old forest stands. Of the total nutrients, the tree layer accounted for 74±88 % in the 5-year-old stand and 83±89 % in the 15year-old stand. The total amount of P and K in the soil decreased, while the amount of N increased with increasing age of the forest.
The amount of nutrients (N, P and K) taken up by the different vegetational layers as a proportion of the total uptake was as follows: 5-year-old forest, trees (47±65 %) > herbs (20±49 %) > shrubs (5±14 %); 15-year-old forest, trees (64±82 %) > herbs (12±30 %) > shrubs (5±6 %). The total amount of nutrients retranslocated from aboveground senescing plant parts of the tree layer increased with the age of forest from 3´4 (5-year-old stand) to 5´8 kg ha±1 year±1 (15-year-old stand) for N, 0´2 (5-year-old stand) to 0´3 kg ha±1 year±1 (15-year-old stand) for P, and 1´2 (5-yearold stand) to 2´0 kg ha±1 year±1 (15-year-old stand) for K. In the shrub layer, the amount of N, P and K retranslocated was 0´37±0´84, 0´04±0´06 and 0´13±0´34 kg ha±1 year±1, respectively, and increased with the age of the stand. However, in the herb layer, the amount of nutrients ranged from 5´6 to 7´7 for N, 0´2 to 0´3 for P and 4´5 to 5´9 kg ha±1 year±1 for K, and decreased with the age of the stand. Thus, a proportion of annual dry matter production of litter supports the whole pattern of nutrient transfer in Shisham forests and consequently reduces the nutrient demand on the soil system. L I T E RA TU R E C I TE D Baker JB, Blackman BG. 1977. Biomass and nutrient accumulation in a cottonwood plantation: The ®rst growing season. Soil Science Society of America Journal 41: 632±636. Bargali SS, Singh SP. 1991. Aspects of productivity and nutrient cycling in an 8 year-old Eucalyptus plantation in a moist plain area adjacent to Central Himalaya, India. Canadian Journal of Forest Research 21: 1365±1372. Bargali SS, Singh SP, Singh RP. 1992. Structure and function of an age series of Eucalypt plantations in central Himalaya. II. Nutrient dynamics. Annals of Botany 69: 413±421. Bazilevick NI, Rodin LE. 1966. The biological cycle of nitrogen and ash elements in plant communities of the tropical and subtropical zones. Forest Abstract Leading Services 38. Bhartari SK. 1986. Biological productivity and nutrient cycling in Pinus patula plantation of Darjeeling hills. Indian Forester 112: 187±201. Bhatt YD. 1989. Structure and function of Lantana camara shrub lands in the central Himalaya. PhD Thesis, Kumaun University, India. Bormann FH, Likens GE. 1967. Nutrient cycling. Science 155: 424±429. Bormann FH, Likens GE. 1979. Patterns and process in a forested ecosystem. New York: Springer. Bormann FH, Likens GE, Melillo GM. 1977. Nitrogen budget for an aggrading northern hardwood ecosystem. Science 196: 981±982. Champion HG, Seth SK. 1968. A revised survey of forest types of India. Delhi Manager of Publications, Delhi: India. Chapin III FS. 1980. The mineral nutrition of wild plants. Annual Review of Ecology and Systematics 11: 233±260. Chapin III FS, Kedrowski RA. 1983. Seasonal changes in nitrogen and phosphorus fraction and autumn retranslocation in evergreen and deciduous Taiga trees. Ecology 64: 376±391. Chaturvedi OP, Singh JS. 1987a. A quantitative study of the forest ¯oor biomass, litter fall and nutrient return in a Pinus roxburghii forest in Kumaun Himalaya. Vegetatio 71: 97±106. Chaturvedi OP, Singh JS. 1987b. The structure and function of pine forest in Central Himalaya. Nutrient dynamics. Annals of Botany 60: 253±267. Clarkson DT. 1967. Phosphorus supply and growth rate in species of Agrostis L. Journal of Ecology 55: 111±118. Cole DW, Rapp M. 1980. Elemental cycling in forest ecosystems. In: Reichle DE, ed. Dynamic properties of forest ecosystems. Cambridge: Cambridge University Press. Das AK. 1980. Studies on the growth pattern, primary productivity and nutrient dynamics of Khari pine (Pinus kesiya). PhD Thesis, NorthEastern Hill University, Shillong, India. Feller MC. 1980. Biomass and nutrient distribution in two eucalypt forest ecosystems. Australian Journal of Ecology 5: 309±333.
Lodhiyal et al. Ð Nutrient Dynamics of Shisham Forests Grime JP. 1977. Evidence for the existence of three primary strategies in plants and its relevance to ecological and evolutionary theory. American Naturalist 111: 1169±1194. Grizzard T, Henderson GS, Clebsch EEC, Reichle DE. 1976. Seasonal nutrient dynamics of foliage and litter fall on Walker Branch Watershed, a deciduous forest ecosystem. Publication 814, Oak Ridge Natural Laboratory, Environmental Sciences Division, Oak Ridge, Tennessee, USA Hoyle MC. 1965. Variation in foliage composition and diameter growth of yellow birch with season, soil and tree size. Soil Science Society of American Proceedings 29: 475±480. Jackson ML. 1958. Soil chemical analysis. Englewood Cliffs, NJ: Prentice-Hall. Jha KK. 1995. Structure and functioning of an age series of teak (Tectona grandis Linn) plantations in Kumaon Himalayan Tarai. PhD Thesis, Kumaon University, India. Johri RM. 1977. Mineral circulation studies in some forest of Saugar with special reference to some selected trees. PhD Thesis, Saugar University, India. Kan MH, Saito H, Shidei T. 1965. Studies of the productivity of evergreen broad leaved forests. Bulletin Kyoto University of Forestry 37: 55±75. Katagiri S, Matrutani S, Tsutsumi T. 1978. Mineral cycling. In: Kira. Biological production in warm temperate evergreen oak forests of Japan. Volume 18. Synthesis. Japanese Institute of Biological Production. Tokyo: University of Tokyo Press. 276±285. Lodhiyal LS. 1990. Structure and functioning of Poplar plantations in Tarai belt of Kumaun Himalaya. PhD Thesis, Kumaon University, Nainital, India. Lodhiyal LS, Lodhiyal N. 1997. Nutrient cycling and nutrient use ef®ciency in short rotation, high density central Himalayan Tarai poplar plantations. Annals of Botany 79: 517±527. Lodhiyal LS, Singh RP, Singh SP. 1994. Productivity and nutrient cycling in poplar stands in central Himalaya, India. Canadian Journal of Forest Research 24: 1199±1209. Lodhiyal LS, Singh RP, Singh SP. 1995a. Structure and function of an age series of poplar plantations in central Himalaya. I. Dry matter dynamics. Annals of Botany 76: 191±199. Lodhiyal LS, Singh RP, Singh SP. 1995b. Structure and function of an age series of poplar plantations in central Himalaya. II. Nutrient dynamics. Annals of Botany 76: 201±210. Lodhiyal N. 2000. Structure and functioning of Shisham (Dalbergia sissoo Roxb.) forests in Tarai and Bhabar belts of Central Himalaya. PhD Thesis, Kumaon University, Nainital, India. Lodhiyal N, Lodhiyal LS, Pangtey YPS. 2002. Structure and function of Shisham forests in central Himalaya, India: Dry matter dynamics. Annals of Botany 89: 39±52. Malkonen E. 1977. Annual primary production and nutrient cycle in a birch stand. Communication Institute Forestry Fennica 91: 1±35. Misra R. 1968. Ecology work book. Calcutta: Oxford and IBH Publishing. Mun HT, Kim CM, Kim JH. 1977. Distribution and cycling of N, P and K in Korean older and oak stands. Korean Journal of Botany 20: 109±118. Nadelhoffer K, Abler J, Melillo J. 1985. Fine roots, net primary production, and soil nitrogen availability: a new hypothesis. Ecology 66: 1377±1390. Ovington JD. 1968. Some factors affecting nutrient distribution within
65
ecosystems. In: Eckardt FE, ed. Functioning of terrestrial ecosystem of the primary production level. Paris: UNESCO, 95±105. Pacholi RK. 1997. Biomass productivity and nutrient cycling in Cassia siamea, Dalbergia sissoo and Gmelina arborea plantations. PhD Thesis, Kumaon University, India. Pandey ON. 1980. Cycling of nitrogen, phosphorus and potassium in the soil-vegetation system of tropical dry deciduous forest of Chandraprabha region, Varanasi. PhD Thesis, Banaras Hindu University, India. Peach K, Tracy MV. 1956. Modern methods of plant analysis. Vol. 1. Berlin: Springer Verlag. Ralhan PK, Singh SP. 1987. Dynamics of nutrients and leaf mass in central Himalayan forest trees and shrubs. Ecology 68: 1974±1983. Raman SS. 1984. Trend of nutrient concentration, storage and uptake by forest trees. Indian Journal of Forestry 7: 93±102. Rawat YS, Singh JS. 1988. Structure and function of oak forest in central Himalayas. II. Nutrient Dynamics. Annals of Botany 62: 413±427. Reich PB, Walters MB, Ellsworth DC. 1992. Leaf life-span in relation to leaf, plant and stand characteristics among diverse ecosystems. Ecological Monographs 62: 365±392. Robinson IH. 1968. The response to phosphorus of some ecologically distinct plant species. I. Growth rates and phosphorus absorption. New Phytologist 67: 913±923. Seth SK, Kaul ON, Gupta AC. 1983. Some observations on nutrient cycling and return of nutrients in plantations at New Forest. Indian Forester 89: 90±98. Sharma DC, Taneja PL, Bisht APS. 1988. Biomass, productivity and nutrient cycling in a Dalbergia sissoo plantation. Indian Forester 114: 261±268. Singh JS, Singh SP. 1987. Forest vegetation of the Himalaya. Botanical Review 53: 82±192. Singh JS, Singh SP. 1992. Forest of Himalaya: Structure, functioning and impact of man. Nainital, India: Gyanodaya Prakashan. Singh KP, Misra R. 1978. Structure and functioning of natural, modi®ed and Silvicultural ecosystems of eastern Uttar Pradesh. MAB Technical Report, Banaras Hindu University, Varanasi, India (unpublished). Singh RP. 1974. A study of primary productivity and nutrient cycling in Chakia forest, Varanasi. PhD Thesis, Banaras Hindu University, Varanasi, India. Stachurski A, Zimka JR. 1975. Methods of studying forest ecosystems: Leaf area, leaf productivity and withdrawal of nutrient from leaves of trees. Ekologia Polska 23: 637±648. Tilton DL. 1977. Seasonal growth and foliar nutrients of Larik laricina in three wetland ecosystems. Canadian Journal of Botany 55: 1291± 1298. Turner J, Lambert MJ. 1983. Nutrient cycling within a 27-year-old Eucalyptus grandis plantation in New South Wales. Forest Ecology and Management 6: 155±168. Verry ES, Timmons DR. 1976. Elements in leaves of a trembling aspen clone by crown position and season. Canadian Journal of Forest Research 6: 436±440. Waring RH, Schlesinger WH. 1985. Forest ecosystems: concepts and management. New York: Academic Press. Whittaker RH. 1975. Community and ecosystems. 2nd edn. New York: Macmillan.