Stroke volume equation for impedance cardiography D. P. Bernstein I
H.J.M.
Lemmens 2
1Department of Anesthesiology, Palomar Medical Center, Escondido, CA, USA 2Department of Anesthesiology, Stanford University School of Medicine, Stanford, CA, USA
Abstract--The study's goa/ was to determine if cardiac output (CO), obtained by impedance cardiography (ICG), would be improved by a new equation N, implementing a square root transformation for dZ/dtmax/Zo, and a variable magnitude, mass-based volume conductor Vc. Pulmonary artery catheterisation was performed on 106 cardiac surgery patients pre-operatively. Post-operatively, thermodilution cardiac output (TDCO) was simultaneously compared with ICG CO. dZ/ dtmax/Zo and Zo were obtained from a proprietary bioimpedance device. The impedance variables, in addition to left ventricular ejection time TLVEand patient height and weight, were input using four stroke volume (SV) equations: Kubicek (K), Sramek (S), Sramek-Bernstein (SB), and a new equation N. CO was calculated as SV x heart rate. Data are presented as mean + SD. One way repeated measures of ANOVA followed by the Tukey test were used for inter-group comparisons. Bland-Altman methods were used to assess bias, precision and limits of agreement. P < 0.05 was considered statistically significant. CO implementing N (6.06+_ 1.481min 7) was not different from TDCO (5.97+_ 1.41 I m i n 7). By contrast, CO calculated using K (3.70+_ 1.531 min 7), S (4.16 +_ 1.831 min 7) and SB (4.37 + 1.821 min 7) was significantly less than TDCO. Bland-Altman analysis showed poor agreement between TDCO and K, S and SB, but not between TDCO and N. Compared with TDCO, equation N, using a square-root transformation for dZ/ dtmax/ Zo, and a mass-based Vc, was superior to existing transthoracic impedance techniques for SV and CO determination. Keywords--Stroke volume, Cardiac output, Impedance cardiography, Acceleration,
dZ/ dtmax Med. Biol. Eng. Comput., 2005, 43, 443-450
1 Introduction
TRANSTHORACICELECTRICALbioimpedance cardiography, or, simply, impedance cardiography (ICG), is a non-invasive, continuous, beat-to-beat method for estimating left ventriculax stroke volume (SV) and cardiac output (CO) (NEWMAN and CALLISTER, 1999; OVSYSHCHER and FURMAN, 1993; WOLTJER et al., 1997). Because of its non-invasive nature, ICG has been proposed as an alternative to thermodilution CO (TDCO) (SHOEMAKER et al., 2001). Unfortunately, however, poor agreement with TDCO in the critically ill, and especially those with cardiopulmonary pathology, has generally precluded its application in clinical decision making (RAAIJMAKERSe t al., 1999; 1998; CRITCHLEY et al., 2000; YOUNG and McQUILLAN, 1993; GENONI et al., 1998). A review of the literature indicates that the theoretical basis for existing ICG SV equations and their operational implementation depend upon the most basic laws of electricity, namely, Ohm's law and its corollaries (PENNEY,1986; OVSYSHCHER and FURMAN, 1993). These equations, in turn, are simply Correspondence should be addressed to Dr Donald P. Bernstein; emaih
[email protected] Paper received 14 October 2004 and in final form 2 March 2005 MBEConline number: 20054015 © IFMBE: 2005 Medical & Biological Engineering & Computing 2005, Vol. 43
modifications of an equation originally intended for extremity blood volume changes (NYBOER, 1950). Rather predictably, they inadequately articulate the much more complex and dynamic, vascular and haemorheologic inter-relationships of pulsatile thoracic blood flow (SAKAMOTOand KANAI, 1979; KOSICKIet al., 1986; VISSERet al., 1990). Thus a coherent, biophysically meaningful and theoretically robust mathematical expression, linking impedance-derived SV and CO to other standard methods has been suggested as being necessary (RAAIJMAKERS e t al., 1999). Accordingly, this study takes issue with some of the theoretical assumptions of existing methods; namely that (a) the magnitude of SV is directly related to power functions of thoracic length, or height-based thoracic length equivalents (BERNSTEIN, 1986) (b) all pulsatile impedance changes AZ(t) (~) and rates of change of impedance dZ/dt ( ~ s- 1) axe due to vessel volume chan gles AV(t) (ml) and rates of change of volume dV/dt (ml s- ), respectively (KuBICEK et al., 1966; 1974) (c) the specific resistance (i.e. 'resistivity') of blood Pb (~cm) is constant during ventriculmc ejection (KUBICEKe t al., 1974). Thus the goal of this study was to determine if a new SV equation, using a square-root transformation of dZ/dtm~x/Zo, and a vmdable-magnitude, mass-based volume conductor 443
(Vc), provides better CO results than existing SV methods. The new equation N is compared with the Kubicek (K), Sramek (S) and Sramek-Bernstein (SB) equations (KUBICEK et al., 1966; 1974; BERNSTEIN, 1986), using TDCO as a reference standard. 2 Background and methods 2.1 ICG SV equations implemented by the transthoracic approach and tetra-polar electrode configuration
2.1.1 Kubicek equation (K) pL 2 dZ(t) SVK -- ~ o dtIn~ TLVE
2.2 Implicit assumptions of the newly proposed ICG equation N (1)
2.1.2 Sramek equation (S) L 3 dZ(t)/dt .... SVs = - TLw 4.25 Z0
(2)
2.1.3 Sramek-Bernstein equation (SB) L3 SVs8 = 6 dZ(t)/dt .... TLw 4.25 Z0
(3)
where SV(I~, s, s m = ml; Vc(x) = pL2/Zo; Vc(s) = Ls/4.25; Vc(sm = 6L'/4.25 = ml (BERNSTEIN, 1986); Pb = static specific resistance of blood ( ~ c m ) = 135 ~ c m for SV(Io (QUAIL et al., 1981); 6 = ~/(BMIp/24 kg m-2), where BMIp = patient body mass index (kg m - 2), 24 kg m - 2 = ideal BMI for SV(sm; L = the measured thoracic length between voltage sensing electrodes (cm), approximated as 17% of measured patient height (0.17×H)(cm) for equations K, S and SB (BERNSTEIN, 1986; VAN DER MEER et al., 1996; VAN DE WATER et al., 2003); Z0 = the measured transthoracic quasistatic base impedance (~); dZ/dtma x = the peak first timederivative of the transthoracic cardiogenic impedance pulse variation ( ~ s -1) for equations K, S and SB; TLve = left ventriculax ejection time (s). 2.1.4 New ICG SV equation N (Bernstein)
svN-
V1TSV /dZ(t)/dt . . . . .
V
(4)
Z
where SVN = ml; Vc = Virev/( 2 = ml; VITBV 16W 1"°2 = intra-thoracic blood volume = ml; W = body weight (kg). =
Z2c- ZcZo + K = 2Z2c + Z2o - 3ZcZo + K (dimensionless)
(5)
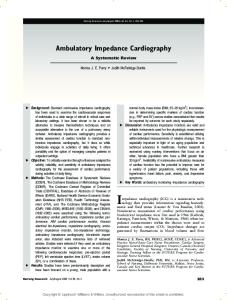
Fig. 1 Schematic diagram of multi-compartment parallel conduction model of thorax. Transthoracic electrical impedance Z(t) ([2) to applied AC field represents parallel connection of quasistatic base impedance Zo ([2) and dynamic, time-dependent component of blood resistance Azb(t) (aQ). Zo represents parallel connection of all static tissue impedances Zt ([2) and static component of blood impedance Zb ([2). In disease states characterised by excess EVLW, quasi-static impedance Z e ([2) is added in parallel with Z t and Z b. Voltmeter (U) and AC generator (~) are shown
444
where ( = index of transthoracic aberrant conduction; Z0 = measured transthoracic quasi-static base impedance (~); Zc = 2 0 ~ = the critical level of base impedance; and K~0. For all Z 0 < 2 0 ~ , 0 < ~ ' < 1. For all Z 0 > 2 0 ~ , = 1; dZ/dtma x = peak first time-derivative, peak slope, or maximum time-rate of change of the transthoracic caxdiogenic impedance pulse variation ( ~ s-2); ~/[(dZ/dtmax)/Zo] = ICG acceleration step-down transformation (s-l); TLvE=left ventriculax ejection time (s).
(a) Excluding the effect of pulmonary ventilation, the transthoracic electrical impedance Z(t) (~) to an applied alternating current (AC) field is considered the parallel connection of a quasi-static DC component Z0 (~) and a dynamic, cardiogenically induced, pulsatile AC component AZ(t) (VISSER et al., 1987; 1990) (Fig. 1). (b) Z0 is considered the parallel connection of a highly conductive cylindrical blood resistance Rb (~) (i.e. Zb), embedded within a thoracic-encompassing, poorly conductive cylindrical tissue impedance Zt (~) (VISSER et al., 1990) (Fig. 1). (c) AZ(t) is a composite signal comprising a velocityinduced, blood 'resistivity'-based component AZv(t) ( ~ s -1) (i.e. Apb(t), ~ c m s -1) and a component of equal magnitude, related to pressure-induced, compliancemodulated, vessel volume changes AZvol(t) (A~(t)) (SAKAMOTO and KANAI, 1979; VISSER, 1989; VISSER et al., 1990; KOSICKI et al., 1986). (d) The peak first time-derivative of AZ(t), dZ/dtmax ( ~ s-2), is bio-electrically equivalent to the peak rate of change of the blood resistivity component of AZ(t); that is, dpb(t)/ dtmax (i.e. d[Apb(t)]/dtmax) ( ~ c m s-2). (e) In the context of (d), dZ/dtmax is the ohmic image of peak aortic blood acceleration dv/dtmax (cm s-2). (¢) Haemodynamically, dZ/dtmax/Zo (s -2) is the bio-electric analogue of peak aortic reduced average blood acceleration (PARABA) ([dv/dt ....... ]/R)max ( s - )2, this being the quotient of mean acceleration (cm s -2) and the aortic valve radius (cm). (g) dZ/dtmax/Zo must undergo square-root transformation to yield a dimensionless ohmic equivalent of mean aortic blood velocity AZ~(t)max/Zo (s-l). (h) Haemodynamically, AZ~(t)max/Zo, a derived value, is the dimensionless bio-electric analogue of peak aortic reduced average blood velocity (PARABV) (v....... / R)max (s-l), this being the quotient of mean aortic blood velocity and the aortic valve radius (VISSER, 1989). (i) The volume conductor Vc (ml), is bio-electrically equivalent to the blood resistance, Rb, in the absence of excess extra-vascular lung water (EVLW) (ml). (j) The physical embodiment of Rb is, by magnitude, equivalent to the intra-thoracic blood volume (ITBV, VIT~V) (ml). (k) SV is proportional to VITeV through allometric equivalents of body mass (kg). (1) The magnitude of Vc is increased in the presence of excess EVLW (ml). (m) Uncorrected, the magnitude of dZ/dtmax and thus ICGderived SV are inversely related to the magnitude of excess EVLW (CRITCHLEY et al., 2000; RAAIJMAKERS et al., 1998; YOUNG and McQUILLAN, 1993). 2.3 Origin of dZ/dt,,ax through differential analysis If a segment of aorta is considered a cylindrical, thin-walled, blood-filled structure at end-diastole, its impedance Z to an
Medical & Biological Engineering & Computing 2005, Vol. 43
applied AC field, across the measured segment, can be defined as follows:
Z -- pbL2 Vb
(6)
where Pb is the static specific resistance ('resistivity') of blood (~cm); L is the segment of aorta under electrical interrogation (cm); and Vb is the volume (ml) of blood in the aorta over segment L in end-diastole. If, upon ventricular ejection, all variables in (6) become continuously differentiable functions of time, then, using the product and quotient rules, the rate of change of impedance dZ/dt is given as follows:
dZ(t) L2 dpb(t) Pb 2L dL(t) d----~--Vb dt ~ Vb 1 dt (])
pbL2 dVb(t) V{ dt
(2)
pbL 2 dVb(t) - gb2 dtmax
-
~s
(7)
(3)
1
(8)
Equation N assumes dZ/dtmax to coincide in time, and bio-electrically, with derivative (1), relating dZ/dtmax to the peak first time-derivative of the velocity-induced blood resistivity variation d[Apb(t)]/dt . . . . and thus to dv/dtm~x. Therefore
dZ(t) dtina×
L 2 dpb(t ) - Vb dtma×
--
~s
2
(9)
To obtain ohmic mean velocity, which is the required variable in SV calculation, it is assumed that dZ/dtmax, normalised by its base impedance Z0, must undergo a squaxe-root transformation. Thus ohmic mean velocity = . ~/~/dt
. . . .
- -
s 1
(10)
VZ0
It is suggested that (10) be known as the ICG acceleration stepdown transformation. 2.4 Study design This is a single-measurement, prospectively designed study, implementing a new SV equation N, which derived and had parameters set prior to data collection. performance of equation N is compared with the K, S SB equations, using TDCO as the reference standard.
Each patient had a pulmonary artery catheter placed prior to the induction of anaesthesia. Within 24 h after the end of surgery, a minimum of five TD measurements were sequentially obtained from each patient. TD curves were inspected for normal upstroke and decay morphology. The injectate consisted of 10 ml ambient temperature 5% dextrose in water. TD injections were made at end-expiration. Each TD data point consisted of the average of five satisfactory TD injections, which represented a single measurement. 2.8 ICG measurements ICG measurements used in this study, including the ratio
Conceptually, SV equations K, S and SB implement the peak first time-derivative of derivative (3), relating dZ/dtmax to the peak rate of change of the aortic volume variation dV/dtmax (ml s-l). Thus
dZ(t) dtmax
2.7 Thermodilution cardiac output (TDCO) measurements
CO was The and
2.5 Consent This study was approved by the Institutional Review Board (IRB) of Palomar Medical Center, Escondido, California, USA. Informed, written consent was obtained for each patient. 2.6 Patients and exclusion criteria One hundred and six post-operative cardiac surgery patients, 72 males and 34 females, between the ages of 33 and 90 years were studied. Procedures included CABG, aortic and mitral valve replacement, or combinations thereof. Exclusion criteria included AV sequential cardiac pacing, IABP therapy, atrial fibrillation, known valvulopathy, intra-cardiac shunts and abnormal patient cervical anatomy.
Medical & Biological Engineering & Computing 2005, Vol. 43
dZ/dtmax/Zo, and base impedance Z0, were obtained from a commercially available impedance cardiograph*, the AC output of which is rated at 2.5 mA RMS, at 70 kHz. Impedance measurements were obtained from each patient by placement of eight proprietary spot-electrodes t on the neck and lower thorax, as specified by the manufacturer. ICG measurements and the ECG signals were deemed acceptable, if verified by visual notification from the signal processor, and as physically displayed on the device's view screen. Impedance parameters were signal-averaged by the device over 30 acceptable beats, displayed every 10 beats and electronically stored over the period of TD measurements. Data were subsequently retrieved and printed in hard copy for statistical analysis. For each TD study period, which comprised the time interval for five sequentially obtained acceptable TDCO measurements, an average value for dZ/dtm~x/Zo and Z0 was computed. 2.9 Left ventricular ejection time TLvE Left ventricular ejection time TLvE (s) was obtained from radial intra-axterial pressure pulse tracings. TLvE was measured as the interval from a point at the diastolic nadir to the dicrotic notch. If a distinct notch was not present, then the change in slope before the diastolic pressure decay was taken as the end of ejection. If no change in slope was detected, then the end of ejection was taken as the first zero-crossing. Stripchart recorded pressure tracings were obtained at 50 mm s -1 paper speed and photocopy-enlaxged for ease of assessment. 2.10 Cardiac output calculation by ICG CO for each patient was calculated as the product of equations K, S, SB and N, respectively, and heart rate: SVIcG × HR = CO. 2.11 Data analysis For this study, where n = 106 data points, each data point represented the paired estimates of simultaneously obtained TDCO and ICG CO for one patient during a single measurement period. Data were presented as means and standard deviations. One-way repeated measures of analysis of variance (ANOVA) were used to determine statistically significant differences between the different methods of CO measurement. The Tukey test was used for post hoc comparisons. A power analysis (BAUSEL and LI, 2002) indicated that approximately 100 subjects would result in an 80% chance of obtaining statistical significance, assuming an effect size of 0.25. Spearman correlation Rs and regression analysis (CLEVELAND, 1979) were used to examine the association between TDCO and ICG measurements. Bias, precision and limits of agreement *BioZ.com, Cardiodynamics International Corporation, San Diego, CA, USA *BioZTECT
445
between TDCO and ICG methods were investigated by B l a n d Altman analysis (BLAND and ALTMAN, 1986); p < 0.05 was considered statistically significant. All analyses were performed with S-PLUS version 6.2.*
3 Results Demographic data, haemodynamic parameters and impedance variables for the 106 study patients, representing 106 data points, axe presented in Table 1. CO calculated using N (6.06 4- 1.48 1 min -1) was not different from TDCO (5.97 4-1.41 l min-1). By contrast, CO calculated using K (3.70_+ 1.531min-1), S (4.16_+ 1.831min -1) and SB (4.37 4- 1.82 1 min -1) was significantly less than TDCO and N. Scatterplots of TDCO and CO determined with each of the ICG equations are shown in Fig. 2. For the range of CO measurements in this study, the relationship between TDCO and N was linear. For K, S and SB, the relationship with TDCO was non-lineax, with most of the data points below the line of identity. In the correlation analysis, Rs was highest for N. B l a n d - A l t m a n analysis showed poor agreement between TDCO and K, S and SB, but not between TDCO and N (Fig. 3). Bias, precision and limits of agreement are shown in Table 2. The difference (bias) between CO methods is presented as a percentage of the mean CO (i.e. [(TD - ICG)]/[(TD + ICG)/2] × 100). When N was stratified by Z0, patients in whom Z0 > 20 ~ showed better agreement with TDCO than patients in which Z0 < 20 ~ .
4 Discussion Based on the results of this study, there is compelling evidence indicating that the commonly held belief of a volumetric origin of dZ/dtma x is incorrect. Data suggesting that dZ/dtma x is the ohmic analogue of dv/dtma x (acceleration) demonstrate that they correspond in the time domain. Whereas peak flow and, equivalently, dV/dtmax, peak at 100_+50 ms (GARDIN et al., 1984), dv/dtmax and dZ/dtmax peak similarly, and before dV/ dtmax (KUBICEK et al., 1974; RUBAL et al., 1980), at 50_+ 15ms and 60_+20ms, respectively (DEBSKI et al., 1993; MATSUDA et al., 1978; SPENCER et al., 1991; SEITZ and MCILROY, 1988; REITAN et al., 1978; KUSSMAUL et al., 1987). It has also been demonstrated that dZ/dtma x peaks synchronously with the I-wave of the acceleration ballistocardiogram (BCG) (KUBICEK, 1989; MOHAPATRA and HILL, 1977). The I-wave of the acceleration BCG is known to represent the peak acceleratory component of the initial ventriculax impulse during the very early, inertial phase of ventriculax ejection (SEITZ and MCILROY, 1988). Evidence indicating that dZ/dtmax is a mean acceleration equivalent is inferred by the work of VISSER (1989). In an in vitro tube model, it was shown that the relative resistivity change of flowing blood Apb(t)/pb, to an applied AC field is related to an exponential value of the reduced average blood velocity v ....... / R . It is also inferred that the peak value of the relative blood resistivity variation in the aorta Apb(t)max/P b (s -1) is related to an exponential value of P A R A B V (v ....... / R)max. Extrapolating these observations to the relative peak rate of change of the blood resistivity variation dpb(t)/dtm~x/ Pb (s-2), it follows that dZ/dtm~x/Zo is the bio-electric equivalent of P A R A B A [(dv/dt,,,an)/R]m~x. Considering the results of this study, it is suggested that, in part, the systematic underestimation and poor agreement with TDCO, using equations K, S and SB, axe based upon the use of a mean acceleration equivalent of P A R A B A to compute SV. Conversely, the *Insightful Corp., Seattle, WA, USA
446
Table 1 Demographic, haemodynamic and impedance data for 106 patients (72 males, 34 females)
Age, years Height, cm Weight, kg SBP, mmHg DBP, mmHg HR beats min -1 TLvE, s Z0 ~ dZ/dt ..... (see below)
Mean
SD
68 171 79 121 58 97 0.26 22.7 0.661
13 10 17 13 9 13 0.03 6.7 0.309
SBP = systolic blood pressure; DBP = diastolic blood pressure; H R = h e a r t rate; TLvE=left ventricular ejection time; Z0 = transthoracic base impedance; dZ/dtmax = peak first time-derivative of transthoracic cardiogenic impedance pulse variation (~ s -1 for equations K, S and SB; ~ s -2 for equation N)
linear relationship, without systematic bias, using equation N, is due, in part, to conversion of the ohmic mean acceleration equivalent of P A R A B A to an ohmic of mean velocity analogue of P A R A B V by square-root transformation. In conjunction with using ohmic mean velocity for SV calculation, the volume conductor Vc for equation N is allometrically defined as a mass-based approximation of the intra-thoracic blood volume (ITBV). This convention has been adopted, as it has been shown that both SV and total blood volume (TBV) axe linearly and highly correlated with body mass (HOLT et al., 1968; LINDSTEDT and SCHAEFFER, 2002), and that both SV and TBV axe more highly correlated with body mass than with body height (COLLIS et al., 2001; FELDSCHUH and ENSON, 1977). The allometric expression, 1 6 W1 O2, employed in equation N, is a close approximation of 1 7 . 5 m l k g -1, which is a mean indexed value for ITBV (HOFER et al., 2002). As ITBV is primarily determined by TBV in normal individuals, it is assumed that body mass is a more appropriate allometric paxameter than thoracic length or height-based thoracic length equivalents. Conceptually, as opposed to linear-based volume conductors, ITBV is inherently unambiguous in physiological meaning and is intuitively understood as the physical embodiment of the blood resistance Rb. Moreover, in conjunction with global end-diastolic volume, ITBV is the most highly correlated, measured physiological parameter for determining ventricular preload and changes in SV and CO (GOEDJE et al., 1998; BROCK et al., 2002). Justification for (, the index of transthoracic aberrant conduction (5), derives from the assumption that, except for AC flowing through Z,, all residual current must flow through Rb, for accurate SV determination. The underestimation of ICG SV and CO, reported in the presence of excess E V L W (YOUNG and McQUILLAN, 1993; RAAIJMAKERS et al., 1998), is caused by spuriously reduced values of dZ/dtmax (YAMAKOSHIet al., 1977). Underestimations axe attributed to bypassing, or shunting of AC, so that the ITBV (Pb = 140 _+ 40 ~ c m ) is circumvented in favour of the more highly conductive pathways of the plasma-like oedema fluid, herein designated as the impedance Ze (Ppi...... 60-70 ~~cm) (CRITCHLEY et al., 2000) (Fig. 1). Fig. 1 shows that Ze is a potential impedance, aligned in parallel with both Zt and Zb (Rb), thus comprising an element of Z0. For accurate estimations of ICG SV, dZ/dtmax must change proportionally with PARABA. For this to be true, all AC not flowing through Z,, must flow through Rb over a full range of haemodyamic perturbations. By Ohm's law for cylindrical impedances in parallel, if Z~ is of sufficient volume, AC will =
Medical & Biological Engineering & Computing 2005, Vol. 43
10-
o
87
6-
°
"7 E
ff42-
J
Oi
i
i
i
i
i
o~ -°'~ ° °
i
i
i
i
i
i
8'
1'0
b
a
108"To 6E
"T
m403
Z
E
2-
0-
0'
2'
4' 6' TD, I min -1
8'
1'0
0'
2'
4' 6' TD, I min -1 d
C
Fig. 2
Scatterplots of CO obtained by K, S, SB and N against thermodilution CO (TD). (--) Line of identity. ( - - - ) smooth through data obtained by locally weighted regression. Rs-non-parametric Spearman correlation coefficient. For all four comparison studies, n = 106 data points. (a) Kubicek: R~ = 0.46 (P < 0.0001); (b) Sramek R~ = 0.51 (P < 0.0001); (c) Sramek-Bernstein: R~ = 0.6 (P < 0.0001); (d) new equation: R s = 0.78 (P < 0.0001)
150-
O +2SD ......... ~"'~'6"
/ +2SD
.............................
f-,
OO
o~
........
eao ~" +
+oo;
~ ' 4 mean
50
o~°oo~oO
0- :.~2. ~. .........
o o
~/
I
.
.
.
.
.
.
.
.
.
.
.
.
.
.
.
.
.
.
.
.
.
.
.
.
.
O
o~o%45
~]-2SD
g......~7. ..... o. ..... ~ ..............
.
O Oc,..~q~O
o ~8"-o
o
"~
o
~b
~ ..................... ~ ...... o ~ . . . . . . . . . . . . . .
O 100 i
i
i
i
i
i
i
i
a
i
i
b
150-
+2sD ~
o oo
.
.......... ~"~'~o 50" mean
+
~0
.
.
.
.
.
.
.
.
.
.
.
.
.
.
.
.
.
.
.
.
.
.
.
.
.
.
.
.
.
.
o
O~)~~.t,
O ,.+.2..s2 . . . . . .
~oo o~,~
2SD
.
mean
O
O
~"
.0. . . . .
~
~
9.
~
.......................
E
..~.s~ . . . . . . . . o ~ . . . ~ . ~ ~ .
O
° ..........
100 2
, 4, 6, 8, 10 average CO by two methods, I min -1
2,
c
Fig. 3
Medical
1'0 4, 6, 8, average CO by two methods, I min 1 d
Bland-Altman analysis. Comparison of CO (1 min -1) determinations using Bland-Altman analysis shows poor agreement between TD and (a) Kubicek, (b) Sramek and (c) Sramek-Bernstein equations, but not with (d) new equation. Difference (bias) between CO methods on y-axis is expressed as percentage of mean CO (i.e.[(TD - ICG)/(TD + ICG)/2] × 100 = %. Average CO is given in 1 min -1. For all four comparison studies, n = 106 & Biological
Engineering
& Computing
2005,
Vol.
43
447
Table 2 Bland-Altman analysis 95% limits of agreement
TDCO against ICG* K S SB N (all patients) N (Z0 _> 20 l~, n = 78) N (Z0 < 20 l~, n = 28)
Bias, %
Precision, %
upper, %
lower, %
51 41 36 - 1 -2 0
32 34 33 16 13 22
113 108 100 30 24 42
-12 - 26 -28 32 -27 -43 -
*Difference as % of mean: (TDCO -ICG)/((TDCO + ICG)/2), % preferentially flow through the lower impedance at the expense of Rb, thereby voiding the otherwise monotonic proportionality of dZ/dtmax/Zo and PARABA. Underestimation of reference method SV and CO is reported to occur at Z0 < 20 _+ 5 ~ (CRITCI-ILEY et al., 2000), which is dependent on pre-morbid Z0, body habitus, gender, age and the frequency of the applied AC (METRY et al., 1997; KHAN et al., 1977). For purposes of this study, and until being further quantifiable, Zc, the critical level of Z0 below which shunting occurs, is assigned a default value of 20 ~ . Descriptively, ~ is a progressively diminishing function that augments the magnitude of Vc by the addition of E V L W (i.e. g C = VITBV-{- V E V L W = VITBV/~2). As can be seen by stratifying patients for Z0 (Table 2), overall agreement with TDCO is much better when Z0 > 2 0 ~ ( n = 78), than when Z0 < 2 0 ~ (n = 28). This disparity, no doubt, is due to the sweeping assumption that Zc = 20~. Despite this deficiency, for all values of equation N with Z0 < 20~, bias, precision and the range of limits of agreement are still better than those of the K, S and SB equations. Clearly, however, to improve the accuracy of equation N, patient-specific values for Zc are necessary. Apart from errors imposed by the operational aspects of the impedance technique, and the assumptions of equation N, computer-generated signal-processing errors account for errors in point B (aortic valve opening) and point X (aortic valve closure) detection on the dZ/dt signal and therefore errors in the magnitude of dZ/dtm~x and TLVE (DEBSKI et al., 1993; ONO et al., 2004). For this study, one source of potential error TLVE was minimised by measurement of the verifiable ejection times obtained from arterial pressure pulse tracings. It is not known, however, what degree of error was imposed on equations K, S, SB, and N by computer-generated values for dZ/dtmax. When assessing the accuracy of one CO method over another, it should be clearly understood that there is no true 'gold-standaxd' for blood flow in clinical medicine (DHINGRA et al., 2002; SHERMAN et al., 1997; AXLER et al., 1996). TDCO, for example, is known to possess many sources of error (LEVETT and REPLOGLE, 1979; NISHIKAWA and DOHI, 1993), routinely causing a 1 5 - 2 0 % deviation from actual flow, or more, in the critically ill, ventilated patient (JANSEN, 1995; DHINGRA et al., 2002; SHERMAN et al., 1997; AXLER et al., 1996). In response to these issues, CRITCHLEY and CRITCHLEY (1999) recently proposed that limits of agreement up to + 30%, between TDCO and ICG, constitute equivalent accuracy. Results of this study, using equation N, fall just within these parameters.
5 Conclusions The results of this study indicate that, compared with TDCO, CO determination using equation N is superior to equations K,
448
S and SB in post-operative cardiac surgical patients. The remarkable finding in this study, however, is not that the results of equation N compared with TDCO axe satisfactory, but rather that equation N produces results so vastly improved over those of equations K, S and SB. The improved results, using equation N, suggest that (i) dZ/dtm~x is a blood resistivity-based mean acceleration equivalent (ii) squaxe-root transformation of dZ/dtmax/Zo is required to obtain ohmic mean velocity (iii) body mass is probably a better allometric parameter for defining Vc (iv) Vc becomes more highly conductive, and of greater magnitude, in pathological states characterised by increased EVLW. Therefore, despite its stipulated limitations, it is suggested that equation N be used in lieu of equations K, S and SB when ICG is implemented for CO determination in the critically ill cardiac patient.
Acknowledgments--The authors wish to acknowledge Dr Robert T. Reichman's kind permission to study his patients, and the contribution to the graphics of Owen Smigelski.
References AXLER, O., TOUSIGNANT, C., THOMPSON, C. R., DALL'AVASANTUCCI, J., PHANG, P. T., RUSSELL, J. A., and WALLEY, K. R. (1996): 'Comparison of transesophageal echocardiographic, tick, and thermodilution cardiac output in critically ill patients', J. Crit. Care, 11, pp. 109 116 BAUSEL, R. B., and LI, F. (2002): 'Power analysis for experimental research: A practical guide for the biological, medical and social sciences' (Cambridge University Press, Cambridge, UK, 2002), pp. 179 238. BERNSTEIN, D. P. (1986): 'A new stroke volume equation for thoracic electrical bioimpedance: theory and rationale', Crit. Care Med., 14, pp. 904 909. BLAND, J. M., and ALTMAN, D. G. (1986): 'Statistical methods for assessing agreement between two methods of clinical measurement', Lancet, 1, pp. 307 310. BROCK, H., GABRIEL,C., BIBL, D., and NECEK, S. (2002): 'Monitoring intravascular volumes for postoperative volume therapy', Eur. J. Anaesthesiol., 19, pp. 288 294. CLEVELAND,W. S. (1979): 'Robust locally weighted regression and smoothing scatterplots', J. Am. Stat. Assoc., 74, pp. 829 836. COLLIS, T., DEVEREUX, R. B., ROMAN,M. J., DE SIMONE,G., YEH, J., HOWARD, B. V., FABSITZ, R. R., and WELTY, T. K. (2001): 'Relations of stroke volume and cardiac output to body composition: the strong heart study', Circulation, 103, pp. 820 825. CRITCI-ILEY,L. A., and CRITCI-ILEY,J. A. (1999): 'A meta-analysis of studies using bias and precision statistics to compare cardiac output measurement techniques', J. Clin. Monit. Comput., 15, pp. 85 91. CRITCHLEY, L. A., CALCROFT, R. M., TAN, P. Y., KEW, J., and CRITCHLEY,J. A. (2000): 'The effect of lung injury and excessive lung fluid, on impedance cardiac output measurements, in the critically ill', Intensive Care Med., 26, pp. 679 685. DEBSKI, T. T., ZHANG, Y., JENNINGS, J. R., and KAMARCK, T. W. (1993): 'Stability of cardiac impedance measures: aortic opening (B-point) detection and scoring', Biol. Psychol., 36, pp. 63 74. DHINGRA, V. K., FENWlCK, J. C., WALLEY, K. R., CHITTOCK, D. R. and RONCO, J. J. (2002): 'Lack of agreement between thermodilution and tick cardiac output in critically ill patients', Chest, 122, pp. 990 997. FELDSCHUH,J., and ENSON, Y. (1977): 'Prediction of the normal blood volume. Relation of blood volume to body habitus', Circulation, 56, pp. 605 612.
Medical & Biological Engineering & Computing 2005, Vol. 43
GARDIN,J. M., BURR, C. S., CHILDS,W. J., and HENRY,W. L. (1984): 'Evaluation of blood flow velocity in the ascending aorta and main pulmonary artery of normal subjects by Doppler echocardiography', Am. Heart J., 107, pp. 310 319. GENONI,M., PELOSI, P., ROMAND,J. A., PEDOTO, A., MOCCETTI, T., and MALACRIDA, R. (1998): 'Determination of cardiac output during mechanical ventilation by electrical bioimpedance or thermodilution in patients with acute lung injury: effects of positive end-expiratory pressure', Crit. Care Med., 26, pp. 1441 1445. GOEDJE, O., PEYERL, M., SEEBAUER, P., LAMM, P., MAIR, H., and REICHART, B. (1998): 'Central venous pressure, pulmonary capillary wedge pressure and intrathoracic blood volume as preload indicators', Eur. J. Cardiothorac. Surg., 13, pp. 533 559. HOFER, C. K., ZALUNARDO, M. P., KLAGHOFER, R., SPAHR, T., PASCH, T., and ZOLLINGER, A. (2002): 'Changes in intrathoracic blood volume associated with pneumoperitoneum and positioning', Acta Anaesthesiol. Scand., 46, pp. 303 308. HOLT, J. P., RHODE, E. A., and KINES, H. (1968): 'Ventricular volumes and body weight in mammals', Am. J. Physiol., 21S, pp. 704 715. JANSEN, J. R. (1995): 'The thermodilution method for the clinical assessment of cardiac output', Intens. Care Med., 21, pp. 691 697. KHAN, M. R., GUHA, S. K., TANDON, S., and RoY, S. B. (1977): 'Quantitative electrical-impedance plethysmography for pulmonary oedema', Med. Biol. Eng. Comput., 1S, pp. 627 633. KOSICKI, J., CHEN, L. H., HOBBIE, R., PATTERSON, R., and ACKERMAN,E. (1986): 'Contributions to the impedance cardiogram waveform', Ann. Biomed. Eng., 14, pp. 67 80. KUBICEK, W. G., KARNEGIS,J. N., PATTERSON,R. P., WITSOE, D. A., and MATTSON, R. H. (1966): 'Development and evaluation of an impedance cardiac output system', Aerosp. Med., 37, pp. 1208 1212. KUBICEK, W. G., KOTrKE, J., RAMOS, M. U., PATTERSON, R. P., WITSOE, D. A., LABREE, J. W., REMOLE, W., LAYMAN, T. E., SCHOENING, H., and GARAMELA, J. T. (1974): 'The Minnesota impedance cardiograph-theory and applications', Biomed. Eng., 9, pp. 410 416. KUBICEK, W. G. (1989): 'On the source of peak first time derivative (dZ/dt) during impedance cardiography', Ann. Biomed. Eng., 17, pp. 459 462. KUSSMAUL, W. G., KLEAVELAND,J. P., MARTIN, J. L., HIRSHFELD, J. W. Jr, and LASKEY,W. K. (1987): 'Effects of exercise and nitroprusside on left ventricular ejection dynamics in idiopathic dilated cardiomyopathy', Am. J. Cardiol., $9, pp. 647 655. LEVETT,J. M., and REPLOGLE,R. L. (1979): 'Thermodilution cardiac output: a critical analysis and review of the literature', J. Surg. Res., 27, pp. 392 404. LINDSTEDT, L., and SCHAEFFER,P. J. (2002): 'Use of allometry in predicting anatomical and physiological parameters of mammals', Lab. Anita., 36, pp. 1 19. MATSUDA, Y., YAMADA, S., KUROGANE,H., SATO, H., MAEDA, K., and FUKUZAKI,H. (1978): 'Assessment of left ventricular performance in man with impedance cardiography', Jpn. Circ. J., 42, pp. 945 954. METRY, G., WIKSTROM, B., LINDE, T., and DANIELSON, G. (1997): 'Gender and age differences in transthoracic bioimpedance', Acta Physiol. Scand., 161, pp. 171 175. MOHAPATRA, S. N., and HILL, D. W. (1977): 'Investigation into the origin and application of the electrical impedance technique', in MOHAPATRA,S. N. (Ed.): 'Non-invasive cardiovascular monitoring by electrical impedance technique' (Pitman Medical Limited, London, UK, 1981), p.41. NEWMAN, D. G., and CALLISTER, R. (1999): 'The non-invasive assessment of stroke volume and cardiac output by impedance cardiography: a review', Aviat. Space Environ. Ned., 70, pp. 780 789. NISHIKAWA, T., and DOHI, S. (1993): 'Errors in the measurement of cardiac output by thermodilution', Can. J. Anaesth., 40, pp. 142 153. NYBOER, J. (1950): 'Electrical impedance plethysmography; a physical and physiologic approach to peripheral vascular study', Circulation, 2, pp. 811 821. ONO, T., MIYAMURA,M., YASUDA,Y., ITO, T., SAITO, T., ISHIGURO, T., YOSHIZAWA, M., and YAMBE, T. (2004): 'Beat-to-beat
Medical & Biological Engineering & Computing 2005, Vol. 43
evaluation of systolic time intervals during bicycle exercise using impedance cardiography', Tohoku J. Exp. Ned., 203, pp. 17 29. OVSYSHCHER,I., and FURMAN, S. (1993): 'Impedance cardiography for cardiac output estimation in pacemaker patients: review of the literature', Pacing Clin. Electrophysiol., 16, pp. 1412 1422. PENNEY, B. C. (1986): 'Theory and cardiac applications of electrical impedance measurements', Crit. Rev. Biomed. Eng., 13, pp. 227 281. QUAIL, A. W., TRAUGOTT, F. M., PORGES, W. L., and WHITE, S. W. (1981): 'Thoracic resistivity for stroke volume determination in impedance cardiography', J. Appl. Physiol., SO, pp. 191 195. RAAUMAKERS,E., FAES, T. J., KUNST, P. W., BAKKER, J., ROMMES, J. H., GOOVAERTS,H. G., and HEETHAAR,R. M. (1998): 'The influence of extravascular lung water on cardiac output measurements using thoracic impedance cardiography', Physiol. Neas., 19, pp. 491 499. RAAIJMAKERS,E., FAES, T. J., SCHOLTEN, R. J., GOOVAERTS, H. G., and HEETHAAR, R. M. (1999): 'A meta-analysis of three decades of validating thoracic impedance cardiography', Crit. Care Ned., 27, pp. 1203 1213. REITAN, J. A., WARPINSKI,M. A., and MARTUCCI, R. W. (1978): 'Determinants and genesis of canine pneumocardiogram', Anesth. Analg., $7, pp. 653 662. RUBAL, B. J., BAKER, L. E., and PODER, T. C. (1980): 'Correlation between maximum dZ/dt and parameters of left ventricular performance', Ned. Biol. Eng. Comput., 18, pp. 541 548. SAKAMOTO,K., and KANAI, H. (1979): 'Electrical characteristics of flowing blood', IEEE Trans. Biomed. Eng., 26, pp. 686 695. SEITZ, W. S., and MCILROY, M. B. (1988): 'Interpretation of the HJ interval of the normal ballistocardiogram based on the principle of conservation of momentum and aortic ultrasonic Doppler velocity measurements during left ventricular ejection', Cardiovasc. Res., 22, pp. 571 574. SHERMAN,M. S., KOSINSKI,R., PAZ, H. L., and CAMPBELL,D. (1997): 'Measuring cardiac output in critically Ill patients: disagreement between thermodilution-, calculated-, expired gas-, and oxygen consumption-based methods', Cardiology, 88, pp. 19 25. SHOEMAKER, W. C., WO, C. C., CHAN, L., RAMICONE, E., KAMEL, E. S., VELMAHOS,G. C., and BELZBERG, H. (2001): 'Outcome prediction of emergency patients by noninvasive hemodynamic monitoring', Chest, 120, pp. 528 537. SPENCER, K. T., LANG, R. M., NEUMANN, A., BOROW, K. M., and SHROFF, S. G. (1991): 'Doppler and electromagnetic comparisons of instantaneous aortic flow characteristics in primates', Circ. Res., 68, pp. 1369 1377. VAN DER MEER, B. J., WOLTJER, H. H., SOUSMAN, A. M., SCHREUDER, W. O., BULDER, E. R., HUYBREGTS, M. A., and DE VRIES, P. M. (1996): 'Impedance cardiography. Importance of the equation and the electrode configuration', Intensive Care Med., 22, pp. 1120 1124. VAN DE WATER, J. M., MILLER, T. W., VOGEL, R. L., MOUNT, B. E., and DALTON,M. L. (2003): 'Impedance cardiography: the next vital sign technology?', Chest, 123, pp. 2028 2033. VISSER, K. R., LAMBERTS, R., and ZIJLSTRA,W. G. (1987): 'Investigation of the parallel conductor model of impedance cardiography by means of exchange transfusion with stroma free haemoglobin solution in the dog', Cardiovasc. Res., 21, pp. 637 645. VISSER, K. R. (1989): 'Electric properties of flowing blood and impedance cardiography', Ann. Biomed. Eng., 17, pp. 463 473. VISSER, K. R., LAMBERTS, R., and ZIJLSTRA,W. G. (1990): 'Investigation of the origin of the impedance cardiogram by means of exchange transfusion with stroma free haemoglobin solution in the dog', Cardiovasc. Res., 24, pp. 24 32. WOLTJER, H. H., BOGAARD, H. J., and DE VRIES, P. M. (1997): 'The technique of impedance cardiography', Eur. Heart J., 18, pp. 1396 1403. YAMAKOSHI, K., TOGAWA, T., and ITO, H. (1977): 'Evaluation of the theory of cardiac-output computation from transthoracic impedance plethysmogram', Ned. Biol. Eng. Comput., 1S, pp. 479 488. YOUNG, J. D., and McQUILLAN, P. (1993): 'Comparison of thoracic electrical bioimpedance and thermodilution for the measurement of cardiac index in patients with severe sepsis', Br. J. Anaesth., 70, pp. 58 62.
449
Authors" biographies DR. BERNSTEIN is an attending anesthesiologist at Palomar Medical Center, Escondido, California. He received his Doctor of Medicine degree at the George Washington University School of Medicine, Washington, D.C. in 1968. Subsequently, he completed post graduate residency training in Anesthesiology at the Stanford University School of Medicine in 1973. Dr. Bernstein's research interests are in the field of impedance cardiography and haemodynamics, with a special emphasis on analytical equation development.
450
DR. LEMMENS is an associate professor of anesthesia at Stanford University Medical Center, where he is chief of liver transplant anesthesia. Prior to joining Stanford in 1991, Dr. Lemmens was with the Department of Anesthesiology at the Leiden University Hospital in the Netherlands. His research interests are the development of models that can be used in drug development and new devices that are utilized in the field of anesthesia and critical care. In 1989 Dr. Lemmens received his Ph.D. in clinical pharmacology at the University of Leiden, the Netherlands.
Medical & Biological Engineering & Computing 2005, Vol. 43