974
ORIGINAL ARTICLE
Knee Muscle Strength, Gait Performance, and Perceived Participation After Stroke Ulla-Britt Flansbjer, PT, MSc, David Downham, PhD, Jan Lexell, MD, PhD ABSTRACT. Flansbjer U-B, Downham D, Lexell J. Knee muscle strength, gait performance, and perceived participation after stroke. Arch Phys Med Rehabil 2006;87:974-80. Objective: To assess the relation between knee muscle strength, gait performance, and perceived participation in subjects with chronic mild to moderate poststroke hemiparesis. Design: Descriptive analysis of convenience sample. Setting: University hospital. Participants: Fifty men and women (mean age, 58⫾6.4y) 6 to 46 months poststroke. Interventions: Not applicable. Main Outcome Measures: Isokinetic concentric knee extension and flexion strength was measured at 60°/s. Gait performance was assessed by Timed Up & Go, comfortable and fast gait speed, stair climbing ascend and descend, and 6-minute walk test. Perceived participation was assessed with the Stroke Impact Scale. Results: There was a significant correlation (P⬍.01) between knee muscle strength and gait performance for the paretic but not for the nonparetic lower limb. Strength for the paretic limb explained 34% to 50% of the variance in gait performance; the addition of strength for the nonparetic limb explained at most a further 11% of the variance in gait performance. There was a significant correlation (P⬍.01) between gait performance and perceived participation; gait performance explained 28% to 40% of the variance in perceived participation. Conclusions: Knee muscle strength is a moderate to strong predictor of walking ability in individuals with chronic mild to moderate poststroke hemiparesis. Walking ability influences perceived participation, but the strengths of the relations indicate that other factors are also important. Key Words: Cerebrovascular accident; Gait; Muscle, skeletal; Rehabilitation. © 2006 by the American Congress of Rehabilitation Medicine and the American Academy of Physical Medicine and Rehabilitation
From the Department of Rehabilitation, Lund University Hospital, Lund, Sweden (Flansbjer, Lexell); Department of Health Sciences, Division of Geriatric Medicine, Lund University, Malmö, Sweden (Flansbjer); Department of Mathematical Sciences, University of Liverpool, Liverpool, England (Downham); and Department of Health Sciences, Luleå University of Technology, Luleå, Sweden (Lexell). Supported by the Norrbacka-Eugenia Foundation, the Swedish Stroke Association, Magnus Bergvall Foundation, the Swedish Association of Neurologically Disabled, the Swedish Society of Medicine, Gun and Bertil Stohne Foundation, the Crafoord Foundation, the Council for Medical Health Care Research in South Sweden, and Skane County Council’s Research and Development Foundation. No commercial party having a direct financial interest in the results of the research supporting this article has or will confer a benefit upon the authors or upon any organization with which the authors are associated. Reprint requests to Ulla-Britt Flansbjer, PT, MSc, Dept of Rehabilitation, Lund University Hospital, Orupssjukhuset, 221 85 Lund, Sweden, e-mail: ulla-britt.flansbjer@ skane.se. 0003-9993/06/8707-10390$32.00/0 doi:10.1016/j.apmr.2006.03.008
Arch Phys Med Rehabil Vol 87, July 2006
TROKE IS AMONG the most common neurologic disorS ders and impacts on all domains in the International Classification of Functioning, Disability and Health (ICF). One of 1
the main impairments after stroke is reduced muscle strength.2 This poststroke muscle weakness is a major contributor to activity limitations related to mobility. Several studies have shown that muscle weakness after stroke correlates significantly with measures of gait performance.3 The reduction in gait performance, in turn, may prevent the resumption of activities of daily living,4 which can have an adverse effect on perceived participation, that is, the involvement in a life situation.1,5-7 Walking is among the most important domains of the activities and participation components in ICF core set for stroke.8 A major aim of stroke rehabilitation is therefore to optimize the recovery of muscle function in order to regain walking ability9 and thereby support patients’ attempts to participate in everyday activities.5 One component of stroke rehabilitation that has gained increased interest in recent years is progressive resistance training, using free weights or specific strength training equipment with loads of 80% or more of 1 repetition maximum.3,10 Different muscles in the lower limb can be trained, but the knee extensors and flexors have most often been included in the protocols. Although several questions about progressive resistance training remain to be answered, it is clearly an efficient way to improve muscle strength in subjects with chronic stroke2,3,10 as well as in healthy older persons.11,12 To be clinically important, this training regimen should improve not only knee muscle function but also walking ability and perceived participation after stroke. Currently, we have very limited data demonstrating that strength gains influence walking ability and participation in a meaningful way.3,10 It follows that we need a thorough understanding of the relationships between knee muscle function, walking ability, and participation after stroke. The relation between knee muscle function and walking ability has been investigated in several studies.13-21 There is generally a moderate to strong relation between the knee extensor and flexor strength in the paretic limb and gait performance.13-16,18,20,21 Muscle strength in the nonparetic lower limb can also be affected after stroke,19,22 but it is less clear to what extent it contributes to reduced walking ability after stroke.13,15,18-20 Because participation has recently replaced the term handicap in the ICF,1 there is very limited knowledge of the relation between participation and other components in the ICF. One study6 has addressed the relation between gait performance and satisfaction with participation in community and family activities poststroke, using the Reintegration to Normal Living (RNL) index.23 Approximately 1 year poststroke, endurance (assessed by the 6-minute walk test [6MWT]) was the only significant determinant of integration into the community.6 Thus, further studies are needed to address how participation is related to gait performance after stroke. The aim of this study was to determine the relation between knee extension and flexion strength, gait performance, and
POSTSTROKE STRENGTH, GAIT, AND PARTICIPATION, Flansbjer
perceived participation in subjects with chronic mild to moderate poststroke hemiparesis. METHODS Participants We recruited a total of 50 community-dwelling subjects to the study. All subjects had been treated in the Comprehensive Integrated Rehab Unit at the Department of Rehabilitation, Lund University Hospital over the period 2000 to 2002. The inclusion criteria were: (1) a minimum of 6 months and a maximum of 48 months poststroke (only cortical and subcortical); (2) residual hemiparesis at discharge from interdisciplinary rehabilitation services; (3) at the time of the study, no medication, cognitive dysfunction, neglect, visual deficit, depression, or other physical or mental diseases that could impact on knee muscle strength, gait performance, or perceived participation; (4) able to understand both verbal and written information; and (5) able to walk without supervision at least 300m with or without a unilateral assistive device. The Ethics Research Committee of Lund University, Lund, Sweden, approved the study. Prior to testing, all subjects were medically checked by the responsible physician (JL) and completed a questionnaire, which provided demographic and medical information. To characterize the group, each subject was interviewed and scored with the FIM motor domain (Swedish version)24 prior to the first test session. A majority (94%) of the subjects were rated independent or modified independent, with a median for the FIM motor score of 87 (74/91). The occurrence of increased muscle tone in the paretic lower limb was assessed with the Modified Ashworth Scale (MAS) prior to each of the 2 test sessions.25 The tested muscle groups were: hip adductors, hip extensors and flexors, knee extensors and flexors, and ankle dorsiflexors and plantarflexors. Most subjects had low or no increased muscle tone (median value, 1). At each test session 19 to 23 subjects were scored 0, and 7 subjects had a score higher than 3 (maximum total score for the paretic lower limb was 35). There were small differences between the test sessions; the mean MAS score for the different test sessions varied from 1.48 to 1.64 (range, 0 – 8). This is consistent with recent findings that spasticity is present in a minority of hemiparetic stroke patients and rare in those with mild to moderate disability.26 Knee Muscle Strength We obtained isokinetic concentric knee muscle strength measurements using a Biodex Multi-Joint System II isokinetic dynamometera with the Biodex advantage software, version 4.0.a The standard Biodex knee unit attachment was used. Each subject was seated in the adjustable chair of the dynamometer, sitting with back support and hip flexion 85°. The dynamometer was positioned so that the lateral knee joint line was aligned with the movement axis of the dynamometer. The subject was firmly stabilized with straps across the shoulders, waist, and thigh. The ankle cuff of the lever arm was strapped 3cm proximal to the malleoli of the tested leg. Subjects sat with folded arms throughout the test. Before each measurement the full range of motion (ROM) was set. All subjects had full passive ROM in both knee joints. To account for the influence of the gravity effect torque on the data, each subject’s lower limb was weighed and the Biodex software corrected the data. It has been reported that stroke patients cannot perform at higher angular velocities due to spastic antagonist restraints.27 Studies of concentric knee muscle strength measurements in chronic stroke patients have therefore used low angular veloc-
975
ities (30°⫺90°/s).28-30 All subjects in the present study had a fairly good motor recovery and could perform the concentric contractions at the low velocity (60°/s). Thus, all subjects exhibited isolated movements without clinically evident synergies. This is consistent with recent findings that hemiplegic limb synergies are very rare in hemiparetic stroke patients.31 Concentric knee muscle strength measurements at 60°/s in chronic stroke patients have also been found to be highly reliable (intraclass correlation coefficient model 2,1 [ICC2,1] range, .89⫺.94; standard error [SE] of measurement, 7%⫺12%; smallest real difference, 26%⫺48%).32 After a structured warm-up, each subject performed, in succession, 3 maximal concentric knee extension and flexion contractions of the nonparetic lower limb at 60°/s. After a 5-minute rest the same procedure was performed with the paretic lower limb. Throughout the tests, subjects were asked to push and pull as hard and fast as possible. The maximal peak torque (in newton meters) from each mode, for the paretic and the nonparetic lower limb, was recorded. Gait Performance We assessed gait performance by 6 tests: the Timed Up & Go (TUG), comfortable and fast gait speed, stair climbing ascend and descend, and 6MWT. These 6 gait performance tests have been found to be highly reliable in men and women with mild to moderate poststroke hemiparesis (ICC2,1 range, .94⫺.99; SE of measurement, ⬍9%; smallest real difference, 13%⫺23%).33 For the TUG,34 each subject sat in a chair (seat height, 44cm; depth, 45cm; width, 49cm; armrest height, 64cm) placed at the end of a marked 3-m walkway. Subjects were instructed to sit with their back against the chair and on the word “go,” stand up, walk at a comfortable speed (“like fetching something in your kitchen”) past the 3-m mark, turn around, walk back, and sit down in the chair. The times were measured in seconds. For comfortable and fast gait speed, subjects were timed in a corridor. The total distance was 14m and the subjects were timed over the middle 10m. Subjects were informed that they would be timed for part of the 14-m walkway. For comfortable gait speed, subjects were told to walk at a self-selected comfortable pace (“like walking in the park”). For fast gait speed, the subjects were told to walk as fast and safely as possible without running (“like hurrying to reach the bus”). The times in seconds for comfortable and fast gait speed were used to calculate the 2 velocities (in m/s). For stair climbing ascend and descend, subjects were tested on a flight of stairs with 12 steps and rails on both sides. Each step was 135cm wide, 15cm high, and 30cm deep with a black rubber strip around the edge. Subjects were instructed to walk as fast and safely as possible, and preferably in a step-through pattern; 4 subjects walked in a step-to pattern in stair climbing descend and 2 of them also used a step-to pattern in stair climbing ascend. Before starting, each subject decided whether to use the handrail: 36 subjects used the handrail during stair climbing ascend and 39 subjects during stair climbing descend. The time (in seconds) from when the first foot left the ground until the second foot touched the ground on the last step was measured for stair climbing ascend and descend separately. For the 6MWT, subjects were instructed to walk 30m between 2 marks in a 2.2m wide corridor. After passing either mark, they were told to turn and walk back. Subjects were also instructed to cover as much ground as possible (“to walk as far as possible during six minutes”). They were allowed to rest and then to continue walking; only 1 subject had to rest. Subjects were informed when 3 minutes of the test remained. The distance covered was measured to the nearest meter. Arch Phys Med Rehabil Vol 87, July 2006
976
POSTSTROKE STRENGTH, GAIT, AND PARTICIPATION, Flansbjer
We gave no verbal encouragement during the gait performance tests. All subjects were independent walkers but were allowed to use, if needed, their ankle-foot orthosis and their assistive device. A digital stopwatch with an accuracy of 0.1 seconds was used to measure time. Perceived Participation Perceived participation was assessed by the Stroke Impact Scale 3.0 (SIS; Swedish version).35 The SIS is a self-report questionnaire that assesses 8 aspects of the impact of a stroke on a person’s self-perceived health: strength; hand function; activities of daily living; mobility; communication; emotion; memory and thinking; and participation. The SIS is administered by a medical professional in an interview of about 15 minutes in duration. All items in the 8 domains are scored on a 5-point scale from 5 (limited none of the time) to 1 (limited all of the time). The mean for each domain is calculated and can be analyzed separately. The SIS has been shown to be both valid and reliable.36-38 The first author (U-BF) scored each subject. As the relation between gait performance and perceived participation was of specific interest, only the data from the SIS participation domain were used in the analyses. SIS participation addresses the impact of stroke on: work; social activities; quiet recreations; active recreations; role as a family member; religious activities; life control; and ability to help others. For each subject, the mean score of these 8 items was calculated as a composite score and converted into a percentage value using the following expression defined by Duncan et al35: 100⫻(the mean value of the 8 items⫺1) ⁄ (5⫺1)
(1)
which yields a value lying in the range 0 to 100. High values represent no or low restriction in participation whereas low values indicate more restricted participation. Procedure Knee muscle strength was measured and gait performance was assessed at 2 different test sessions 1 week apart. This allowed us to demonstrate that the isokinetic knee extension and flexion strength measurements and the gait performance tests used in the present study were highly reliable (see above).32,33 Because the subjects generally performed slightly better during the second test sessions (implying a small learning effect), the results from the second test sessions for both isokinetic strength and gait performance were used in this study. Perceived participation was only assessed once, because the SIS has been shown to be both valid and highly reliable.36-38 Statistical Analyses Knee muscle strength and gait performance provided 10 quantitative variables for the analyses: 2 strength measurements for the paretic lower limb, 2 strength measurements for the nonparetic lower limb, and 6 gait performance assessments. Perceived participation provided 1 quantitative variable: the percentage value of SIS participation. There were no missing values, so the statistical analyses included all variables for all the 50 subjects. The differences in the mean between the men and the women for knee muscle strength, gait performance, and perceived participation were determined using the t test. The relation between knee muscle strength and gait performance and between gait performance and SIS participation were tested with the Pearson correlation coefficients (r). Statistical significance Arch Phys Med Rehabil Vol 87, July 2006
levels were based on the hypothesis that the values of these coefficients are zero. In this study, we were specifically interested in the relation between knee muscle strength and gait performance and between gait performance and perceived participation. To determine these relations and the possible influence of other factors, stepwise multiple regression analyses were performed. In the first set of analyses, the various assessments of gait performance were the dependent variables; the independent variables were the paretic and nonparetic strength measurements. Because the knee extension and flexion strength measurements correlated significantly (P⬍.01) for both the paretic (r⫽.78) and the nonparetic lower limb (r⫽.85), they were used separately in the multiple regression analyses. We then added other independent variables (not related to knee muscle strength) that could influence the relations: sex, age, time since stroke onset, type of stroke, and side of weakness. In the second set of analyses, the dependent variable was perceived participation; the independent variables were firstly the 6 gait performance assessments separately and then each gait performance assessment in combination with sex, age, time since stroke onset, type of stroke, and side of weakness. The R2 value represents the proportionate contribution of the independent variables to the variance of the dependent variable. The suitability of this approach—the aptness of the linear model and the normality of the residuals—was addressed in scatterplots of the residuals and predicted values, in normal probability plots, in Q-Q plots and 1-sample KolmogorovSmirnov tests. All calculations were performed using SPSS, version 11.0,b for Windows. Significance levels less than .05 represented statistical significance, whereas values greater than .05 were considered not significant. RESULTS A total of 38 men and 12 women were included in the study. The sex ratio reflects the number of men and women admitted to the Comprehensive Integrated Rehab Unit at the Department of Rehabilitation, Lund University Hospital over the period 2000 to 2002 (122 men, 48 women). The mean age ⫾ standard deviation (SD) for the men was 59⫾7 years (range, 46⫺72y), and for the women was 58⫾5 years (range, 50⫺66y). The time from stroke onset was 17⫾9 months (range, 6⫺46mo). Thirtyseven subjects had an ischemic stroke and 13 a hemorrhagic stroke. Twenty subjects had weakness in the right side and 30 in the left side. The summary statistics of knee muscle strength are presented in table 1. The knee extension and flexion strength in the nonparetic limb was significantly lower for the women (P⬍ .001). In the paretic limb, knee extension strength was also significantly lower for the women (P⬍.05), whereas knee
Table 1: Summary of the Isokinetic Knee Muscle Strength Measurements Men Test
Extension 60°/s (Nm) Nonparetic Paretic Flexion 60°/s (Nm) Nonparetic Paretic
Mean ⫾ SD
Women Range
Mean ⫾ SD
Range
146.6⫾43.1 74–268 101.3⫾25.7 70–148 99.7⫾41.5 13–191 67.5⫾26.7 22–115 81.5⫾28.1 16–149 47.2⫾28.7 9–119
52.1⫾13.5 33–82 32.4⫾15.7 7–63
977
POSTSTROKE STRENGTH, GAIT, AND PARTICIPATION, Flansbjer Table 2: Summary of the 6 Gait Performance Tests and SIS Participation Mean ⫾ SD
Test
TUG (s) Gait speed (m/s) Comfortable Fast Stair climbing (s) Ascend Descend 6MWT (m) SIS participation (%)
of weakness) were added in the multiple regression analyses, age, or right-side weakness contributed each 6% to the variance of the TUG (see table 3).
Range
13.7⫾5.3
7.0–27.7
0.94⫾0.28 1.35⫾0.44
0.36–1.53 0.49–2.12
10.3⫾4.7 10.9⫾5.8 398⫾136 76.2⫾18.4
5.5–25.6 4.4–27.5 122–648 34–100
flexion strength did not differ significantly between the men and the women. The summary statistics for gait performance and SIS participation are presented in table 2. Because there were no significant differences between the men and the women for gait performance or for SIS participation, the data from the men and the women were analyzed together. There was a ceiling effect in SIS participation, illustrated by 4 (8%) subjects attaining the maximal value of 100%. The lowest percentage attained by any subject was 34%. The median value for SIS participation was 81%. Knee Muscle Strength and Gait Performance The correlation coefficients (r) between knee muscle strength and gait performance, their significance levels and a summary of the results of the multiple regression analyses (R2) are presented in table 3. All correlation coefficients for knee muscle strength in the paretic limb and gait performance were significant (P⬍.01), whereas none of the correlation coefficients for the nonparetic limb were significant. Knee muscle strength in the paretic limb explained 34% to 50% of the variance in gait performance. The R2 values for knee extension and knee flexion strength in the paretic limb were very similar and explained more of the variance for the 6MWT and less for stair climbing ascend and descend. When knee muscle strength in the paretic and nonparetic lower limbs was combined, strength in the nonparetic limb contributed up to 11% for 8 of the 12 analyses, but together they explained at most 51% of variance in gait performance. When the other independent variables (sex, age, time since stroke onset, type of stroke, side
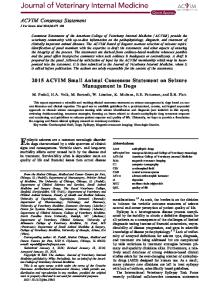
Gait Performance and Perceived Participation For the second set of analyses the data are presented graphically in figure 1, together with the Pearson r and the R2 values. All relations were significant (P⬍.01). The gradients of the regression lines indicated that for each gait performance test, a better performance corresponded to a higher SIS participation value. Gait performance explained 28% to 40% of the variance in perceived participation. When the independent variables (sex, age, time since stroke onset, type of stroke, side of weakness) were added into the multiple regression analyses, age in combination with the TUG or 6MWT contributed an additional 7% to the variance in SIS participation. The combination of a better performance in the TUG and 6MWT and higher age corresponded to a higher SIS participation value. DISCUSSION The aim of this study was to assess the relations among knee extension and flexion strength, gait performance, and perceived participation. The main findings were that knee muscle strength and gait performance as well as gait performance and perceived participation were significantly related. Gait performance could explain between 28% and 40% of the variance in perceived participation, whereas knee muscle strength in the paretic lower limb could explain up to 50% of the variance in gait performance. Knee muscle strength in the nonparetic lower limb was of some importance, but together the strength in the 2 lower limbs did not explain more than 51% of the variance in gait performance. Increasing age contributed, although to a small degree, to the explanation of both gait performance and SIS participation. Relation Between Knee Muscle Strength and Gait Performance Our results confirm the general contention that knee muscle strength is positively related to walking ability after stroke.3,9 The relation between knee extension strength in the paretic lower limb and gait performance were very similar to those in other studies.13-16,18,20,21 Two studies17,19 have, however, not detected a significant relation. One study, with a sample of only 12 stroke patients, showed a nonsignificant trend17 and the other study, based on 20 stroke patients and average muscle
Table 3: Correlation Between the Gait Performance Tests and the Isokinetic Knee Muscle Strength Measurements (r ) , and the Results of the Stepwise Multiple Linear Regression Analyses (R 2) Measurements
Extension 60°/s Paretic (r ) Nonparetic (r ) Paretic (R 2) Paretic and nonparetic (R 2) Paretic, nonparetic and increasing age (R 2) Flexion 60°/s Paretic (r ) Nonparetic (r ) Paretic (R 2) Paretic and nonparetic (R 2) Paretic, nonparetic and right side weakness (R 2)
TUG
CGS
FGS
SCA
SCD
6MWT
⫺.65* ⫺.14† .42 .51 .57
.61* .12† .37 .46 .46‡
.67* .19† .44 .50 .50‡
⫺.58* ⫺.07† .34 .45 .45‡
⫺.61* ⫺.13† .38 .46 .46‡
.70* .26† .49 .49‡ .49‡
⫺.64* ⫺.15† .41 .41‡ .47
.61* .09† .37 .42 .42‡
.65* .15† .42 .42‡ .42‡
⫺.61* ⫺.06† .37 .44 .44‡
⫺.61* ⫺.10† .37 .42 .42‡
.71* .25† .50 .50‡ .50‡
Abbreviations: CGS, comfortable gait speed; FGS, fast gait speed; SCA, stair climbing ascend; SCD, stair climbing descend. *P⬍.01, †not significant, ‡the added independent variable did not contribute to the variance of the dependent variable.
Arch Phys Med Rehabil Vol 87, July 2006
POSTSTROKE STRENGTH, GAIT, AND PARTICIPATION, Flansbjer
80 60 40 r = -.63 R2 = .40
5
10
15
20
25
60 40 20
SIS Participation (%)
SIS Participation (%)
80 60 40 r = -.57 R2 = .32
0.4
0.8
1.2
1.6
2.0
10
15
20
25
Stair Climbing ascent (s)
60 40 20
2.4
100 80 60 40 20
r = -.55 R2 = .31
0
0 5
80
r = .57 R2 = .33
0.0
30
0.4
0.8
1.2
1.6
2.0
2.4
Fast Gait Speed (m/s)
Comfortable Gait Speed (m/s)
100
0
100
0 0.0
30
Timed "Up & Go" (s)
20
r = .57 R2 = .32
0
0 0
80
SIS Participation (%)
20
100
SIS Participation (%)
100
SIS Participation (%)
SIS Participation (%)
978
100 80 60 40 r = .53
20
R2 = .28
0 0
5
10
15
20
25
Stair Climbing descent (s)
30
0
100 200 300 400 500 600 700
6-Minutes Walk (m)
Fig 1. The relation between SIS participation and gait performance. High SIS values represent no or low restriction in participation whereas low values indicate more restricted participation. For each of the 6 gait performance tests, a better performance corresponded to a significantly (P