J. Biosci., Vol. 21, Number 5, September 1996, pp 723–734. © Printed in India.
Stratification of density in dry deciduous forest using satellite remote sensing digital data—An approach based on spectral indices P S ROY†, K P SHARMA* and A JAIN Forestry and Ecology Division, Indian Institute of Remote Sensing (NRSA), Kalidas Road, Dehra Dun 248 001, India *Regional Remote Sensing Service Centre (ISRO), Dehra Dun 248 001, India MS received 4 October 1995; revised 14 March 1996 Abstract. Forest density expressing the stocking status constitutes the major stand physiognomic parameter of Indian forest. Density and age are often taken as surrogate to structural and compositional changes that occur with the forest succession. Satellite remote sensing spectral response is reported to provide information on structure and composition of forest stands. The various vegetation indices are also correlated with forest canopy closure. The paper presents a three way crown density model utilizing the vegetation indices viz., advanced vegetation index, bare soil index and canopy shadow index for classification of forest crown density. The crop and water classes which could not be delineated by the model were finally masked from normalized difference vegetation index and TM band 7 respectively. The rule based approach has been implemented for land use and forest density classification. The broad land cover classification accuracy has been found to be 91·5%. In the higher forest density classes the classification accuracy ranged between 93 and 95%, whereas in the lower density classes it was found to be between 82 and 85%. Keywords. Forest density; satellite remote sensing; vegetation indices; rule based approach; canopy density modeling.
1. Introduction The human interventions in the natural forest reduce the number of trees per unit area and canopy closure. it affects regeneration, leads to uneven age class distribution and invasion of weeds. Dry deciduous forest comprises 53% of total forest area in India. In the recent past, the ecological status and the production capacity of these forests could not keep pace with the exponential growth rate of human and livestock population. The density stratification in such kinds of forests leads to a most challenging task. In India, reliable database on the forest cover, its structure and function are discrete. Forest stock maps are the basic data used by the forest divisions in preparing a working plan for forest management. It is drawn on a topographical map of a large scale (1:15, 750 approx.) by various state forest departments showing the local forest types with their crown or stock density, the site quality and age group of the crop. The conventional method of making stock maps rising ground survey is time consuming. It is therefore, difficult to complete the revision in scheduled time. As a result most of the stock maps do not reflect current status of forests. Use of aerial photographs in working plans for stock mapping in India was started during seventies (Maslekar 1974; Tomar *Corresponding author.
723
724
P S Roy, K P Sharma and A Jain
1976; Tiwari 1978). However, aerial photographs could not become popular due to difficulty in their procurement. Satellite remote sensing has played an important role in generating information about forest cover, vegetation type and the landuse changes (Houghton and Woodwell 1981; Botkin et al 1984; Malingreau 1991; Roy 1993). The visual interpretation technique has been widely used for forest cover mapping (Anon, 1983, 1995; Porwal et al 1994). Standardization of ground sampling methods, understanding of spectral and temporal responses of vegetation, coupled with the recent advancements in the digital image processing techniques have brought about a profound acceptance of the application of satellite remote sensing data in forest inventory and mapping. The National Forest Cover Mapping programme undertaken by Forest Survey of India is primarily based on visual interpretation wherein forests are classified into three major density classes viz., dense forest ( > 40%), open forest (40–10%) and scrub forest (< 10%) on 1:250,000 scale. The methodology, is subjective and varies with the aptitude of the interpreter. Recent attempts to classify forests using satellite based digital data have resulted in classification based on phenology or leaf duration (evergreen, semievergreen, moist deciduous, dry deciduous and mangroves), gregariousness of species (like, Tectona grandis, Shorea robusta, Dipterocarpus sp., Pinus sp. etc.) or dominance of forests by large canopies (Roy et al 1985; Roy and Ravan 1994). Forest structural classification based on broad canopy density classes has been reported using Indian Remote Sensing Satellite Data IRA-1A LISS II (Roy et al 1990). The classification uses four raw bands and normalized difference vegetation index (NDVI) band for supervized maximum likelihood classification. NDVI provides good information on canopy closure in evergreen/coniferous areas. It has been reported to vary with foliage activity in dry/moist deciduous forest areas (Roy and Ravan 1994). Consequently results may vary according to differing phenological situations in dry and moist deciduous forest areas. Forest density expressing the stocking status constitutes the single major stand physiognomic characteristics of Indian forests. The canopy closure, number of trees per unit area and basal area are often taken as parameters to measure density. Satellite remote sensing provides a measure of the canopy closure. The per cent crown closure is a measure of area occupation rather than stand density. However, it is an important structural parameters used to stratify forest. International Tropical Timber Organization (IITO) in its project to rehabilitate logged over forest has also taken crown closure as an important parameter to stratify forests. The ecological conditions like, light penetration through the canopy, surface reflection, rainfall interception are dependent on crown density. 2. Study area A part of central India in the Shivpuri district (Madhya Pradesh) has been selected for the study. The test sample selected poses maximum challenge in using satellite remote sensing data as these forests have varying density levels and the lower density classes show a marked influence on satellite recordings. The climate of the Shivpuri is hot and dry. It is classified under semi-arid to arid region. According to the effective temperature index the area falls under bioclimatic type D (Champion and Seth 1969). The annual mean daily temperature is 23·06°C and average annual rainfall is 895·5 mm. The relative humidity is low due to low rainfall and
Stratification of density in dry deciduous forest
725
high temperature. Physiographically, the area constitutes low hills, plateau, and plains, mostly of upper Vindhyan. The elevation varies between 250 m to 510 m above msl. In Vindhyan hills soil is shallow, sandy loam and well drained. Soil type and soil depth vary from place to place due to local topography. The forests are mainly of sub type (B) northern tropical dry and moist deciduous forests (Champion and Seth 1968). The main forests of the area are of: Anogeissus pendula, Boswelia serrata, Butea monosperma and Acacia catechu. More or less the forest types are in pure dominance or admixtured with other deciduous trees viz., Diospyros melanoxylon, Terminalia tomentosa, Anogeissus latifolia, Mitragyna parviflora etc. Their presence at any place is largely determined by physiography, soil moisture, temperature and biotic factors. Besides trees, species of shrubs and herbs growing in abundance are Zizyphus nurnmularia, Nyctanthes arbortristis, Carissa opaca, Cassia tora, Lantana camara etc. Grasslands are widespread intermittently mixed with forested landscape.
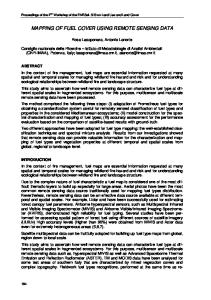
Figure 1. False colour composite of bands 4, 3 and 2.
726
P S Roy, K P Sharma and A Jain
3. Materials and methods 3.1 Data used Landsat Thematic Mapper (TM) data of January 1990 has been used for the digital analysis (false colour composite as figure 1). In addition, topographic and ground surveyed forest stock maps prepared by the state forest departments have been used as reference. Among the various ground measured parameters of the different forest stands, the leaf area index (LAI) and intercepted photosynthetically active radiation (IPAR) directly provide information on canopy closure. The measurements of these parameters in eighteen forest sample plots have been used for the validation of approach in the present study. 3.2 Methodology The digital image processing has been performed on IBM RS-6000 series using EASI PACE software. The spectral data set is subjected to physical transformation using enhancement techniques (Anon. 1993). Attempts have been made to isolate vegetation cover, soil background influence and canopy shadow pattern from Landsat TM data. The vegetation feature space data was stratified based on the ‘texture’ of the data as influenced by the canopy shadow. Finally, a rule-based logic is implemented to achieve land cover and forest density classification. The empirical relationship of the spectral response (from 3 × 3 pixel matrix) and the ground measured canopy density related parameters like, LAI and IPAR has been analysed. 3.3 Advanced vegetation index The NDVI is often used to stratify vegetation and non-vegetated areas. However, subtle differences due to canopy density in the infra red and red are not highlighted in the ratio based indices. NDVI is also found to be sensitive to canopy foliage activity. Anon. (1993) suggested that subtle differences can improve by using power degree of the infrared response. The index thus calculated has been termed as advanced vegetation index (AVI). It has been found to be more sensitive to forest density and physiognomic vegetation classes: AVI = [IR*(255 – R)*(IR – R)]1/3,
(1)
where, IR is infrared band response and R is red band response. 3.4 Bare soil index The bare soil areas, fallow lands, vegetation with marked background response are enhanced using this index. Similar to the concept of AVI, the bare soil index (BI) is a normalized index of the difference of the sums of two reflective (B4 and B1) and absorption (B5 and B3) bands. This index helps in separating the vegetation with different background viz., completely bare, sparse canopy and dense canopy etc. BI = {(MIR + R) – (IR + B)}/{(MIR + R) + (IR + B)},
(2)
Stratification of density in dry deciduous forest
Figure 2. The rule-based approach to classify forest density and physiognomic vegetation types using digital satellite remote sensing data.
727
728
P S Roy, K P Sharma and A Jain
where, B, R, IR and MIR are the brightness values recorded by the satellite in Landsat TM spectral channels 1, 3, 4 and 5 respectively. 3.5 Canopy shadow index The crown arrangement in forest stands leads to shadow pattern affecting the spectral responses. The young even aged stands have low canopy shadow index (SI) compared to the mature natural forest stands. The later forest stands show flat and low spectral axis is comparison to that of open area. SI = [(255 – B)*(255 – G)*(255 – R)]1/3,
(3)
where, B is blue band response, G is green band response and R is red band response. The individual index bands were visually analysed, separately and in combination to generate colour composites. The canopy density separation was quite significant in the colour composite of AVI + SI + BI combination. 3.6 Crown density model The approach adopted in the present study is shown as figure 2. Initially a three way model using AVI, BI and SI has been implemented to classify forest crown density. The Table 1. A rule-based approach for land-cover and forest density classification.
MIR7, Middle infra red band 7.
Stratification of density in dry deciduous forest
729
results obtained indicated misclassification in non-forest classes (particularly in cropped areas and water bodies). Hence, the results have been improved using water mask from Landsat TM band 7 and agriculture crop mask from NDVI. The logic based rules as shown in table 1 have been implemented on Landsat TM data set for achieving forest density classification. Final classification results based on rule-based approach is presented as figures 3 and 4.
3.7 Spectral relationship with canopy parameters The spectral response of 3 × 3 pixel window were extracted from 18 permanent ground sample points established in the study area. These sample points are distributed in the homogeneous vegetation strata determined based on vegetation types, stand density
Figure 3. SI.
Two way model to classify the forest density, landcover classes using AVI, BI and
730
P S Roy, K P Sharma and A Jain
Figure 4. A final classified map showing forest density and physiognomic vegetation classes (prepared using the rule based classification scheme).
and physiography. Two important parameters viz., LAI and IPAR has been used to represent canopy closure conditions of the forest. The measurements of radiation within canopy were made with the instrument (Decagon’s Ceptometer), which is sensitive only to the profile of photosynthetically active radiation (PAR, 400–700 nm). The method described by Norman and Jarvis (1975) was used for measuring IPAR IPAR = Io – Tc
(4)
where, Io is the incident radiation at the top of canopy and Tc is the energy that emerges at the base of the canopy. LAI is an important canopy parameter needed for forest ecosystem studies. Indirect methods using gap fraction analysis has been used to estimate LAI (Campbell and Norman 1989). Gap fraction can be inferred by estimation of the fraction of the direct solar beam that penetrated the canopy. The Ceptometer measured IPAR has been utilized to calculate the canopy transmittance. LAI was calculated for each site from the
Stratification of density in dry deciduous forest
731
Table 2. Forest and land cover classification scheme.
canopy transmittance measurements using the Beer–Lambert law which states that canopy elements are randomly dispersed in space and there exist a negative exponential relationship between transmitted light and LAI: LAI = Ln(Q1/Q0)/k,
(5)
where, Q0 is the average incident PAR, Q1 is the average below canopy PAR, (Q1/Q0) is the gap fraction, and k is a light extinction coefficient. k values range from 0·40 to 0·65 depending upon species or dominant species of the forested stand. An average k value of 0·5 has been used for all stands (Jarvis and Leverenze 1983).
4. Results and discussion Satellite remote sensing data have been used to identify vegetation cover and their density (Wu et al 1985; Roy et al 1990; McCloy and Hall 1991). The visual interpretation technique is subjective and depends on the field knowledge and aptitude of the interpreter. The digital classification methods are based on spectral signature and are reported to be more accurate (Roy et al 1990). Many workers have noted the significant differences in reflectance of forest canopy and their background (Gates et al 1965). However, with the increase in spectral and spatial resolutions volume of data has increased considerably. With this, there is also increase in the information content and ‘mixed pixels’, posing challenge to the existing classification techniques of forest stratification (McCloy 1980). The vegetation indices can reduce the effects of bias and assist in the extraction of the significant features of a specific ground object (Curran 1980; Malila et al 1981). These indices also help in categorizing ‘mixed pixels’ effectively (McCloy and Hall 1991).
732
P S Roy, K P Sharma and A Jain
Kauth and Thomas (1976) and Crist and Cicone (1984) attempted to isolate features like, greenness, bare soil, yellowness, wetness using orthogonal transformation of individual bands of Landsat MSS and Landsat TM. The present study proposes a set of vegetation indices using linear combinations to isolate vegetation cover characteristics which vary with canopy density. Very few attempts have been reported to stratify forest density using satellite remote sensing digital data. Roy et al (1990) used normal four bands of IRS–LISS II data alongwith NDVI for supervized classification of forest density. Subsequently, McCloy and Hall (1991) suggested vector classifier to obtain accurate forest density classification. However, in both the classification methods human bias is introduced by providing ground truth. The present approach isolates vegetation feature space using AVI and BI indices. The vegetation feature space is further stratified using SI on the basis of texture variation introduced by the canopy shadow of the forest stands. Such an approach provided five forest density classes and physiognomic classes like, scrub/shrub and grasslands. The misclassification of cropped area and waterbodies was overcome by taking NDVI (in cultivation areas) and band 7 values respectively. This hierarchal approach of identifying different land cover
Figure 5.
A generalized major landcover type map.
Stratification of density in dry deciduous forest
733
features and forest density was compiled into set of rules which are implemented for the classification (table 2). The pack of rules however remains implementable on the present data set only. Its extension needs to tested in other dry deciduous forest areas. The classification results have been compared with permanent sample points (0·1 ha) marked on forest thematic maps. For evaluating classification two maps used are: (i) land cover and forest density classified map (figure 4); (ii) broad land cover classified maps (without forest density stratification) (figure 5). The overall accuracy of the generalized land cover map has been observed as 91·5%. The accuracy of first three density categories (viz., > 80%, 60–80% and 40–60%) has been found to range between 93–95%. The accuracy of the remaining density classes (viz., 20–40% and 10–20%) ranged between 82–85%. The overall classification accuracy of the map showing land cover type and forest density is 89·4%. Attempts have also been made to validate results by investigating empirical relationship between AVI with dominant canopy density measures like, LAI and IPAR. The correlation coefficient values (r2) have been found as 77·92 and 79·32% respectively. The results indicate that the approach suggested herein identifies features in hierarchal manner and can provide reliable information on forest cover and associated land cover features. However, the approach has been validated in the dry deciduous forests only. Its extension in other bioclimatic conditions needs to tested. Since the approach accounts for important forest density parameters viz., vegetation cover, background influence and canopy shadow pattern, it has potential to be viable tool for forest density stratification of other forest types also.
References Anonymous 1983 Nationwide mapping of forest and non-forest areas using Landsat False Colour Composite for the period 1972–75 and 1980–82, National Remote Sensing Agency, Hyderabad, Technical Report, vol. 1, pp 1–36 Anonymous 1993 Rehabilitation of Logged over Forests in Asia/Pacific region. Final Report of Sub Project II International Tropical Timber Organization – Japan Overseas Forestry Consultants Association, pp 1–78 Anonymous 1995 The State of Forest report, Forest Survey of India, New Delhi, pp 1–82 Botkin D B, Estes J E, McDonald R M and Wilson M V 1984 Studying the Earth’s vegetation from space; BioScience 34 508 Campbell G S and Normal J M 1989 The description and measurement of plant canopy structure; in Plant canopies: Their growth, form and function (eds) G Russell, B Marshall and P G Jarvis (Cambridge: Society of Experimental Biology, Cambridge University Press) pp 1–19 Champion H G and Seth S K 1968 A Revised Survey of Forest Types of India (New Delhi: Government of India Publication) Crist E P and Cicone R C 1984 A physically based transformation of thematic mapper data—The TM Tasseled Cap; IEEE Trans. Geosci. Remote Sensing 22 256–263 Curran P J 1980 Multispectral remote sensing of vegetation amount; Proc. Phys. Geogr. 4 315–341 Gates D M, Keegan H J, Sehleter J C and Weidner V R 1965 Spectral properties of plants; Appl. Optics 4 11–20 Houghton R A and Woodwell G M 1981 Biotic contributions to the global carbon cycle: the role of remote sensing; Proc Seventh International Symposium on Machine Processing of Remote Sensed Data, West Lafayette, Indiana, pp 593–602 Jarvis P G and Leverenze J W 1983 Productivity of temperate, deciduous and evergreen forests; in Physiological plant ecology IV. Ecosystem processes: Mineral cycling, productivity and man’s influence (eds) O P Lange, P S Noble, C B Osmond and H Ziegler (New York: Springer–Verlag) pp 32–57 Kauth R J and Thomas G S 1976 The tesseled cap—a graphic description of the spectral temporal development of agriculture crops as seen by Landsat; in Proc. Machine Processing of Remotely Sensed Data, Purdue University. West Lafayette, Indiana, pp 41–51
734
P S Roy, K P Sharma and A Jain
Malila W A, Lambeck P F, Crist E P, Jackson R D and Pinter P J Jr 1981 Landsat features for agricultural applications; in Proceedings of the Symposium on Remote Sensing of the Environment, Ann Arbor, Michigan, pp 793–803 Malingreau J P 1991 Remote Sensing for Tropical Forest Monitoring: an overview; in Remote Sensing and Geographical Information Systems for Resource Management in Developing Countries (eds) A S Belward and C R Valenzuela (Dordrecht: Kluwer) pp 253–278 Maslekar A R 1974 Remote Sensing and its scope in Indian Forestry; Indian For. 100 192–201 McCloy K R 1980 Application of Landsat to mapping grassland condition in the South East Region of South Australia; Soil Conservation Branch Report, S1/80, S A Department of Agriculture, Adelaide pp 1–28 McCloy K R and Hall K A 1991 Mapping the density of woody vegetative cover using Landsat MSS digital data; Int. J. Remote Sensing 12 1877–1885 Norman J M and Jarvis P G 1975 Photosynthesis in Sitka Spruce (Picea sitchensis Bong. Carr .) V. Radian penetration theory and a test case; J. Appl. Ecol. 12 839–878 Porwal M C, Dabral S L and Roy P S 1994 Revision and updating of stock maps using remote sensing and Geographic Information System (GIS); Proc. ISRS Silver Jubilee Symposium, Dehradun, pp 334–342 Roy P S, Kaul R N, Sharma M R and Garbyal S G 1985 Forest type stratification and delineation of shifting cultivation areas in eastern part of Arunachal Pradesh using Landsat MSS data; Int. J. Remote Sensing 6 411–418 Roy P S, Diwakar P G, Vohra T P S and Shan S K 1990 Forest Resource Management using Indian Remote Sensing Satellite data; Asian-Pacific Remote Sensing J. 3 11–22 Roy P S 1993 Remote Sensing for Forest Ecosystem Analysis and Management: in Environmental studies in India (ed·) M Balakrishnan (New Delhi: Oxford and IBH) pp 335–363 Roy P S and Ravan S A 1994 Habitat Management for Biodiversity Maintenance using aerospace remote sensing; in Tropical ecosystems: A synthesis of tropical ecology and conservation (eds) M Balakrislman, R Borgstrom and S W Bie (New Delhi: Oxford and IBH) pp 309–345 Tiwari K P 1978 A comparative evaluation of landuse and forest type classification and mapping with aerial photograph vis a vis conventional ground stock mapping—a case study in Tehri Garhwal; Indian For. 104 747–767 Tomar M S 1976 Use of aerial photographs in working plans; Indian For. 102 98–108 Wu J K, Zheng Q F and Wang W T 1985 A forest inventory using Landsat imagery in the Mao-shan area of China; Int. J. Remote Sensing 6 1783–1795 Corresponding editor: RAGHAVENDRA GADAGKAR