Strategic Enrollment Management (SEM) Plan for 2015 – 2018 University of Wisconsin – Whitewater Summary Information Recruitment and enrollment at colleges and universities across the U.S. has become more competitive than ever before and this is especially true in our recruiting region. To understand the overall Strategic Enrollment Plan (SEM), a review of the past SEM results are listed below.
New Freshmen New Transfer
2011 - 14 Proposed Target Recruitment Numbers by Type 2011 Class 2012 Class 2013 Class Actual Proposed Actual Proposed Actual 2,006 2,125 2,168 2,100 2,108 666 715 744 715 689
2014 Class Proposed Actual 2,150 2151 715 706
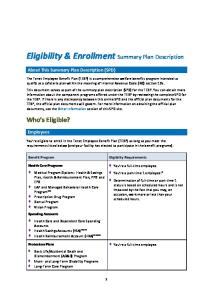
For this plan there are several assumptions were made: first, we are anticipating consistent recruitment numbers for traditional first-year students at 2,150; second, there are pockets of growth in high school students around the region and state with no overall growth projected in the state; third, the demographics of the students in Wisconsin will change – there will be little growth in number of Caucasian or African American students and significant growth in Hispanic students graduating from high schools. The plan for traditional-aged students is to keep academic profile of incoming class at approximately 22.3-22.5 ACT; 3.20-3.30 HS GPA. Growth in transfer student numbers has occurred only due to increases in the number of students from Illinois. An analysis of articulation agreements needs to be done to see if they are successful or not. In two of our smaller target areas, high school students and international students, both markets are unpredictable, but growth is expected in those two areas. With more attention to high school programs in both finances at the state-level and student interest, we are expecting slight increases in that market. With a similar SEM plan for the Center of Global Education being developed, we are anticipating growth in international students including first-time students, transfer students and study abroad students.
Wisconsin Freshmen Illinois Freshmen Non-Resident Freshmen International Total New Freshmen WI Transfer Illinois Transfer Non-Resident Transfer Total New Transfer
2015 - 18 Proposed Target Recruitment Numbers by Type 2015 Class 2016 Class 2017 Class Proposed Proposed Proposed 1755 1750 1750 345 345 345 35 35 35 15 20 20 2150 2150 2150 615 627 630 90 100 105 20 23 25 725 750 760
2018 Class Proposed 1750 340 35 25 2150 640 110 25 775
There is a need for a solid and continued marketing and communication plan for recruiting students, family members and high school counselors. Finally, success is measured by meeting the recruitment goals; meeting or exceeding retention goals for both first-year and transfer students; lowering transfer-out rates.
Strategic Enrollment Management (SEM) Plan for 2015 – 2018 University of Wisconsin – Whitewater I.
Introduction
II.
What were our goals 2011-14? A. Class size................................................................................................................................................................... i. First-year.................................................................................................................................................... ii. Transfers....................................................................................................................................................
III.
What have our past enrollment results been?................................................................................................................ A. Class size................................................................................................................................................................... i. First-year.................................................................................................................................................... ii. Transfers.................................................................................................................................................... iii. High School Specials………………………………………………………………………………………………………………………………
IV.
What is the Profile of our incoming students?................................................................................................................ A. Class profile.............................................................................................................................................................. i. First-year.................................................................................................................................................... ii. Transfers....................................................................................................................................................
V.
Planning Assumptions..................................................................................................................................................... A. SWOT Implications Affecting Recruitment & Enrollment ....................................................................................... B. Student Demographics Affecting Recruitment (S. WI, overall WI, N. IL) ................................................................ C. Financial Factors Impacting Student Enrollment..................................................................................................... D. Enrollment at Regional Institutions......................................................................................................................... E. Benchmarking Versus Regional Peers (MSEP)........................................................................................................ F. Scholarships and Non-Resident Remission.............................................................................................................. G. Demand for Current Academic Programs.............................................................................................................. i. Growth and Decline in programs for incoming first-year students.......................................................... ii. Anticipated changes in academic programs (based on SPBC report 2012-14) ....................................... H. UW System New Majors and Programs................................................................................................................... I. High School Programs – Youth Options, Course Options, Partners in Education, and HS Specials........................ J. Transfer Initiatives – Articulation Agreements, 2+2, ............................................................................................. K. International Recruitment Initiatives...................................................................................................................... L. Importance of a Strong First-Year Class………………………………………………………………………………………………………………
VI.
What are our target enrollment numbers and preferred student profile 2015-18?........................................................... A. Traditional Students................................................................................................................................................. B. Non-traditional Students (military, adult, community members, on-line) .............................................................. C. High School Programs – Youth Options, Course Options, Partners in Education and High School Specials………… D. Transfer Students..................................................................................................................................................... E. International.............................................................................................................................................................
VII.
Who are we targeting?.................................................................................................................................................... A. Traditional Students – purchasing names (ACT, College Board, Cappex), ACT submissions, FAFSA, by program, etc……………………………………… B. Non-traditional Students – military, adult, community members, on-line)…………………………………………………………. C. High School Programs………………………………………………………………………………………………………………………………………… D. Transfer Students………………………………………………………………………………………………………………………………………………..
VIII.
How do we communicate our message?......................................................................................................................... A. Trends in college decision-making (counselors, parents, ……………………………………………………………………….............. B. Print UW System viewbook, search piece, transfer brochure, admit packet, value piece, counselor update, adult/non-trad, multilingual pieces (which ones) C. At recruiting events (WEF, college fairs, high school visits, visiting businesses, ………………………………………………….
1|Page
D. E. F. G.
Website (analytics, chat……………………………………………………………………………………………………………………………………… On-line (Cappex, ads with Pandora, Facebook, LinkedIn, …………………………………………………………………………………… Video (website, Premiere Days, Campus Tour, Virtual Tour)………………………………………………………………………………. Premiere Days; Campus Visit/Campus Tour; Counselor Visit Day………………………………………………………………………..
IX.
What is the Recruitment Plan?........................................................................................................................................ A. High School Visits (add Appleton, Green Bay, Madison………………………………………………………………………………………. B. WEF and College Fairs……………………………................................................................................................................ C. Non-Traditional Students (military, adult, community members, on-line)………………………………………………………….. D. Youth Options, Course Options, and Partners in Education..................................................................................... E. Transfer (articulation agreements, add College of Lake County, McHenry, Rock Valley)……………………………………..
X.
How do we measure success?......................................................................................................................................... A. Meet admissions targets/goals................................................................................................................................ B. Maintain or increase student academic profile........................................................................................................ C. Increase the retention and graduation rates........................................................................................................... D. Other measures…………………………………………………………............................................................................................
2|Page
Tables Table 1: Table 2: Table 3: Table 4: Table 5: Table 6: Table 7: Table 8: Table 9: Table 10: Table 11: Table 12: Table 13: Table 14: Table 15: Table 16: Table 17: Table 18: Table 19: Table 20: Table 21: Table 22: Table 23: Table 24: Table 25: Table 26: Table 27: Table 28: Table 29: Table 30: Table 31: Table 32: Table 33: Table 34: Table 35: Table 36: Table 37:
2011 - 14 Proposed Target Recruitment Numbers by Type ……………………………………………………………………….. UW-Whitewater Headcount Enrollment 1980 to 2014………………………………………………………………………………. Admission/Enrollment Number of New Freshmen Fall 2010-2014……………………………………………………………. Admission/Enrollment Number of Transfer Students Fall 2010-2014………………………………………………………… Types of Dual Enrollment for High School Students…………………………………………………………………………………… Academic Profile of New Freshmen 2009, 2011, 2014…..………………………………………………………………………….. All Students by ACT Composite 2010-2014………………………………………………………………………………………………… Under-represented Minority Students by ACT Composite 2010-2014……………………………………………………….. Academic Profile of New Transfers 2009, 2011, 2014………………………………………………………………………………... Sending Institution of New Transfers 2004-2012……………………………………………………………………………………….. Top 10 Countries Sending Students to Study in the U.S. ……………………………………………………………………………. Endowment, Aid, and Student Loan Data by UW Institution……………………………………………………………………… Enrollment at Regional UW Colleges and Universities……………………………………………………………………………… Enrollment at Wisconsin Private Colleges and Universities 2001/02 to 2010/11……………………………………….. Participation in the Midwest Student Exchange Program………………………………………………………………………….. Non-resident remission Scholarship Formula…………………………………………………………………………………………….. Non-Resident Fee Remission 2009 - 2014…………………………………………………………….……………………………………. Top Changes in College of Business and Economics Majors for First-Year Students 2004 to 2014……………… Top Changes in Majors for First-Year Students 2004 to 2014 (excluding CoBE)………………………………………….. Priority Areas for Expanding Current Academic Programs…………………………………………………………………………. Number of New Undergraduate Programs by UW Institution 2001-2014………………………………………………….. Tracking First-Year Cohorts Year-to-Year ………………………………………………………………………………………………….. Overall Enrollment by Admission Type 2013 and 2014………………………………………………………………………………. Proposed Target Recruitment Numbers by Type 2015-18…………………………………………………………………………. High School Graduates in Wisconsin 2013-2023………………………………………………………………………………………… High School Graduates in Illinois 2013-2023………………………………………………………………………………………………. UW-Whitewater Top Feeder High Schools by Enrolled Students……………………………………………………………….. Majors on First-Year Students 2004-2013………………………………………………………………………………………………….. UW-Whitewater Top Feeder Transfer Schools by Enrolled Students………………………………………………………….. Enrollment of All Transfer Students by University Type and by Program…………………………………………………… Applications of New First Year Students by Month 2011 – 2014………………………………………………………………… Applications of New Transfer Students by Month 2011 – 2014…………………………………………………………………. Retention…………………………………………………………………………………………………………………………………………………… NSSE “If you could start over again, would you go to the same institution you are now attending?”………… Website Analytics………………………………………………………………………………………………………………………………………. Campus Tour numbers………………………………………………………………………………………………………………………………. Warhawk Premiere Day numbers……………………………………………………………………………………………………………… Charts
Chart 1: Chart 2: Chart 3: Chart 4:
Top Feeder Schools – new first-year students……………………………………………………………………………………………. Wisconsin High School Enrollment Changes 1998-2003…………………………………………………………………………….. Wisconsin High School Enrollment Changes 2008-2013…………………………………………………………………………….. Strengths, Weaknesses, Opportunities, Threats: Strategic Planning Retreat – Summer 2011……………………. Appendix
Table A: Table B: Table C: Table D:
Population of 17-county regional area (S. Wisconsin/N. Illinois) by County……………………………………………….. Demographics of 17 county regional area (S. Wisconsin/N. Illinois) by County………………………………………….. UW-Whitewater Current Undergraduate Enrollment by County……………………………………………………………….. Admissions Marketing Material………………………………………………………………………………………………………………….
3|Page
Strategic Enrollment Management (SEM) Plan for University of Wisconsin – Whitewater I.
Introduction The focus of this document will be on undergraduate student recruitment and the plans for recruiting students for the next few (3-4) years. The document will review our past recruitment and enrollment efforts for both first-time students as well as new transfer students. Planning assumptions for recruitment will be reviewed that include topics such as demographics in our primary recruiting region, financial factors, enrollment at regional and peer institutions, and changes in programs for college credit for high school students. Our target numbers for first-year and new transfer students will be outlined. Then, communication plans, such as who we are targeting and what marketing material we will be using, will be reviewed. Our recruitment plan will be discussed in terms of where and when our staff recruit students will be formulated. Finally, measures of success will be articulated.
II.
What were our goals? Table 1: 2011 - 14 Proposed Target Recruitment Numbers by Type 2011 2012 Class 2013 Class 2014 Class* Class Actual Proposed Actual Proposed Actual Proposed Actual WI New** 1,445 1,560 1,450 1,555 1,437 1,550 1579 WI Minority 269 240 309 250 268 250 251 Illinois 209 240 295 260 306 260 255 Illinois Minority 37 30 49 35 35 35 31 Non-Resident 28 30 47 30 41 30 21 Non-Resident Minority 9 10 6 10 9 10 2 International 9 15 15 15 12 15 12 Total New Freshmen 2,006 2,125 2,168 2,100 2,108 2,150 2,151 WI Transfer 580 630 596 615 561 615 575 Illinois Transfer 68 70 118 85 107 85 111 Non-Resident Transfer 18 15 30 15 21 15 20 Total New Transfer 666 715 744 715 689 715 706 OVERALL TOTAL 2,672 2,825 2,912 2,870 2,797 2,870 2,857 * 2014 Class revised after the previous SEM report was finished ** WI Covenant students removed from the previous report and included under WI New A. Class size i. First-year To provide context for this report, a brief evaluation of the goals of recruitment for the past three years are reviewed here. The initial goals in the 2011 UW-Whitewater Admissions Office Strategic Enrollment Plan (2011 SEM) were for planning purposes and were consistent with the UW-Whitewater Growth Agenda enrollment goals. Based on the Growth Agenda projections, the proposed first-year class size for the 2012 fall class was to be 2,115 new first year students; the proposed 2013 fall class was to be 2,155 students, which was revised down to 2,100 due to the restraints of campus housing; the proposed 2014 fall class was to be 2,195 students was revised down to 2,150. Overall, these students were to come primarily from Wisconsin (84%) and Illinois (13%). The remaining 3% of students were to be other non-residents and international students. The projected class size was determined annually in July or August by the Chancellor with input from various constituencies across campus. The actual first-year class size for 2012 came in higher than projected at 2,168. Of that, 1,811 came from Wisconsin (83.5%); 344 (15.9%) came from Illinois; the remaining 68 (3.1%) were other non-residents and international students. Surprisingly, the number of under-represented minority students (URM) from Wisconsin significantly increased in
4|Page
2012 and the number of non-URM students did not meet the recruitment projections. Further, the number of nonresident students came in significantly higher than expected. The actual first-year class size for 2013 (2,108) came in very close to the projected 2,100 students. The number of Wisconsin students was 100 students lower than anticipated with URM students making up some (30) difference in the overall decline in non-URM students from Wisconsin. Our non-resident student numbers continued to be strong in 2013 with a slight dip in URM students from Illinois. The actual first-year class size for 2014 (2,151) again came in very close to projected class of 2,150 students. The number of students recruited from Wisconsin were better aligned with recruitment estimates. Again the number of URM students from Wisconsin increased over projections. The number of students recruited from Illinois was down significantly from 2013, but were very close to enrollment goals for the year. Other non-resident enrollment was down from projections. ii. Transfer class size Transfer students seem to be a bit of an enigma at UW-Whitewater in the way they are counted. There are two types of transfer students – transfer readmits (TA) and regular transfer students (TR). TAs previously attended UWWhitewater at some point in their academic career; TRs never attended UW-Whitewater before enrolling now. For the purpose of this report, transfer students will be TRs. Further, transfer students who enroll during the summer term are not counted in fall enrollment numbers. Summer starters are considered continuing students for fall term. Thus, approximately 60 transfer students each fall semester are not counted in the fall headcount as “new” transfer students. This is not the same for first-time high school students; the high school students can enroll in a summer course, but are still considered first-time freshmen during the fall semester. The proposed number of transfer students was to reflect the UW-Whitewater Growth Agenda enrollment goals. So, transfer student enrollments were remain approximately 700 each fall students to meet these targets. It was also anticipated that the number of transfer students from Illinois will also grow slightly during this time period. The actual number of transfer students for 2012 came in at 715 students. This was an increase of over 7% from the 2011 fall recruitment of transfer students. We were anticipating a larger number of resident students from Wisconsin, but came in behind. The Illinois transfer students were almost 70% above projections and other nonresident transfer students doubled what was expected. The actual number of transfer students for 2013 came in at 689 students, which was down almost 4% from 2012 and 3.5% below recruitment goals based on the Growth Agenda targets. There was a significant drop (nearly 10%) in transfer students from institutions in Wisconsin from 2012 to 2013. Again strong recruitment and enrollment from transfer students in Illinois and other non-residents were about 30% higher than anticipated. The actual number of transfer students for 2014 came in at 706 students, which was up over 2% from 2013 and are near the Growth Agenda goals of 700. The strong enrollment numbers from students transferring from other Wisconsin institutions drove the growth. Again enrollments from Illinois and other non-residents exceeded expectations and continue to be strong. Finally, the trends where transfer students are transferring from and the academic program they enroll in at UWWhitewater will be reviewed later in this document.
5|Page
III.
What have our past enrollment results been? A. Class size i. First-year Table 2: University of Wisconsin – Whitewater Headcount Enrollment 1980 to 2014 2010-11 2011-12 2012-13 2013-14 2014-15 11,557 11,615 12,031 12,015 12,159 Total Enrollment 2,044 1,980 2,168 2,108 2,151 First Year Class 731 715 794 731 706 Transfer (new) 2000-01 10,687 2,077
2001-02 10,566 1,895
2002-03 10,810 2,035
2003-04 10,842 1,833
2004-05 10,955 1,762 650
2005-06 10,769 1,712 630
2006-07 10,502 1,805 626
2007-08 10,737 2,063 649
2008-09 10,962 2,154 663
2009-10 11,139 1,953 636
1990-91 10,841 1,953
1991-92 11,011 1,819
1992-93 11,046 1,785
1993-94 10,897 1,846
1994-95 10,897 1,704
1995-96 10,594 1,900
1996-97 10,679 1,842
1997-98 10,808 1,914
1998-99 10,816 1,931
1999-00 10,841 1,953
1980-81 10,006
1981-82 10,212
1982-83 10,321
1983-84 10,493
1984-85 10,737
1985-86 11,027
1986-87 10,901
1987-88 10,843
1988-89 10,458
1989-90 11,022 1,836
Source: UW System (1989 to 2014) and UW-Whitewater (1980 to 1989) enrollment data The University of Wisconsin – Whitewater (UW-W) enrollment has been stable between 10,006 and 12,148 over the past thirty-five years (Table 2). UW-W has exceeded the 11,000 student plateau on four different occasions (1985-86, 1989-90, 1991-93, 2009-current) during that time and 12,000 students the past three years. UW-Whitewater has grown seven of the last eight years with growth totaling 15.7% (1,646 students) during this time span. The size of the first year class has fluctuated between 1,704 (1994-95) and 2,168 (2012-13). Table 3: Admission/Enrollment Number of New Freshmen Fall 2010 – 2014 2010 2011 2012 2013 Wisconsin WI Minority Illinois IL Minority Other NonResident Other NR Minority International
2014
Apply
Admit
Enroll
Apply
Admit
Enroll
Apply
Admit
Enroll
Apply
Admit
Enroll
Apply
Admit
Enroll
4,094 1,186
3,149 610
1,508 245
4,077 1,342
3,089 688
1,445 269
3,950 1,325
3,135 737
1,448 297
3,958 1,340
3,106 632
1,437 268
3,813 1,501
3,045 720
1,579 251
687
504
195
862
612
209
923
705
282
1,111
808
306
986
744
255
116
69
17
126
79
37
147
97
43
208
108
35
226
128
31
156
114
42
140
96
28
150
104
47
144
111
41
127
87
21
25
11
1
52
25
9
45
18
6
50
15
9
50
15
2
45
20
11
54
18
9
77
36
15
53
22
12
68
34
12
15
10
Adult* 29 16 9 36 15 9 33 12 11 31 7 4 39 (age >=25) 37 20 12 39 23 16 50 33 22 42 24 13 51 Military*/** 6,309 4,477 2,019 6,653 4,607 1,989 6,617 4,832 2,138 6,864 4,802 2,108 6,771 TOTAL New Freshmen * Adult and students with military experience are counted in the state data ** Military includes: disabled veteran, Montgomery, National Guard, National Guard Reserve, Active Reserve, or Post 911
32
22
4,773
2,151
Over the past three years, the number of applications of new undergraduates non-URM students from Wisconsin have dipped about 7% (Table 3) with decreases in enrollments of first-year students from WI in 2011-2013. The applications and enrollment of URM first year students has grown steadily over the past five years from 263 in 2010 to 344 in 2014, a 30% increase during this time period, a significant accomplishment.
6|Page
UW-Whitewater’s growth has also been seen in the number of students from Illinois. The number of students from Illinois has risen from 10.5% of the first year class in 2010 to over 16.0% in 2013. However, the number of applications and enrollment of “other non-resident” students (which includes all non-Wisconsin residents except those from Illinois) has decreased from 2010 to 2014, with the largest decline from 2013 to 2014; however, this group remains a relatively small number compared to Wisconsin and Illinois students. The number of applications of other nonresident URM students has been steady over the past four years. The number of new, first year international students remained small during this time period, about 9 to 15 students a year; first year adult students and students with military experience together account for 1% of all first year students and have decreased slightly over the past two years. For tracking purposes of this report, students who are at least 25 years old are considered “Adult” students. ii. Transfers Table 4: Admission/Enrollment Number of New Transfer Students Fall 2010 – 2014 2010 2011 2012 2013 Apply
Admit
Enroll
Apply
Admit
Enroll
Apply
Admit
Enroll
Apply
Admit
Enroll
Apply
1,358 843 634 1,383 852 633 1,284 853 596 1,391 849 561 1,251 Wisconsin 167 94 60 185 113 62 254 175 118 265 177 107 253 Illinois 80 34 22 58 22 17 93 49 30 73 36 21 84 Other NR 271 160 118 287 164 113 284 171 126 342 186 141 300 Adult* 76 41 26 64 34 23 74 43 36 75 42 28 75 Military** 1,605 971 716 1,626 987 712 1,631 1,077 744 1,729 1,062 689 1,588 TOTAL * Adult and students with military experience are counted in the state data ** Military includes: disabled veteran, Montgomery, National Guard, National Guard Reserve, Active Reserve, or Post 911
2014 Admit
Enroll
815
575
170
111
42
20
175
135
47
36
1,027
706
Table 4 shows that there has been almost no growth of applications or enrollment of transfer students between Fall 2010 and Fall 2014. The growth that has occurred with transfer students has been with students from Illinois, but the size of that group is approximately 10% of the Wisconsin transfer population. Adult students and students with military experience account for over 15% and 3% of all transfer students respectively. The number of applications and enrollment for adult students has grown steadily over the past four years while the military numbers have grown about 10%. iii. High School Specials There are currently four opportunities for high school students to complete college-level courses through UWWhitewater: Youth Options program (YOP), Course Options (CO), Partners in Education (PIE) and high school specials. There is great uncertainty in terms of providing college credit for high school students in the future as funding for the Course Options program is up-in-the-air until the next legislative budget. The YOP program allows high school students to enroll in UW-Whitewater credit courses on the UW-Whitewater campus. The Wisconsin legislature created the Post-Secondary Enrollment Options (PSEO) program, later renamed Youth Options, in 1991 (s. 118.55, Wis. Stats.). YOP legislation allows high school students to enroll in public and private institutions of higher education with credits applied to high school graduation requirements and/or postsecondary programs. The CO program started in 2013 to allow students in Wisconsin public schools to enroll in up to two courses at a time. CO courses are to be offered at no cost to students, and school districts are expected to pick up the cost; in 2014 the costs are being covered by the UW System. The PIE program is similar to YOP and CO, but allows high school students to earn college credit in their high school. The program is a local UW-Whitewater program that started in 2012 and utilizes courses from X departments. Instructors are selected on the basis of criteria set up by each UW-Whitewater academic department; all require a master’s degree or significant graduate-level course work.
7|Page
Program Credits Eligibility for Admission
Tuition Location of courses Enrollments Fall 2014
Table 5: Types of Dual Enrollment Programs High School Students Youth Options Course Options (CO) Partners in Education Program (YOP) (PIE) 2 courses; 2 courses 1-2 courses Max. of 7 credits Junior or Senior Grades 9-12; Rank in the top 25% standing; Rank in the top 25% of high school class Rank in the top 25% of high school class OR of high school class; HS GPA of at least HS GPA 3.50 3.25 on a 4.0 scale OR ACT score of 24 and class rank in the top 50 percent School district pays UW System pays the $394 per 3-credit the UW course tuition tuition course UW-Whitewater UW-Whitewater Local high school campus campus or on-line 22 2 230
High School Special College credit students must meet the course prerequisites or receive consent from their advisor
Student pays the tuition UW-Whitewater campus or on-line Xx
8|Page
IV.
What is the Profile of our incoming students? A. Class Profile.............................................................................................................................................................. i. First Year students The academic profile of our traditional-aged undergraduates (Appendix Table 6) has remained relatively constant over the past five years. Over the past five years, students attending UW-Whitewater, on average, have a 22.1 to 22.5 (Table 7) average ACT composite score, a 3.20-3.26 high school GPA, and rank in the mid-sixtieth percentile of their high school class. Over the past five years, UW-Whitewater averages 520 new students (nearly 25% of the class) with an ACT composite of 25 or over, which places their score in the top 25% of all test takers nationally (ACTstudent.org). Likewise, UW-Whitewater averages 93 new students (5% of the class) with an ACT composite of 16 or below, which places their score in the bottom 25% of all test takers. The majority (69%) of UW-Whitewater students have an ACT composite between 17 and 24, or the middle quartiles (UW-Whitewater Institutional Research, 2011 and 2014). Table 6: Academic Profile of New First Year Students by Type Fall 2009 Fall 2011 Applied
WI New Freshman ACT (inc. minority/cov)HS GPA HS % Rank WI NF Minority ACT HS GPA HS % Rank IL-New Freshman ACT (inc. minority) HS GPA HS % Rank IL Minority NF ACT HS GPA HS % Rank Other Non Res NF ACT (inc. minority) HS GPA HS % Rank Other NR Minority ACT HS GPA HS % Rank Adult ACT HS GPA HS % Rank Military ACT HS GPA HS % Rank TOTAL New FreshmenACT HS GPA HS % Rank
21.53 3.03 58.56 18.46 2.65 52.16 22.34 3.04 56.52 20.19 2.56 41.47 21.58 3.09 54.12 18.91 2.72 35.14 18.22 2.22 38.47 21.39 2.71 49.28 21.63 3.03 58.16
Admit
22.67 3.27 66.91 19.53 3.01 64.43 23.21 3.23 63.88 22.21 2.9 51.81 22.56 3.23 60.70 21.59 3.01 55.00 19.33 2.44 50.50 21.96 2.80 53.17 22.74 3.27 66.42
Enrolled
22.34 3.23 64.24 18.84 2.96 64.31 22.83 3.20 60.64 22.42 2.85 45.38 21.89 3.05 53.01 23.17 2.85 54.17 17.00 2.73 73.00 21.51 2.78 54.69 22.39 3.22 63.68
Applied
21.43 3.05 60.39 18.31 2.71 57.94 22.26 3.08 54.84 20.26 2.72 41.21 21.64 3.02 53.58 21.71 3.03 55.45 20.50 2.04 30.43 20.65 2.60 41.97 21.57 3.06 59.46
Admit
22.54 3.29 67.67 19.75 3.09 68.60 23.10 3.25 61.80 21.65 2.98 49.61 22.42 3.20 60.86 20.36 3.08 55.72 21.00 2.14 34.00 21.17 2.83 52.39 22.63 3.28 66.63
Enrolled
22.29 3.26 65.07 19.42 3.02 64.70 22.54 3.26 59.68 20.93 2.93 51.52 21.81 3.19 58.46 21.06 3.20 55.88 22.00 2.12 38.60 20.16 2.75 49.00 22.32 3.26 64.28
Fall 2014
Applied
21.42 3.04 57.50 18.86 2.70 54.32 22.59 3.10 55.28 21.13 2.89 51.18 22.31 3.19 62.15 20.57 2.91 55.80 21.31 2.70 48.86 22.91 2.78 48.44 21.65 3.05 57.16
Admit
22.59 3.29 64.69 20.71 3.12 65.74 23.36 3.26 61.71 22.58 3.14 58.95 23.80 3.39 67.43 24.02 3.36 63.00 21.75 2.77 50.02 22.63 2.88 61.40 22.76 3.29 64.30
Enrolled
22.42 3.23 61.19 20.52 3.02 59.93 22.85 3.27 59.91 21.81 3.05 54.21 22.94 3.61 73.15 22.00 3.59 62.75 21.94 2.77 49.51 19.78 2.84 48.07 22.49 3.24 61.12
Source: UW Whitewater Admissions Data 2011, 2014 Underrepresented minority students from Wisconsin have a significantly lower average ACT composite score of 20.52 compared to the overall average of 22.49 for Fall 2014 (-1.97 points). The Illinois ACT composite scores (both nonURM and UMR rates) were, on average, above the counterpart Wisconsin rates by approximately .4 points for nonURM students and 1.3 points for URM students. But, their high school GPA was almost identical and their high school rank was significantly lower than both the overall average and Wisconsin minority average. The other non-resident rates vary dramatically year-to-year due to the overall small numbers in that category. Nearly all adult students and students with military experience start at UW-Whitewater as transfer students; only 25 new first-year students compared to 126 transfer students between the two groups for Fall 2011. The first-year adult students have a similar average ACT to first-time students, but lower high school GPA and class rank. The same is true for the students with military experience, but the numbers of those students is really too small to compare to the larger number in the overall first-year class.
9|Page
Cohort
N=
Blank no score
2014 2013 2012 2011 2010
2,151 2,108 2,168 2,006 2,044
32 31 33 33 34
Table 7: ALL Students by ACT Composite Cohort 2010-2014 ACT Comp ACT Comp ACT Comp ACT Comp >=17 & =21 &