2nd Nov 2016
An Overview
Spices Quarterly Report
An Overview
Cardamom
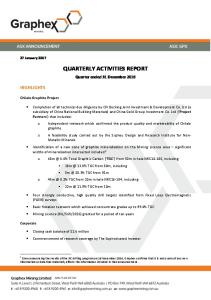
JAS 2016 Performance Recommendation: Buy MCX Cardamom Aug at 840-835 TP 1050 SL 730
For JAS 2016 quarter, KCTL had recommended a buy in cardamom for a target of Rs.1050 per kg.
1300 1200
On 18th July 2016, MCX Cardamom futures made a low of
1100
Rs.880 per kg, hence entry point was missed by Rs.40.
1000
On 16th Aug 2016, cardamom futures achieved the target of 900
Rs.1050 per kg and went on to make a historical high of Rs.1256
800
per kg on 14th Sept 2016.
700
Sep-16
Sep-16
Sep-16
Sep-16
Sep-16
Aug-16
Aug-16
Aug-16
Aug-16
Jul-16
Jul-16
Jul-16
Jul-16
Jul-16
600
Price Movement During the second quarter of FY16 i.e., JAS 2016, cardamom futures Futures
Spot
extended their bullish trend, which had begun in March 2016.
1300
Expectation of lower crop output and delay in commencement of 1200
harvesting due to unfavorable weather condition supported the uptrend for cardamom futures.
1100
Prolonged dry spell and heat conditions during the period from Dec 2015
1000
to Apr 2016 affected flower setting process, which in turn had reduced 900
the yield considerably.
800
The bullish trend continued till mid September and reached four year high of Rs.1256/kg.
700
Harvesting for current season commenced from September after a delay
Source: Bloomberg, KCTL Research
Sep-16
Sep-16
Sep-16
Sep-16
Sep-16
Aug-16
Aug-16
Aug-16
Aug-16
Jul-16
Jul-16
Jul-16
Jul-16
Jul-16
600
of over a month.
After making multi-year high, prices witnessed some correction as the arrivals of fresh harvest crop increased considerably after Onam festival in Kerala i.e., after 15th Sept 2016.
4
Balance Sheet Total Supply
Total Demand
Crop Year Beginning Stocks
Production
Consumption
Export
Ending Stocks
2010-11
430
10380
9000
1175
635
2011-12
635
15000
10500
4650
485
2012-13
485
14000
11000
2372
1113
2013-14
1113
16000
12000
3600
1513
2014-15
1513
18000
14000
3795
1718
2015-16
1718
27000
19000
5500
4218
2016-17(E)
4218
19000
18000
4500
718
Unit: Tonnes Source: KCTL Research, Spices Board, Trade Sources
5
Balance Sheet During the year 2015-16, India had recorded a bumper cardamom harvest, which is pegged at 27,000 (+50% Y/Y) MTs due to favourable weather condition during flowering stage. However, the production during 2016-17 is expected to decline on dry weather conditions with absence of summer showers in Kerala.
Poor monsoon performance especially in Idukki, the major producer district of cardamom in Kerala affected the crop further delaying the harvesting process and total number of pickings is expected to be around 3-4 against normal of 5-6 pickings. Seasonal Rainfall from 1st June till 30th Sept 2016 in Idukki district was at 1569.5 mm, lower by 31% from its normal rainfall of 2276.2 mm. Hence, crop production for the current season is expected to be around 19,000 tonnes, lower by 30% Y/Y. For the 2016-17, supply and demand dynamics looks close to each other mainly due to estimations of lower production; further, we expect ending stocks may witness a sharp decline from previous year.
6
Export – Yearwise Volume
India is the second largest exporter of cardamom after Guatemala.
Value
6000
5000
4000
50000
Even though there is higher price disparity between Indian and
45000
Guatemalan cardamom in the International market, Indian variety is
40000
preferred due to its superior quality.
35000
Major overseas market for Indian cardamom are the Gulf countries
30000
such as Saudi Arabia, Kuwait and UAE along with the United States and Japan.
3000
25000
Exports during 2015-16 increased by 45% Y/Y to 5500 MTs as 20000 2000
1000
0 2011-12
2012-13
Export in MT Value in Rs.lakhs Source: Spices Board of India
2013-14
2014-15
2015-16
prices fell sharply in India due to bumper crop output thereby
15000
making exports competitive in international market.
10000
However, for the year 2016-17, export volumes are expected to be
5000
at around 4500 MTs, lower by 15-20% from 2015-16 as production
0
is estimated to decrease coupled with higher prices of the aromatic spice. 7
Direction of Trade – JAS 2016 During JAS 2016, India had exported around 1211 MTs, higher Iran 5%
Australia 5% United Arab Emirates 7%
by 61 MTs Q/Q. United States and Saudi Arabia remained top importers
Others 7% United States 34%
Canada 9%
accounting for 34% and 33% of total export volume during the
quarter. Remaining part of the export volumes were to countries such as Canada, United Arab Emirates and other countries. Monthly average spot prices of Indian extra bold 6-7 mm at
Saudi Arabia 33%
international market were $14.67/kg, $16.57/kg and $17.45/kg in July, August and September respectively.
8
Fundamental Outlook As per our analysis, Cardamom futures market are expected to trade higher for the OND quarter on positive factors in the market. Production for the current year is estimated to decrease sharply compared to previous year which may support the cardamom futures to trade higher. Further, quality of the crop is expected to be mostly inferior as deficit rainfall has impacted the quality of the produce adversely. Exports are expected to be above the five year average of 4000 MTs, however may decrease from previous year volume due to lower production and higher prices. Conventional demand for Indian cardamom is expected from the Middle East countries such as Saudi Arabia, Kuwait etc during the financial year. Carry over stocks for the year 2016-17 is expected to dip sharply compared to carry over stocks of 2015-16. Considering the above factors, we recommend buying cardamom futures for the OND Quarter.
Technical Outlook Expected Trend: Bullish Historically Cardamom made 3-years low level in February month (629) and during the month it made multi month high (1345) level on continuous chart. Technically price travel too long within a year. At present price trade near to multi month high level on board and any correction would provide buying opportunity for long term. Stochastic oscillator trade in near 82 level and MACD trade above zero line on weekly chart.
Commodity/ Contract
Strategy
Entry
Target
Stop Loss
Cardamom/Dec
Buy
1250-1270
1500
1125
Note: Recommendation is in December contract, January is running with a premium Rs.6, Target and Stop loss will adjust as per premium for near month contracts.
An Overview
Coriander
JAS 2016 Performance Recommendation: Buy Coriander (Dhaniya) NCDEX August at 6700-6650 TP 8500 SL 5900
In the report released on 8th July 2016, KCTL Research had recommended buying for coriander futures in JAS quarter.
Futures 9000
On 11th July 2016, NCDEX coriander futures made a low of 8500
Rs.7340 per quintal, hence entry point was missed by Rs.640.
8000
On 29th July 2016, coriander futures achieved the target of Rs.8500 per quintal and went on to make a historical high of
7500
Rs.8730 per quintal on 2nd Aug 2016.
7000
Sep-16
Sep-16
Sep-16
Sep-16
Sep-16
Aug-16
Aug-16
Aug-16
Aug-16
Jul-16
Jul-16
Jul-16
Jul-16
Jun-16
6500
Price Movement Futures
During JAS 2016, coriander futures witnessed trade in both
Spot
9000
directions. During the month of July, coriander futures were on uptrend extending the earlier positive trend, which started at the end of
8500
AMJ 2016 quarter on emergence of export demand. However, market failed to sustain the positivity and thereafter
8000
coriander futures mostly traded sideways with negative bias for the rest of the quarter. 7500
Export buying also declined in the spot market which led to fall of coriander prices both in spot and futures market during the
7000
end of the quarter under review. Reports of inferior quality stocks deposited in the NCDEX warehouses had created concerns among market participants. Sep-16
Sep-16
Sep-16
Sep-16
Sep-16
Aug-16
Aug-16
Aug-16
Aug-16
Jul-16
Jul-16
Jul-16
Jul-16
Jul-16
6500
13
Balance Sheet Total Supply
Total Demand
Crop Year Beginning Stocks
Production
Imports
Domestic Consumption
Exports
Ending Stocks
2010-11
0.70
3.72
0.00
3.40
0.41
0.61
2011-12
0.61
4.29
0.04
3.60
0.28
1.06
2012-13
1.06
5.03
0.04
3.80
0.36
1.97
2013-14
1.97
4.96
0.05
3.90
0.46
2.62
2014-15
2.62
3.47
0.10
4.10
0.46
1.63
2015-16
1.63
4.08
0.25
4.20
0.40
1.36
2016-17(E)
1.36
3.68
0.10
4.30
0.40
0.44
Unit : Lakh Tonnes Source: KCTL Research, Spices Board, Trade Sources
14
Balance Sheet Coriander production declined marginally during the 2016-17 marketing season due to unfavorable weather condition at the time of harvest. Estimated crop production is around 3.68 lakh tonnes against last year’s production of 4.08 lakh tonnes. In the year 2015-16 marketing year, coriander crop quality was deteriorated because of unseasonal rainfall at the time of peak harvest. On the demand side, exports as well as domestic consumption are witnessing a rise over the years. Export demand for coriander has increased manifold over the years on increased consumption demand from major importers. The domestic consumption is more than exports. Consumption is around 4.20 lakh tonnes while exports are only about 0.40 lakh tonnes.
The ending stock is for the year 2016-17 is expected to be around 0.44 lakh tonnes.
15
Export – Yearwise Volume
Value
India is the largest-producer and exporter of coriander in the global
50000
60000
45000
market. The exports have increased significantly in the past decade due to strong demand from the overseas markets.
50000
40000
The changing pattern of food consumption, especially in the
35000
40000
30000
developed countries and the large population of Indian origin in these countries has resulted in good export orders for Indian spices.
25000
30000
20000
20000
15000
There was a marginal increase in coriander exports from India. According to Spices Board data, Indian coriander exports during the year 2015-16 was at 40100 MTs, lower by 4900 MTs compared to
10000
10000
46000 MTs during 2014-15.
5000
For the year 2016-17, no major change in export volume is 0
0
2011-12
2012-13
Export in MT Value in Rs.lakhs Source: Spices Board of India
2013-14
2014-15
2015-16
expected and is projected at around 40000 MTs.
16
Direction of Trade – JAS 2016 During JAS 2016, Indian coriander exports were around 5331 MTs, lower by 4968 MTs compared to first quarter of
Kuwait 3% South Africa 5%
FY16.
Others 11%
Top importing nation during the quarter was Malaysia with a Malaysia 47%
share of 47% while United States stood second with a share of 29%. The other importing nations were South Africa, Kuwait and
United States 29%
Singapore.
Monthly average spot prices of Canadian coriander at international market remained at $0.60/pound during
July,
August and September months.
Export in MT Source: Spices Board of India, Zauba
17
Fundamental Outlook Coriander futures are expected to trade higher during the OND 2016 Monsoon rainfall in Rajasthan ended with higher rainfall from its normal while rainfall was mostly normal in Gujarat. Sowing of coriander in rabi season has started slowly and is expected to pickup pace after Diwali festival. There are concerns that farmers may shift towards jeera and chana in Rajasthan and Gujarat due to relatively higher price realization during current season; hence, we expect about 20-25% shift in area from coriander. Current stocks in the production centers are expected to be just sufficient for consumption till the arrival of new crop in March. In the production centers, most of the stocks are with stockiest who are waiting for demand to pickup in coming days to offload their
stocks at higher prices. Looking into above mentioned factors, we recommend buying coriander futures for the OND quarter 2016.
18
Technical Outlook Expected Trend: Bullish Last couple
of
weeks we
observed that
price
continuous made new low on weekly basis. From technical perspective we observe that price trade
in a channel which suggest price is in the consolidation phase of the pattern. We expect price gradually rises and it will again touch the upper line of channel in future. The oscillator indicator stochastic is still in an oversold zone in weekly chart so we recommend buying on correction around buying range.
Commodity/ Contract
Strategy
Coriander/Nov
Buy
Entry
7100-7150
Target
8300
Stop Loss 6650
Note: Recommendation is in November contract, December is running with a discount of Rs.90, Target and Stop loss will adjust as per premium for near month contracts.
An Overview
Jeera
JAS 2016 Performance Recommendation: Buy NCDEX Aug Jeera 50% of investment at 17900-17800 and more 50% at 16800-16700 TP 20200 SL 15800
For JAS 2016 quarter, KCTL had recommended a buy in jeera futures.
The recommended contract made a low of Rs.18550 per
Futures
quintal thereby missing the entry level by Rs. 650.
20000 19000
During the quarter market moved as per our expectation and made a high of Rs.20150 per quintal, which is near to our
18000
target level of Rs.20200 per quintal 17000 16000
Sep-16
Sep-16
Sep-16
Sep-16
Sep-16
Aug-16
Aug-16
Aug-16
Aug-16
Jul-16
Jul-16
Jul-16
Jul-16
Jul-16
15000
Price Movement Futures 20000
Spot
During JAS 2016 quarter, jeera futures gained sharply as strong demand amid deficit supply concerns supported the futures prices.
19000
Jeera futures rallied
to its
historical
high of
Rs.20150/quintal as speculations of shortage of supply supported the gains for jeera futures. 18000
After making its historical high, jeera futures reversed their trade on downward direction due to profit 17000
booking at higher levels. The higher prices also limited the sentiments of
16000
active buying at the spot markets. Export demand reduced significantly due to higher
15000
price quotes. 22
Balance Sheet Total Supply
Total Demand
Crop Year Beginning Stocks
Production
Exports
Consumption
Ending Stocks
2011-12
1.45
4.04
0.46
3.31
1.72
2012-13
1.72
4.63
0.86
3.24
2.25
2013-14
2.25
3.94
1.22
2.76
2.21
2014-15
2.21
2.84
1.56
3.12
0.37
2015-16
0.37
3.13
0.98
2.23
0.33
2016-17 (E)
0.33
2.80
1.00
1.92
0.21
Unit : Lakh Tonnes Source: KCTL Research, Spices Board, Trade Sources
23
Balance Sheet Estimated crop production is around 2.80 lakh tonnes, down by 11% y/y. The decline in production is mainly due to unseasonal rainfall in major growing regions during crop growing stage. The domestic consumption is more than exports. Consumption for 2015-16 is estimated at 2.23 lakh tonnes. Ending stocks are estimated at 0.33 lakh tonnes for 2015-16 against 0.37 lakh tonnes estimated for 2014-15. During 2015-16, India had exported 0.98 lakh tonnes of cumin seeds, down by 37% Y/Y. Jeera ending stocks for 2016-17 is expected to be 0.21 lakh tonnes as per preliminary estimates. The domestic consumption to be tracked closely as the prices have increased sharply over a year.
24
Export – Yearwise Volume
India is the largest exporter of Jeera and has a market share of
Value
180000
200000
about 70-75%. Syria and Turkey are the second and third largest
160000
180000
producers of Jeera in the global market contributing over 15% of
140000
160000
the world supply.
120000 100000
140000
120000 100000
80000 60000
During 2014-15, India exported 155000 tonnes of jeera, the highest
60000
ever as sowing and production in Syria and Turkey was subdued.
40000
20000
20000
Export in MT Value in Rs.lakhs Source: Spices Board of India
2011-12 until 2014-15.
80000
40000
0
Jeera exports were in a rising trend for the past few years from
However, during 2015-16, export decreased to 98700 MTs, lower by 37% compared to previous year export of 155500 MTs.
0
25
Direction of Trade – JAS 2016 During JAS 2016 quarter, India had exported around 20690 MTs, lower by 20310 MTs compared to first quarter of FY16. Vietnam 31%
Others 32%
Top importing nation during the quarter was Vietnam with an export share of 31% while United States stood second with a
share of 14%. The other importing nations were Sri Lanka, Bangladesh, Brazil and Malaysia.
Malaysia 4% Brazil 5%
United States 14% Bangladesh 7%
Sri Lanka 7%
Monthly average spot prices of Indian origin jeera at international market were $1.57/pound,
$1.67/pound and
$1.64/pound in July, August and September respectively.
Export in MT Source: Spices Board of India, Zauba
26
Fundamental Outlook As per our analysis, We expect jeera futures to trade on lower note during OND 2016 quarter. Expectations of increased sowing acreage for jeera in rabi season may result in negative sentiments on the futures market. Sowing of jeera for rabi season has started slowly and is expected to pickup its pace and cover rapidly after Diwali festival. Though, stocks at production centers are reported to be lower compared to previous year, it is expected that it is sufficient to cater to the consumption demand till the arrival of new season crop in March 2017. As far as the international scenario is concerned, production is expected to decrease in other major producer countries such as Syria and
Turkey. Looking into above mentioned factors, we recommend selling jeera futures for the OND quarter 2016.
Technical Outlook Expected Trend: Bearish Last couple of weeks we observed that price continuous made new low on weekly basis. Price made “Doji Candle” at first week of August month followed by bearish candle and after this prices
continue made newer low on board. From technical perspective, we observe that stochastic oscillator trade near overbought zone in daily timeframe and expect now it’s time to make
short position in it. The momentum indicator MACD is still in a bearish tone in daily chart and100 days SMA around 17940 level on daily chart.
Commodity/ Contract
Strategy
Entry
Target
Stop Loss
Jeera/Nov
Sell
17650-17850
15000
18400
Note: Recommendation is in November contract, December is running with a premium Rs.235, Target and Stop loss will adjust as per premium for near month contracts.
An Overview
Turmeric
JAS 2016 Performance Recommendation: NCDEX Turmeric Aug Buy 50% of investment at 7850-7800 & more 50% at 7400-7350 TP 9400 SL 6700
In the report released on 8th July 2016, KCTL Research had recommended buying for turmeric futures in JAS quarter.
Our call initiated on 11th July 2016 when turmeric futures
Futures
reached Rs.7828 per quintal and market moved in the direction
9000
as predicted by KCTL Research.
8000
Futures prices made a high of Rs.8450 per quintal on 5th Aug 2016.
7000
Our second entry levels of Rs.7350 per quintal got initiated on 23rd Aug 2016; however it continued to trade lower and missed the stop loss level of Rs.6700/quintal by Rs.28 on 12th Sept Sep-16
Sep-16
Sep-16
Sep-16
Sep-16
Aug-16
Aug-16
Aug-16
Aug-16
Jul-16
Jul-16
Jul-16
Jul-16
Jul-16
6000
2016.
Price Movement Futures
During JAS 2016 quarter, turmeric futures fell sharply tracking weak
Spot
cues from the spot market.
9000
Weak demand at the spot market amid sufficient supplies weighed down the futures market. Good monsoon rainfall across turmeric growing regions and higher
8000
prices for turmeric before commencement of sowing season facilitated sharp increase in acreage under turmeric. With delayed onset of monsoon and slower progressing initially,
sowing activities delayed; however there was a steady pace after
7000
July. Turmeric futures also made a multiyear low of Rs.6750 per quintal as stocks increased sharply at NCDEX warehouse in Sangli.
Source: Bloomberg, KCTL Research
Sep-16
Sep-16
Sep-16
Sep-16
Sep-16
Aug-16
Aug-16
Aug-16
Aug-16
Jul-16
Jul-16
Jul-16
Jul-16
Jul-16
6000
31
Balance Sheet Total Supply
Total Demand
Crop Year Beginning stock
Production
Domestic Consumption
Exports
Ending stocks
2012-13
3.59
4.36
3.50
0.89
3.56
2013-14
3.56
4.21
3.60
0.78
3.40
2014-15
3.40
4.12
3.16
0.86
3.50
2015-16
3.50
4.60
3.50
0.89
3.71
2016-17 (E)
3.71
4.22
3.50
1.00
3.43
Unit : Lakh Tonnes Source: KCTL Research, Trade Sources
32
Balance Sheet Production of turmeric in 2016-17 fell by 8% Y/Y because of poor performance of the crop due to deficient monsoon during kharif season. Crop damage was reported in parts of Tamil Nadu due to floods, however, it managed to survive its production similar to previous year due to higher acreage.
Turmeric exports are expected to rise to 1 lakh tonnes in 2016-17 from 0.85 lakh tonnes in 2015-16 as consistent demand for hybrid variety and rise in consumption of turmeric based products may support the exports. On consumption front, the domestic consumption is more or less same from the year 2015-2016 to 2016-17 because of the steady industrial usage as well as value added usage of turmeric.
33
Export – Yearwise Volume
India being the top producer of turmeric enjoys a top position in
Value
100000
90000
turmeric trade in the International market.
90000
88000
The year of 2012-13 witnessed a sharp increase in export volume to
80000
86000
88513 MTs; however dipped in the following year to 77500 MTs.
70000
84000
60000
82000
50000
80000
40000
78000
According to Spice Board data, Indian turmeric exports has witnessed
30000
76000
a hike during the financial year 2014-15 to 86,000 tonnes against
20000
74000
78,000 tonnes exported in 2013-2014
10000
72000
0
70000
Export in MT Value in Rs.lakhs Source: Spices Board of India
From 2013-14, exports volume are in a rising trend due to increasing consumption of turmeric based products in export markets.
During 2015-16, exports volume registered a small hike at around 88500 tonnes, up by 3% from 86000 tonnes during 2014-15.
34
Direction of Trade – JAS 2016 During JAS 2016 quarter, Indian turmeric exports were at around 13628 MTs, lower by 15000 MTs compared to first quarter of FY16. Others 28%
Iran 30%
Iran remained the top importer during the quarter with a share
of 30% in export volume while Malaysia stood second with a share of 14%. Bangladesh and Tunisia shared the third position in terms of Iraq 6% Sri Lanka 4%
Malaysia 14% Bangladesh 7%
Tunisia 7%
volume with a share of 7% each. The other importing nations were Iraq, Japan, Sri Lanka and UAE and Saudi Arabia. Monthly average spot prices of Indian origin turmeric at
international market were $1.51/pound, $1.55/pound and $1.53/pound in July, August and September respectively. 35
Sowing Outlook & Progress - 2016 Sowing is almost complete in all major growing states with higher acreage due to supportive weather conditions which
State
2016-17 Area
2015-16 Area
% Change
prevailed during sowing activities. Telangana
45630
40820
12%
Andhra Pradesh
16780
15750
7%
acreage towards turmeric.
Maharashta
20000
15000
33%
Crop is mostly in vegetative stage across sowing belts with no
Tamil Nadu
15000
12000
25%
Relatively higher prices at the major spot markets compared to previous year along with normal rainfall resulted in shifting of
reports of pest attacks or disease to plants. Area in Telangana has increased by 12% at 45630 hectares
Unit: hectares Source: State Agriculture Department and Trade Sources
compared to previous year acreage of 40820 hectares while marginal increase in acreage of 7% was registered in Andhra Pradesh. Sharp increase in area was witnessed in Maharashtra and Tamil Nadu where farmers have shifted to turmeric from cultivating sugar cane. 36
Fundamental Outlook As per our analysis, We expect turmeric futures to trade lower for the OND quarter tracking negative sentiments in the market. Higher acreage under turmeric cultivation, which is up by 20% Y/Y is resulting into increased production Weather conditions are expected to remain favorable throughout growth and harvesting stages of crop; which infers that the crop size may be very higher compared to current year crop. Even though production decreased marginally during 2016-17 crop, carry over stocks are currently higher in the market and is sufficient to cater to any fresh demand from both domestic and international markets.
Demand from masala and pharmaceutical industries is expected to be on the need based buying as they expect higher crop size for next season. Looking into above mentioned factors, we recommend selling turmeric futures for the OND quarter 2016.
37
Technical Outlook Expected Trend: Bearish We can easily identify that price break the weekly support trend line which is shown as red color. It is a general behavior that price may come to touch again the trend line and after this it continue prevailing trend. Technically we will be looking for selling opportunities while the price action is rising again. The momentum indicator MACD is still in a bearish tone in weekly chart with -329 value.
Price trade below SMA of 50 & 100 days on weekly chart which suggest bearish trend.
Commodity/ Contract
Strategy
Entry
Target
Stop Loss
Turmeric/Nov
Sell
7700-7800
6500
8300
Note: Recommendation is in November contract, December is running with a discount of Rs.170, Target and Stop loss will adjust as per premium for near month contracts.
Prepared by:Function
Analyst
Head of Research-Commodity
Veeresh Hiremath
Fundamental Analyst
Anup.B.P
Technical Analyst
Ronak Kumar Bhavsar
Disclaimer The report contains the opinions of the author, which are not to be construed as investment advices. The author, directors and other employees of Karvy and its affiliates cannot be held responsible for the accuracy of the information presented herein or for the results of the positions taken based on the opinions expressed above. The above mentioned opinions are based on the information which is believed to be accurate and no assurance can be given for the accuracy of this information. There is risk of loss in derivatives. The author, directors and other employees of Karvy and its affiliates cannot be held responsible for any losses in trading. Commodity derivatives involve substantial risk. The valuation of underlying assets may fluctuate, and as a result, clients may lose entire value of their original investment. In no event should the content of this research report be construed as an express or an implied promise, guarantee or implication by or from Karvy Comtrade that the reader/client will profit or that losses can or will be limited in any manner whatsoever. Past results are no indication of future performance. Information provided in this report is intended solely for informative purposes and is obtained from sources believed to be reliable. The Information contained in this report is in no way guaranteed. No guarantee of any kind is implied or possible where projections of future conditions are attempted. We do not offer any sort of portfolio advisory, portfolio management or investment advisory services. The reports are only for information purpose and not to be construed as investment advices. Disclaimer http://karvycommodities.com/disclaimer ; http://karvycommodities.com/risk-disclaimer