Solubility of carbon dioxide in water-t-butanol wlutions PEETERKRUUSAND CATHERINE A. HAYES
Can. J. Chem. Downloaded from www.nrcresearchpress.com by MICHIGAN STATE UNIV on 01/24/17 For personal use only.
Departmetzt of Chemistry, Corleton Utliversity, Ottawa, Ont., Canada K I S 586 Received March 19, 1985
PEETER KRUUS and CATHERINE A. HAYES. Can. J . Chem. 63, 3403 (1985). The solubility of carbon dioxide has been determined in tertiary butanol - water mixtures over the temperature range 1-25°C. The solubility exhibits a sharp, temperature-dependent minimum in water-rich solutions corresponding to a maximum in the activity coefficient of t-butanol, which has also been determined. The activity coefficient of t-butanol has a prominent temperature-dependent maximum (y > 7.0) at a solution composition of about 0.06 mole fraction alcohol. Application of the scaled particle theory indicates that volume effects are a governing factor in the gas solubility, but are insufficient to explain the total effect. The pH of t-butanol-water and t-butanol-water-C02 mixtures reveals no major anomalous solvation effect. PEETER KRUUS et CATHERINE A. HAYES. Can. J . Chem. 63, 3403 (1985). Operant dans un intervalle de temperature aliant de I h 25"C, on a dCterminC la solubilite du dioxyde de carbone dans des mClanges de tert-butanol/eau. La solubilite presente un minimum prononcC qui dCpend de la temperature dans des solutions riches en eau qui correspondent h des maxima dans les coefficients d'activitk du tert-butanol que I'on a aussi determinis. A une composition de la solution correspondant h une fraction molaire en alcool d'environ 0,06, lcs coefficients d'activite du tert-butanol presentent un important maximum (y > 7,O) qui varie avec la temperature. L'utilisation de la thCorie des particules divisCes indique que les effets de volume sont les facteurs qui influencent la solubilit6 du gaz; toutefois, ils ne suffisent pas pour expliquer I'effet global. Le pH de mClanges de tert-butanolleau et de tert-butanol/eau/C02 ne revele pas d'anomalies importantes dans l'effet de solvatation. [Traduit par le journal] 1. Introduction Carbon dioxide in its various states plays an important role in both natural and industrial processes. Recently, liquid and supercritical carbon dioxide have found wide-scale use for extractions in the food and mining industries, and are of potential use in tertiary oil recovery. Although many bulk properties of carbon dioxide solutions have been characterized, little is known of the fundamental interactions of carbon dioxide with nonelectrolyte solutes in aqueous solution. The study of simple carbon dioxide - nonelectrolyte - water systems may provide models which can be applied to more complex systems. Tertiary butanol was chosen as a co-solute in this study for several reasons: (i) it is miscible with water in all proportions, (ii) many properties of t-butanol-water solutions have been investigated (1, 2), and (iii) the peculiar features of alcoholwater solutions are particularly well-developed in aqueous t-butanol due to its bulky alkyl group. Although there have been several studies of the solubility of gases in water-alcohol systems (3, 4), the combination of water (subscript 1) t-butanol (subscript 2) - carbon dioxide (subscript 3) has not been investigated to date. The solubility of a substance in a two-component solvent system is fundamentally related to the chemical potentials of the two solvent components. Other "continuum" properties of the solvent system are also related to the chemical potentials (or their derivatives) of the components. Kenttamaa et al. (2) have obtained the activities of the components of water-t-butanol at temperatures above 25°C. However, in spite of the great number of experimental studies of continuum-type properties of this system ( I , 5 , 6 ) the component activities at temperatures below 25°C have not been reported in the literature. Such activities are reported here for 1°C and 10°C.
Experimental (a) Materials The following chemicals were used in this study: filtered Millipore deionized water, freshly distilled Fisher Certified t-butanol, Matheson Research Grade carbon dioxrde (99.95%), and helium (99.9999%).
The composition of the water-t-butanol solvent mixture was determined through refractive index measurements. (b) Apparatus The apparatus for the measurement of gas solubility can best be described as a modified BET-type apparatus used normally to measurc the adsorption of gas on a solid. It consists of a constant-volume manometer, a seven-bulb gas burette, and a solubility cell which contains the liquid sample. The volume of each bulb in the gas burette is known to 50.0002 cm3 through dcterrnination of thc mass of mercury it contains. The mercury level in the manometer is read with a cathetometer to 50.0001 cm. The solubility cell is constructed with a Teflon stopcock so that there is no contamination of the sample by vacuum grease. The sample is stirred magnetically and thermostatted to t0.05°C. The vacuum in the system is monitored with a thermocouple gauge (Veeco type RG-3 1 X). The line volume (which is all capillary tubing) and the dead volume (the volume between the first stopcock leading to the line and the liquid level in the solubility cell) were dctcrmined with research grade helium assuming He to be an ideal gas. The line volume was 15.53 5 0.08 cm3; the dead volume (cell empty) was 34.12 ? 0.25 cm7. Temperatures were monitored with a five junction chromel-alumel thermocouple referenced to an ice bath. In order to check for any adsorption of COz on the glass walls of the tubing, the line volume and dead volume were also calibrated with CO?, assuming ideal gas behaviour. The results were within 1.0% of those obtained with helium. (c) Vapour pressure and gas solubility tt1ea.suretnent.s
The procedures followed for these measurements are quite similar, and are briefly outlined here. The sample of water-t-butanol was first degassed under vacuum by at least five freeze-pump-thaw cycles, weighed, then stirred and thermostatted to the desired temperature. The equilibrium time required before a vapour pressure measurement was typically I h. For solubility measurements, the line volume was evacuated, typically to 0.0001 Torr, and then filled with COZto a pressure of about 700 Torr. The number of moles of C 0 2 in the line volume was determined from three volume/pressure measurements, the level of mercury in the manometer and the burette was then adjusted to give the desired pressure of COa, and the gas was admitted to the sample cell. When equilibrium was reached after about 1 h, the first stopcock was closed and the number of moles of C 0 2 remaining in the line
3404
CAN. J. CHEM. VOL. 63, 1985
TABLEI. Experimentally measured vapour pressures of t-butanol-water mixtures I0.OO0C
Can. J. Chem. Downloaded from www.nrcresearchpress.com by MICHIGAN STATE UNIV on 01/24/17 For personal use only.
XI (30.0002)
PTo.F (lo-' atm)
1 .0o0c x2
(70.0002)
P~~," (lo-' atm)
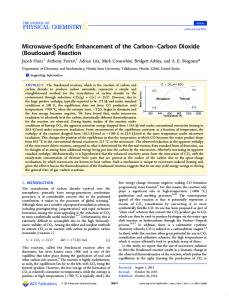
FIG. I. Vapour pressures of t-butanol-water mixtures at 10.OO°C:
A , experimental points; -, computer-fitted curves.
"Maximum experimental error: 20.07
X
10.' atm,
volume was measured. The number of moles of C 0 2 remaining in the dead volume could be calculated from the equilibrium pressure and the known dead volume; the number of moles of C 0 2 absorbed by the sample could thus be calculated. This procedure was repeated until at least five points were obtained for a Henry's law plot of P, VS.X3. At the end of the experiment the composition was determined through a measurement of the refractive index as the degassing procedure preferentially removed the alcohol and altered the initial composition. The typical time required for the complete experiment was 10 h. In calculating the number of moles of C 0 2 , the pressure was corrected for the non-ideality of the gas according to the virial equation of state with values of coefficients from ref. 7. For these calculations the gas temperature was assumed to be the room temperature in the line volume and the sample temperature in the dead volume. The dead volume was corrected for the volume of the sample using densities of water-t-butanol solutions found in ref. 8 for 10°C and 25°C; densities at 0°C (9) were used to correct the dead volume for measurements at 1°C. Clearly the gas contained in the dead volume consists of both carbon dioxide and sample vapour, but it can be assumed that the line volume contains only carbon dioxide since it is composed of capillary tubing, and as pressure changes from the line volume to the dead volume were always positive. 'The gas pressure was corrected for the presence of sample vapour in the dead volume through an iteration procedure assuming Raoult's law. (d) Refractive index measrtrements Refractive index measurements were made with an Abbe refractometer (Officione Galileo) thermostatted at 25.00 5 0.05"C. Using solutions prepared from t-butanol dried over 4A molecular sieves, a calibration curve was constructed and fitted to a sixth-order polynomial. The composition of all water-t-butanol solutions prepared were then calculated from refractive index measurements. In the composition region of most interest (XI - 0.1), X2 could be obtained to an accuracy of ?0.0001 by this method. At higher (>0.4) ranges of XI, n is not as sensitive to X2 and the accuracy was lower (+0.0005 to +0.001 mole fraction alcohol). (e) pH measurements Measurements of pH were made with a combination glass Ag/AgCI electrode (Fisher 13-639-92) and a digital pH meter (Fisher Model
620). The pH meter calibration was checked by using buffer solutions at pH 4, 7, and 10. For the measurement of the pH of water-t-butanol solutions, the water was first degassed by refluxing and then sparged continuously with argon during the experiment. Solid t-butanol was gradually added to the solution, which was magnetically stirred and thermostatted to 25.00 2 0.05"C. For the measurement of the pH of water - t-butanol - carbon dioxide solutions, a water- t-butanol solution was first degassed under vacuum by several freeze-pump-thaw cycles. The solution was then quickly transferred to the measuring flask and carbon dioxide was bubbled continuously through the sample. The pH reading usually equilibrated within minutes. The refractive index of the solution was tested immediately after a pH reading was taken to check the solution composition.
Results (a) The solvent system water-t-butanol The vapour pressures of water-t-butanol mixtures were measured over the concentration ranges where the samples were liquid at 10.OO°C and l.OO°C. The vapour pressure of pure t-butanol and water were taken from ref. 10 as it was difficult to reach equilibrium when the system contained only water. The vapour pressures at 25°C have been measured previously by Brown and Ives (1 1). The experimental vapour pressures are given in Table 1. The shapes of the total vapour pressure curves for 10°C (Fig. 1) and 1°C are similar to that reported by Brown and Ives for 25°C and by Kenttamaa et al. at 25, 50, and 75°C (2). Brown and Ives used an equilibrium still to make their vapour pressure measurements i n d were able to determine the composition of the vapour phase with this apparatus. The partial pressure of each component was then calculated by an application of the Duhem-Margules relation. Using their data for the partial pressure of each component at 25"C, the partial pressures at other temperatures could be calculated under the assumption that the activity coefficient of the water is relatively insensitive to temperature. The calculations were done as follows. The activity coefficient of water, y , , was calculated from the partial pressure of water at 25°C according to Raoult's law. It was then assumed that the activity coefficient of water changes negligibly (within experimental error) in the temperature range 1-25°C. This
KRUUS AND HAYES
Can. J. Chem. Downloaded from www.nrcresearchpress.com by MICHIGAN STATE UNIV on 01/24/17 For personal use only.
TABLE2. Vapour pressures, activity coefficients, and AG; for water-t-butanol mixtures
I
8
0.2
0.6
0.4
I
0.8
I
1 1.0
x2
FIG.2. Activity coefficients of r-butanol and water determined from vapour pressures. -data for y, as taken from refs. 2 and I I for 25.0°C. The y, curve is assumed temperature independent. 1, data at 50.0°C from ref. 2.
assumption seems justified, as t h e y , values at 50°C from ref. 2 are essentially the same as those at 25°C from refs. 2 and 11 (Fig. 2). The partial pressure of water at a given temperature was then calculated and the partial pressure of t-butanol determined by subtraction from the known total pressure. 'The activity coefficient of t-butanol is thus
The activity coefficients calculated in this manner were found to be consistent with the Gibbs-Duhem relation to within about 0.8%. The smoothed data for the system at 25, 10, and 1°C are tabulated in Table 2. T h e rms deviation for the computer fit of the total pressure curves obtained in this study ranged from (0.04 to 0.12) x lo-' atm; the data of Brown and Ives were fitted with an rms deviation of about 0.24 X lo-' atm. This is another indication that no great errors are introduced by assuming y , to be independent of temperature from 0 to 25°C. The large positive deviation from Raoult's law of the alcohol partial pressure is seen in Fig. 1, and more clearly in Fig. 2 where the activity coefficients of t-butanol and water as a function of solution composition are given. T h e activity coefficient of t-butanol exhibits a temperature-dependent maximum at a low mole fraction of alcohol (X? = 0.04 at 2S°C, 0.05 at IO°C, and 0.07 at 1°C). The data of Kenttamaa et al. (2) are not detailed enough to note the value of X 2 at which y 2 is a maximum. T h e magnitude of their maximum value of y? does, however, also show an increase with temperature, as in Fig. 2. For 25°C they report yZ,,,,, = 10.7 at X2 = 0.033, for 50°C, yr,,,l.lx= 15.7atX2=0.011,andfor75"C, y?,,,,, = 2 5 . 5 a t X 2 = 0.010. T h e excess Gibb's free energy of mixing AG;, is defined by the relation: The AG; values calculated for water-t-butanol mixtures at different temperatures are illustrated in Fig. 3. T h e maximum AG; values occur at X? 0.4, a s in the case for higher temperatures (2). It is in principle possible to calculate AHM and AS; from a knowledge of the temperature dependence of AG;, but the data obtained here are not detailed enough for a meaningful calculation.
-
3406
CAN. J . CHEM. VOL. 63. 1985
TABLE3. Solubility of C 0 2 in water-t-butanol mixtures 7' = 25.OO0C
xz
Can. J. Chem. Downloaded from www.nrcresearchpress.com by MICHIGAN STATE UNIV on 01/24/17 For personal use only.
(30.0002)
k~ (atm)
7' = 10.OO°C
AG:,,~ (kJ mol-I)
xz (70.0002)
k~ (atm)
T = I .OO°C
AGL
(kJ rnol-I)
xz (70.0002)
kt, (atm)
AGR,
(kJ mol-')
x2
FIG. 3. Excess free energy of mixing of t-butanol-water mixtures.
(b) Solubility of carbon dioxide in t-butanol-water mixtures The accuracy of the experimental method used to calculate the solubility of C 0 , can be estimated by comparing the results for the solubility of C 0 , in pure water at 25.00°C with those available in the literature (12- 14). The value obtained in this study agrees with the literature values to within 3%. Some of this deviation arises from the ideal gas assumption used to convert the Henry's law constant to the Bunsen coefficient and the Ostwald solubility coefficient for comparison with the literature values. However, the main source of error in this experiment was the assumption that the gas in the dead volume is at the same temperature as the sample. It is, however, difficult to apply a correction to the thermal gradient from the sample to the room temperature. Such errors would have negligible effects in considerations of relative solubilities. Plots (P, vs. X,) for the solubility of CO, were linear to within an average standard deviation of 1.5% (Table 3) with no regular deviation from linearity. The pressures used were sufficiently low so that the error introduced in replacing fugacity by partial pressure is negligible (1%) and the second term in the expansion P3 = kHX3 k ' ~ : . . gives a negligible contribution. The intercepts of the lines did not always pass
+
+.
FIG. 4. Henry's law constant, k H ,as a function of t-butanol concentration at 25, 10, and 1°C.
through zero pressure as expected. The small positive intercept values noted are probably due to incomplete degassing and the assumption of uniform dead volume temperature. Figure 4 shows that there is at all three temperatures a minimum in solubility (maximum in k,) at low X2. It was not possible to determine the point of minimum solubility more precisely, as the solvent composition changed in the degassing procedure and could not be exactly predetermined. The free energy change of solution, AG:~,, was calculated from the Henry's Law constant and is included in Table 3. The enthalpy change, AH:,, and entropy change, AS!,,, of solution at 10°C as a function of alcohol concentration are shown in Fig. 5. The shapes of these curves are similar to those for the solution of CO, in water-ethanol (4).
Can. J. Chem. Downloaded from www.nrcresearchpress.com by MICHIGAN STATE UNIV on 01/24/17 For personal use only.
KRUUS A N D HAYES
FIG. 5. Free energy, enthalpy, and entropy of solution of carbon dioxide in t-butanol-water mixtures at 10°C. junction potential. The latter effect is negligible as compared to experimental error. The effect of the changing dielectric constant on the ionization constant of water must also be considered. Woolley et al. (15) have obtained measurements of Kw in t-butanol-water mixtures, from which the change in pH due to the change in Kw can be predicted. In Fig. 6, the "predicted" pH curve and the experimental pH curve obtained in this study are seen to be similar in value and in slope for dilute solutions. In aqueous media at pH less than 7, carbon dioxide species exist as C02(aq), H,CO,(aq), and HCO,(aq). Assuming that [COdaq)] >> [H2CO,(aq)] (16); [HCO,(aq)l = [Ht(aq)l OH, the first dissociation constant of carbonic acid can be written as
FIG.6. pH of t-butanol-water and t-butanol-water-C02 mixtures t-butanol-water mixtures sparged with Ar; ---,predicted at 25°C. 0, pH of t-butanol-water mixtures from Kw values; a,t-butanol-water mixtures sparged with COz. (c) pH measurement The measurements of t-butanol-water mixtures with an argon and a C 0 2 sparge are illustrated in Fig. 6. Addition of t-butanol to pH 4, 7, and 10 buffers indicated a small linear increase in pH readings with addition of alcohol in all three cases. Such a change can be related to the change in the pK of the buffer due to the addition of t-butanol and a change in the
The concentration of C02(aq) can be determined from the known solubility of CO, in t-butanol-water mixtures so that it is possible to calculate the values of pKI shown in Table 4. The standard state used here is that for the molarity composition scale in order to be consistent with other data (16). The value of pK; in pure water calculated from the experimental pH is 5.92, as compared to Harned and Davies' (16) value of 6.352. The increase in pKI indicated in Table 4 is to be expected since the dielectric constant of the solvent is decreasing. The distance of closest approach, d, of the two ions formed by the dissociation of carbonic acid (Ht and HCO,) can be estimated from a plot of In K ; vs. 1 / ~using the Fuoss equation. The value obtained using the relative permittivity values from ref. 1 1 is 0.11 nm, which is of the correct order of magnitude.
Discussion (a) The solvent system water-t-butanol Figure 7 summarizes the behaviour of some "continuum" properties of water-t-butanol in the low X2 range. Ultrasonic absorption and Rayleigh scattering are included in Fig. 7 as
3408
CAN. J. CHEM. VOL. 63, 1985
TABLE 4. pKI of carbonic acid in I-butanol-water mixtures at 25OC
XZ
Can. J. Chem. Downloaded from www.nrcresearchpress.com by MICHIGAN STATE UNIV on 01/24/17 For personal use only.
(20.0002) 0 0.0163 0.0300 0.0346 0.0567 0.0623 0.0840 0.1300 0.2810
(X
Xi" 10")
6.28 6.25 6.2 6.05 6.1 6.6 7.7 10.6 22.
[c02(aq)lh pH' (x (*o.oI) 3.4 3.26 3.11 2.9 2.8 2.96 3.2 3.89 5.8
3.69 3.78 3.85 3.88 4.00 4.03 4.14 4.39 5.20
GI
(x 2.04 1.66 1.41 1.32 1.00 0.933 0.724 0.407 0.063
~ K I
5.92 6.07 6.19 6.23 6.46 6.53 6.79 7.37 9.17
"Calculated from k,, at I atm. hIn mol L - ' . ' Obtained by fitting experimental pH values to a straight line; standard deviation of fit = 0.09.
they involve interactions with sufficiently large wavelengths of sound and light, respectively, to be considered in terms of continuum models (5, 6). Analyses of such data have also been carried out on the basis of molecular level models (17, 18). However, extrema in such properties are fundamentally related to extrema in the chemical potentials (or their derivatives) of the components. A desirable test of molecular-level models would be to use them to predict data for fundamental properties such as activities in addition to the more specific derived properties. Deviations from Raoult's law for mixtures indicate non-ideal interactions between the solute and solvent molecules. The strong positive deviation of y2 in water-rich solution indicates that the alcohol molecules are on the average in a less favourable environment despite the possibility of formation of favourable hydrogen bonds with the water. This positive deviation arises from the strong interaction between the bulky, hydrophobic alkyl group of the alcohol and surrounding water molecules. It is interesting to note that the magnitude of this positive deviation in y, becomes greater as temperature increases (Fig. 2 and ref. 2). This phenomenon of "hydrophobic hydration" is thought to increase the water structure in the immediate vicinity of the hydrophobic residue. The sharp maximum which occurs in y? at about X2 = 0.05 at 25OC can be interpreted as corresponding to a maximum in the structuring effect on the surrounding water. At concentrations of alcohol greater than this maximum, the addition of further alcohol causes a rapid destruction of the water structure. The shift of the maximum to slightly lower alcohol concentrations (Fig. 2) and the increase in y2,,,, (Fig. 2, ref. 2) as the temperature is raised may be due to the smaller degree of structuring present in pure water. At higher temperatures, the structuring caused by the alcohol can be greater, but will be destroyed at lower alcohol concentrations due to greater thermal motion. Desnoyers and colleagues (19, 20) have suggested that the sharp extrema in various thermodynamic properties of tbutanol-water solutions are due to transitions which resemble micellization. These "microphases" cannot be called micelles however, because alcohols do not form well-defined aggregates in water. Mikhailov (21) has predicted the activity coefficients of ethanol and water in mixtures covering the entire concentration range based on the model he has proposed for aqueous solutions of nonelectrolytes. The predicted activity coefficient curves exhibit a sharp maximum in y,,,, in dilute solution and
FIG.7. Properties of t-butanol-water mixtures at 25OC: y2 activity coefficient of TBA (this work), k , solubility of carbon dioxide (this work). +c apparent molal heat capacity of TBA (8), cPv apparent molal volume of TBA (8). R , Rayleigh scattering intensity (18). a / f 2ultrasonic absorption (26).
a positive deviation in y , in more concentrated solutions. These features agree well with the curves experimentally obtained for t-butanol-water in this study. The component activities in the system water-t-butanol obtained at three temperatures in this study are fundamental in understanding all equilibrium continuum properties. It seems desirable to check proposed models of systems against these data as well as against data derived from them.
( b ) Solubility of carbon dioxide The Henry's Law constant is related to the Gibbs free energy of solution as AG:,,, = -RT In k,,. The AG;, for carbon dioxide in t-butanol-water mixtures over the entire mole fraction range at 25°C is shown in Fig. 8 as a function of both mole and volume fraction. The experimental data can be compared to an "ideal" curve where where f refers to either mole or volume fraction and A G : ~ , . ~ (= -RT In kH,J refers to the Gibbs free energy of solution of
CO? in pure t-butanol. When AG:~,is plotted as a function of the volume fraction of t-butanol, the curve retains the same features as the mole fraction dependent curve. The curves can be compared to the "ideal" curve by considering the excess free energy of solution, AGf0, = A G ~ ~-, ,AG:,. For the volume fraction curve, A C ~ ~ ,
3409
KRUUS AND HAYES
Can. J. Chem. Downloaded from www.nrcresearchpress.com by MICHIGAN STATE UNIV on 01/24/17 For personal use only.
TABLE 5. Activity coefficient of COz in COz-H20TBA mixtures at 25.00°C
FIG. 8. - AG:~,, for carbon dioxide solubility in r-butanol-water mixtures at 25.0°C as a function of mole fraction (@) and volume fraction (0) of 1-butanol. --- AG:,, (see text for definition).
will be positive over the whole concentration range; whereas for the mole fraction curve AG:,, becomes negative at about Xz = 0.1. The data are analyzed in both ways, as in a study of the solubility of electrolytes in aqueous non-electrolyte solutions, the solubilities were best fitted by an expression incorporating the volume fraction rather than the mole fraction of the organic cosolute (22). When the solute molecules interact primarily with individual solvent molecules, then it is more reasonable to do the analysis using a mole fraction scale. When the interaction is primarily of a "continuium" kind, e.g. involving the dielectric constant, then a volume fraction scale is more reasonable. ~, The shape and temperature dependance of the A G ~ functions when considered on a mole fraction scale are for this system quite similar to those observed for the solubility of Ar, H2, and He as calculated by Lucas and Cargill (23). The difference noted are that the data of Cargill shows that AG,",,exhibits a small negative minimum at very low mole fraction of alcohol; and the absolute magnitudes of A G ~are , less than in the carbon dioxide - water - t-butanol system. From the AG;, curves for the solubility of CO, in tbutanol-water mixtures it is possible to calculate the activity coefficient of carbon dioxide from p.: = RT In y,. Several reference states can be used to express activity coefficients, but the meaningful one here is Raoult's Law, where the reference state for the solute is unit mole fraction. When the pressure is sufficiently low to equate fugacity and partial pressure, then the solute activity is defined as
where P: is the vapour pressure of the pure liquid solute. Thus the activity coefficient approaches unity as X, approaches the pure solute.
Using the value P ; = 63.49 atm at 25°C (10) the activity coefficients of carbon dioxide in the alcohol-water mixtures were calculated from the experimental Henry's Law constant at 25.00°C. The results (Table 5) indicate that the activity coefficient (and the excess chemical potential) of carbon dioxide in the mixture reaches a maximum at X? = 0.05. The activity coefficient of t-butanol in water also shows a maximum at this mole fraction (Fig. 7). The value of y, in water is about 15 times that in the alcohol, where it is close to unity. This indicates that the affinity of the carbon dioxide gas for the alcohol is similar to its affinity for liquid carbon dioxide. The free energy of transfer from water to t-butanol (Table 3) also reflects this difference. (c) Moclels for- the solubility of CO? in water-TBA
The variation of COz solubility with composition of the water-t-butanol mixture can involve energy, entropy, and volume effects. Scaled particle theory provides a method for estimating the importance of volume effects. Lucas and Cargill (23) have compared the experimental free energies of solubility of He, HZ,and Ar in water-ethanol and water-t-butanol mixtures with values predicted by the scaled particle theory (SPT). Their calculated excess free energies of solution show a similar dependence on alcohol concentration as that observed experimentally. The expression for the free energy of solution, AG:~,, derived from SPT is:
In [6], V is the apparent molar volume of the mixture, and G, is the free energy of cavity formation, given by:
i
[7] G,/RT = -In (1
+
[3Y/(l - y)'
-
y)
+ [3X/( I
- y)] D,
+ 4.5X2/(1 - y ) i ] ~ :+
NTP
D:]
where p equals 3 for y, 2 for X, and 1 for Y; D , , Dz, 0, are the hard sphere diametersof water, alcohol, and gas, respectively; V ; is the molar volume of pure water and + V , 2 is the apparent rnolal volume of the alcohol in the mixture. The contribution of the free energy of interaction, G,, was
3410
CAN. J .
CHEM. \'OL. 63, 1985
Can. J. Chem. Downloaded from www.nrcresearchpress.com by MICHIGAN STATE UNIV on 01/24/17 For personal use only.
The variation in the chemical potential of carbon dioxide in t-butanol-water mixtures as a function of alcohol concentration is qualitatively the same as the variation of the chemical potentiel of the alcohol itself. The minimum in the gas solubility in very dilute alcohol solutions corresponds to the maximum in the activity coefficient curve of t-butanol and shows the same trends with temperature. A qualitative explanation of the variation of the solubility of carbon dioxide with concentration would be similar to the explanation of the variation of the activity coefficient of t-butanol with concentration given earlier.
Acknowledgements The advice of Dr. G. C. Benson and Mr. T . Patraboy is gratefully acknowledged. W e also thank Dr. J. M . Holmes for providing us with an accurately calibrated gas burette. Financial aid for this work was provided through a grant from the Natural Sciences and Engineering Research Council of Canada.
AGE,,,
FIG. 9. Excess free energy of solution of CO? in t-butanolwater mixtures at 25OC. Curve I. Experimental (see Fig. 8). Curve 2. Scalcd particle theory. Curvc 3. Scaled particle theory, ideal volume of mixing.
AGE,,
neglected by Lucas and Cargill on the assumption that when a gas is transferred from water to another polar solvent, G I is very small. The calculated and experimental free energies of transfer from alcohol to water were found to be similar, which lends some validity to this assumption. 'The S P T and experimental values for the free energy of solution were compared by computing A G ~for ~ carbon , dioxide in water-t-butanol mixtures at 25°C using experimental apparent molar volumes (8). The computer program was tested by calculating the free energy of transfer of argon from water to t-butanol at 25°C. The value of 9.2 1 kJ mol-' computed at 25°C compares well with the value of 9.1 kJ mol-I computed by Lucas and Cargill at 12°C. The excess free energy of solution, A G ~ ,for , carbon dioxide is illustrated in Fig. 9. The AG:, used in Fig. 9 are calculated using the computed values of A G ~ ~and , ~AG;,,,; , these computed values are about three times the experimental values for the case D1 = 0.394 nm (24), D l = 0.2733 nm (24), and D 2 = 0.529 nm (25) (curve 2). The computed curve exhibits a small minimum at X2 = 0.015 and a maximum at X2 = 0.05. The minimum, which corresponds to a slight increase in carbon dioxide solubility, was not observed experimentally. This is possibly because the initial increase in solubility falls within the experimental error of the present study. The height of the computed maximum is much smaller than that observed experimentally. An increase in the alcohol diameter changes the magnitude and concentrations dependence of A G ~ dramatically, ~, but a corresponding increase in D, o r D l has only a slight effect, with no change in the shape of the curve. It is of some interest to compute the solubility of carbon dioxide in "ideal" water-t-butanol mixtures; that is, assuming that the volume of mixing is zero rather than using experimental values of the molar volume. Curve 3 in Fig. 9 shows the value of this "excess ideal free energy" to be positive and to reach a maximum at X2 = 0.1. The difference between curves 2 and 3 is an indication of the effect of the non-idealities of the system volume on the solubility of carbon dioxide. It is quite obviously a very important effect.
1. F. FRANKS.In Water, a comprehensive treatise. Edited by F. Franks. Plenum Press, New York. 1973. Vol. 2, chapts. 1 and 5; Vol. 4, chapt. 1. 2. J. KENTAMAA,E. TOMMILA, and M. MARTI. Ann. Acad. Sci. Fennicae AII, 93,3 (1959). 3. A. BEN-NAIM. J. Phys Chern. 71,4002 (1967). 4. R. W. CARGILL and D. E. MACPHEE. J. Chem. Res. (M), 2743 (1981). 5. W. D. T. DALE,P. A. FLAVELLE, and P. K ~ u u s Can. . J. Chern. 54, 355 (1976). 6. I. KATIME, L. C. CESTEROS, and C. STRAZIELLE. J . Chern. Soc. Faraday Trans. 2, 80, 1215 (1984). 7. American Institute of Physics Handbook. 3rd ed. McGraw Hill, New York. 1972. 8. C. DE V~SSER, G. PERRON, and J. E. DESNOYERS. Can. J. Chern. 55, 856 (1977). 9. R. G. ANDERSON and M. C. R. SYMONS. Trans. Faraday Soc. 65, 2550 (1969). 10. CRC handbook of chemistry and physics. 58th ed. CRC Press, Florida. 1979. 11. A. C. BROWNand D. J. G. IVES. J. Chern. Soc. 1608 (1962). 12. International Critical Tables. Vol. 111. 13. A.E.M~~~~~~andK.A.KOBE.Chern.Rev.28,519(194 14. J. LIVINGSTONE, R. MORGAN, and H. R. PYNE.J. Phys. Chern. 34, 1578 (1930). 15. E. M. WOOLLEY, D. G. HURKOT, and L. G. HEPLER.J. Phys. Chern. 74,3908 (1970); E. M. WOOLLEY, J. TOMKINS, and L. G. HEPLER.J. Solution Chern. 1, 341 (1972). 16. W. STUMMand J. J. MORGAN. Aquatic chemistry. Wiley Interscience, New York. 1970. 17. D. N. GLEW,H. D. MAK,and N. R. RATH.In Hydrogen-bonded solvent systems. Edited by A. K. Covington and P. Jones. Taylor and Francis, London. 1968. p. 195. 18. K. IWASAKI and T. FUJIYAMA. J. Phys. Chem. 81, 1908 (1977). 19. J. E. DESNOYERS. Pure Appl. Chern. 54, 1469 (1982). 20. G. ROUX, D. ROBERTS,G. PERRON, and J. E. DESNOYERS. J. Solution Chern. 9,629 (1980). 21. V. A. MIKHAILOV and L. I. PONOMAROVA. J. Stmct. Chern. 9, 8 (1969); V. A. MIKHAILOV. J. Stmct. Chern. 9, 332 (1968). 22. Z. B. ALFASSIand J. WEISS.Ber. Bensenges. Phys. Chern. 87, 890 (1983). 23. M. L u c ~ and s R. W. CARGILL. J. Phys. Chern. 81,703 (1977). C. F. CURTISS, and R. B. BIRD.Molecular 24. J. 0 . HIRSCHFELDER, theory of gases and liquids. Wiley, New York. 1966. 25. C. L. DE LIGNYand N. G. VANDER VEEN.Chern. Eng. Sci. 27, 391 (1972). 26. M. J. BLANDAMER, D. E. CLARK,N. J. HIDDEN,and M. C. R. SYMONS. Chern. Cornrnun. 341 (1966).